User Experience (UX) design isn’t just about aesthetics—it’s a strategic, research-driven framework for solving human problems.
With 88% of online consumers less likely to return after a poor experience (Forrester), and every $1 invested in UX yielding up to $100 in return (IBM), mastering this process is non-negotiable.
As a UX designer with 20+ years of field experience, I’ve seen this methodology transform startups into industry leaders.
Let’s dissect the five-stage UX design process, its tools, and real-world applications.
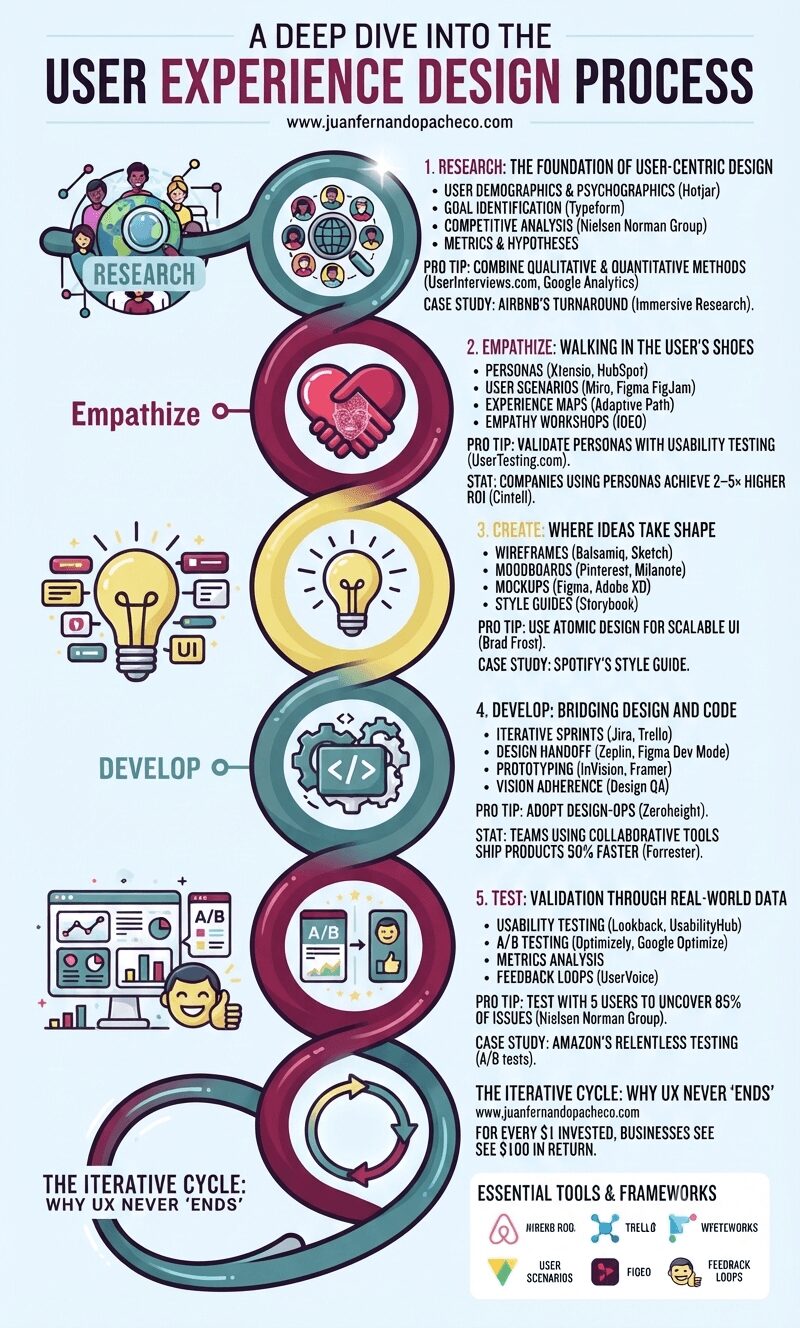
1. Research: The Foundation of User-Centric Design
“Know thy user” isn’t just a mantra—it’s science. Research prevents costly redesigns by aligning solutions with actual user behaviors.
Key Activities:
User Demographics & Psychographics: Segment users by age, tech literacy, and cultural context. Tools like Hotjar track demographics via heatmaps.
Goal Identification: What tasks do users prioritize? Use survey tools (Typeform, SurveyMonkey) to quantify pain points.
Competitive Analysis: Audit rivals’ UX strengths/gaps. Frameworks like Heuristic Evaluation (Nielsen Norman Group) identify usability violations.
Metrics & Hypotheses: Define success early (e.g., “Reduce checkout abandonment by 25%”).
Pro Tip: Combine qualitative and quantitative methods. User interviews (via UserInterviews.com) reveal why users act, while analytics (Google Analytics, Mixpanel) show what they do.
Case Study: Airbnb’s turnaround began with immersive research—founders lived with users to understand trust barriers, leading to features like verified IDs.
2. Empathize: Walking in the User’s Shoes
Empathy bridges data and humanity. It transforms abstract demographics into relatable stories.
Methods & Artifacts:
Personas: Create 3–5 archetypes representing core user segments. Use Xtensio or HubSpot’s MakeMyPersona for templating.
User Scenarios: Map tasks like “Booking a flight under 5 minutes.” Tools: Miro or Figma’s FigJam.
Experience Maps: Visualize emotional highs/lows across user journeys. Reference Adaptive Path’s guide.
Empathy Workshops: Conduct role-playing sessions with stakeholders using IDEO’s “Design Kit” methods.
Pro Tip: Avoid “imaginary empathy.” Validate personas with usability testing (UserTesting.com).
Stat: Companies using personas achieve 2–5× higher ROI on marketing campaigns (Cintell).
3. Create: Where Ideas Take Shape
This phase translates insights into tangible designs. Prioritize simplicity—Google’s HEART framework shows simplicity drives retention.
Step-by-Step Creation:
Wireframes: Sketch low-fidelity layouts focusing on functionality. Tools: Balsamiq or Sketch.
Moodboards: Define visual direction using Pinterest or Milanote. Align with brand psychology (e.g., blue for trust).
Mockups: High-fidelity static designs. Use Figma (collaborative) or Adobe XD.
Style Guides: Document design systems (colors, typography). Storybook streamlines component management.
Pro Tip: Use Atomic Design (Brad Frost) for scalable UI—start with atoms (buttons), build to pages.
Case Study: Spotify’s style guide ensures consistency across 100M+ screens—critical for usability at scale.
4. Develop: Bridging Design and Code
Designers and developers must speak the same language. 52% of teams cite poor collaboration as their biggest roadblock (InVision).
Best Practices:
Iterative Sprints: Work in 2-week cycles using Agile/Scrum. Tools: Jira or Trello.
Design Handoff: Annotate assets for developers with Zeplin or Figma Dev Mode.
Prototyping: Test interactions early using InVision or Framer.
Vision Adherence: Hold weekly “design QA” sessions to check implementation fidelity.
Pro Tip: Adopt DesignOps—standardize workflows with tools like Zeroheight for documentation.
Stat: Teams using collaborative design tools ship products 50% faster (Forrester).
5. Test: Validation Through Real-World Data
Testing isn’t a phase—it’s a continuous loop. Fixing issues post-launch costs 100× more (NIST).
Validation Methods:
Usability Testing: Moderate sessions via Lookback; unmoderated via UsabilityHub.
A/B Testing: Compare variants with Optimizely or Google Optimize.
Metrics Analysis: Track engagement (time-on-task), success rates (conversion), and error rates.
Feedback Loops: Embed tools like UserVoice in-app to collect ongoing input.
Pro Tip: Test with 5 users to uncover 85% of usability issues (Nielsen Norman Group).
Case Study: Amazon’s relentless testing—like tweaking button colors—drove a $300M revenue increase.
The Iterative Cycle: Why UX Never “Ends”
UX is a helix, not a straight line. Post-launch, return to Research to analyze new data. Tools like FullStory capture session replays to identify friction points. Frameworks like Lean UX (Jeff Gothelf) emphasize rapid iteration over perfection.
Key Takeaway: The ROI of UX isn’t hypothetical. For every $1 invested, businesses see $100 in return (Forrester).
Essential Tools & Frameworks
Research: Hotjar, SurveyMonkey, Google Analytics
Empathize: Miro, UserTesting.com, Xtensio
Create: Figma, Sketch, Adobe XD, Storybook
Develop: Zeplin, Jira, Framer
Test: UsabilityHub, Optimizely, FullStory
Frameworks: HEART (Google), Double Diamond (Design Council), Jobs-To-Be-Done (JTBD).
Conclusion: UX as a Business Imperative
Neglecting UX risks obsolescence. Brands like Apple and Tesla dominate by embedding user-centricity in their DNA. Start small: interview 5 users today. Map one customer journey. Test one button. The process compounds—each iteration deepens empathy, refines solutions, and ultimately, builds products humans love.
Further Reading:
Nielsen Norman Group: Usability 101
IDEO’s Design Kit: Methods
Google’s HEART Framework: Research Paper
Atomic Design: Book by Brad Frost