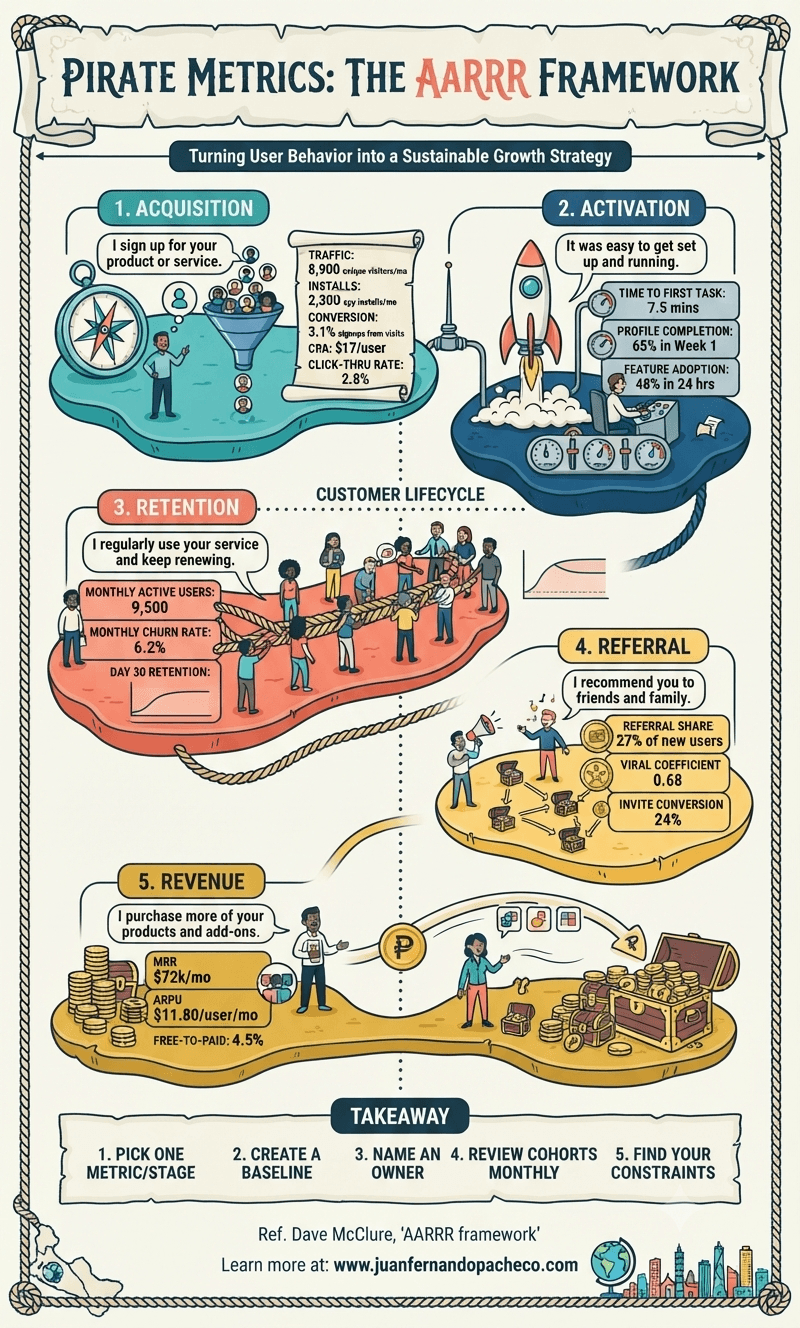
A practical, evergreen walkthrough of pirate metrics, the AARRR framework of acquisition, activation, retention, referral and revenue. It explains what to measure at each stage, how to read the numbers honestly, and how to use the lifecycle to find the real constraint in your growth model.
Author: Juan Fernando Pacheco
I am Juan Fernando Pacheco, a Business Development Manager, Senior Product Designer, and UX Designer with 20+ years of experience working on user-centered experiences, developing products and services driven by research and design.
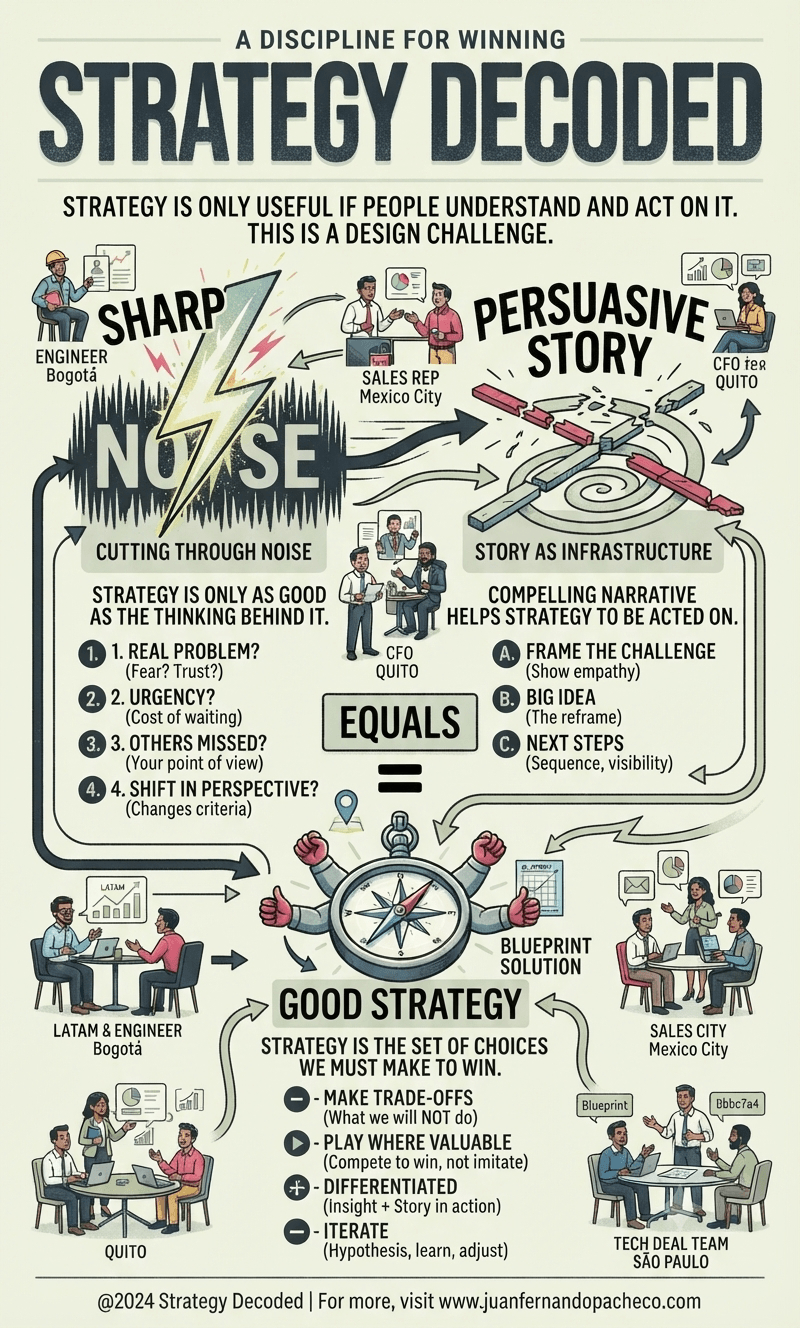
A good strategy is not a long document; it is a clear insight told as a persuasive story that people can actually act on. This post shows how to find what others miss, turn it into a message that sticks, and convert both into the choices that win deals, markets and careers.
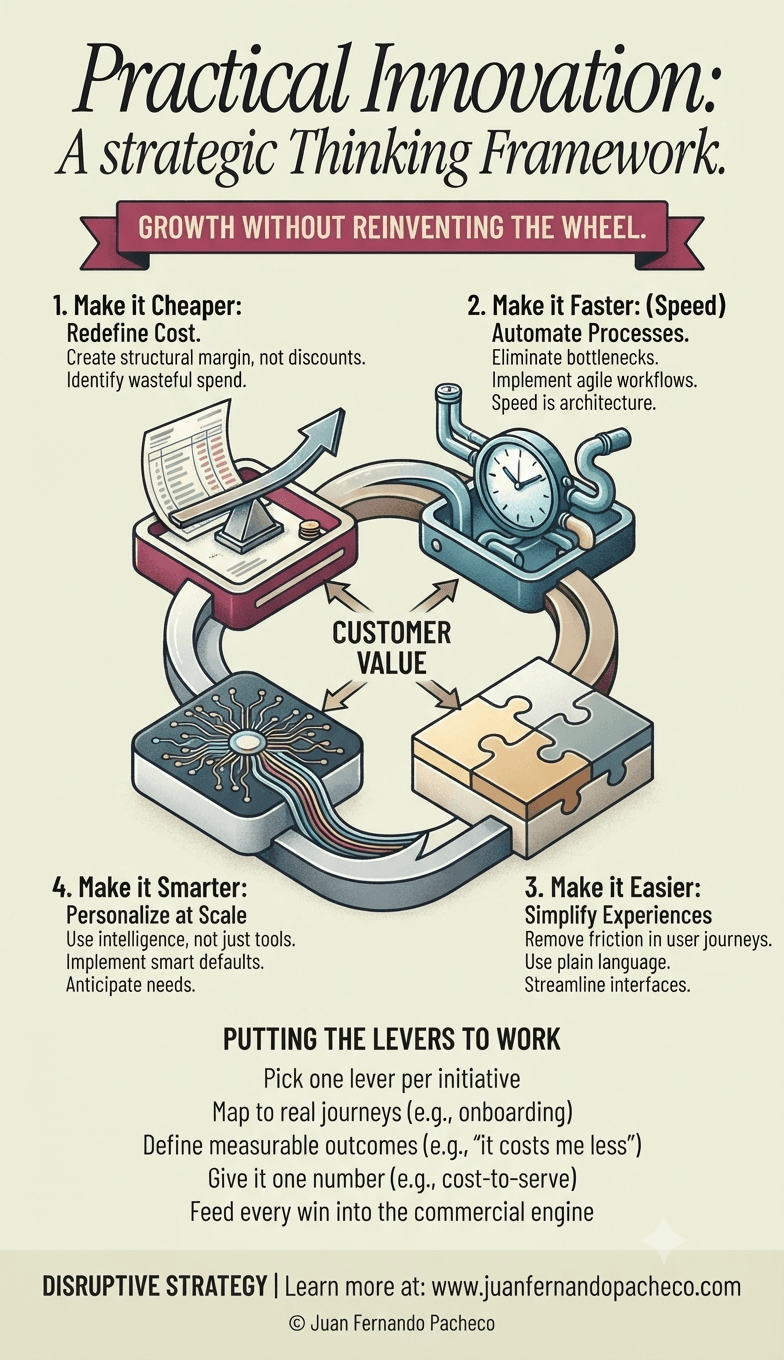
Lasting growth rarely arrives as a breakthrough; it arrives as a habit. This post breaks down the four levers of practical innovation — cheaper, faster, easier, smarter — and shows how to apply them to products, services and enterprise deals so the value keeps compounding for years.
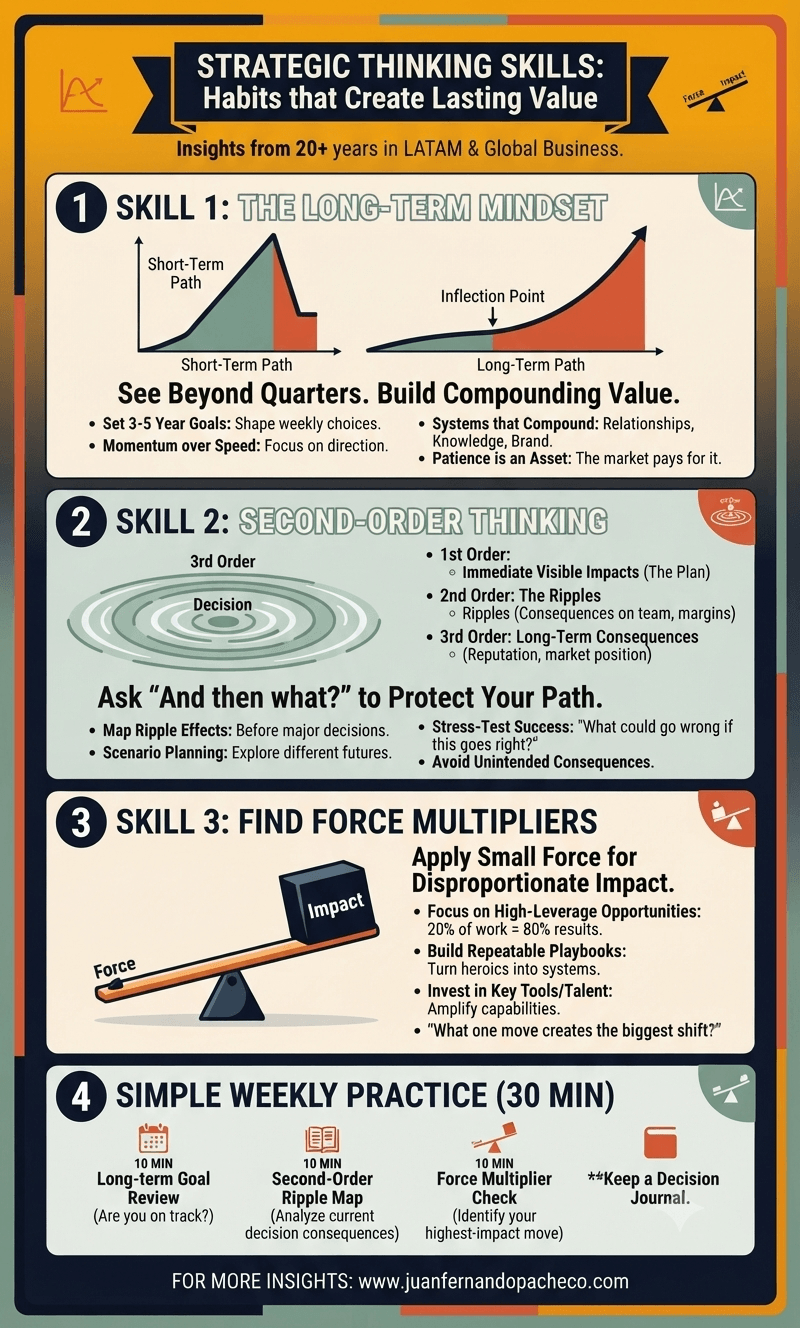
Strategy rarely fails for lack of analysis; it fails for lack of thinking discipline. This post breaks down the three skills that separate strategists from planners — long term mindset, second order thinking and the force multiplier — and shows how to apply them to deals, products and careers so the value compounds for years.
.](https://juanfernandopacheco.com/wp-content/uploads/2026/08/Influence-Skills-From-Insight-to-Action-for-Strategists.png)
Strategy fails more often in the room than in the analysis. This post breaks down the three influence skills — synthesis, storytelling and decision making — with practical habits that keep working no matter the year, the tool or the market.
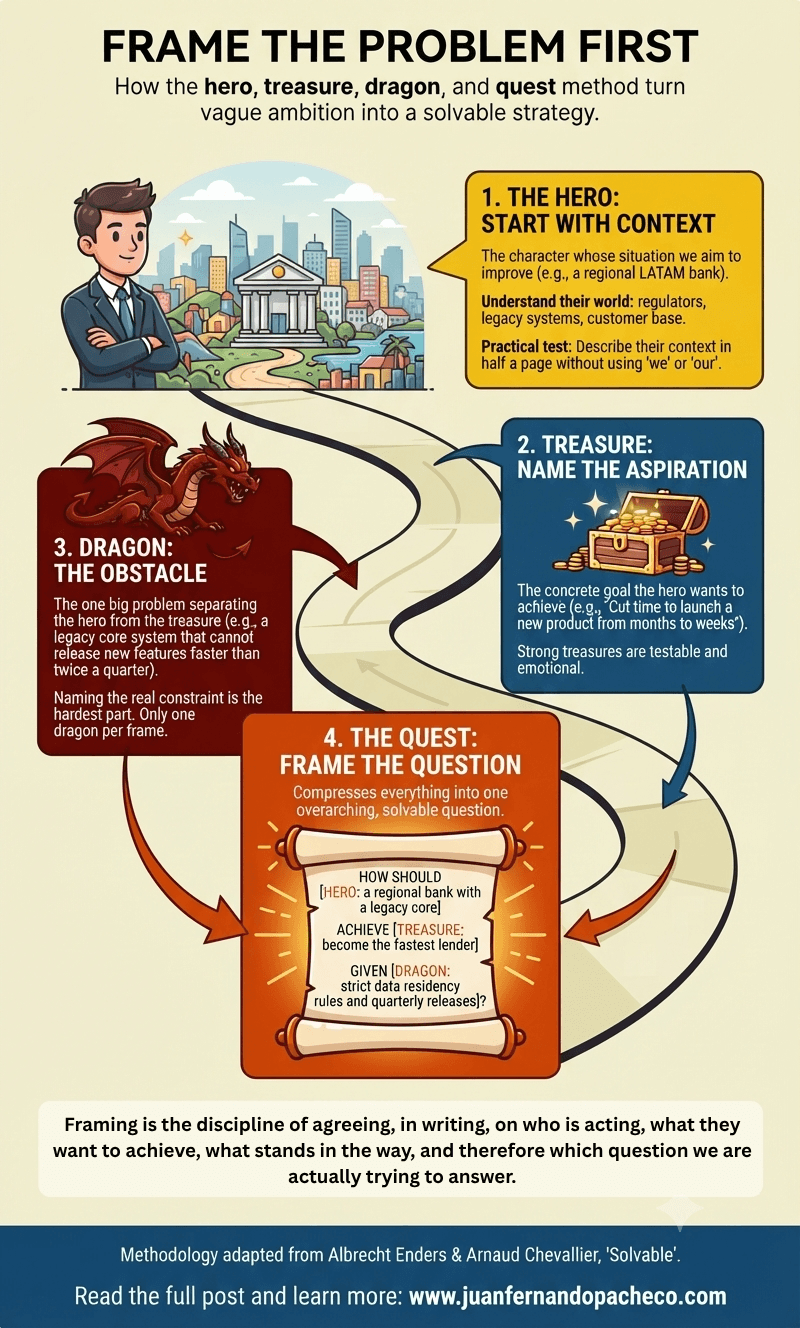
Most strategies and enterprise deals fail because teams rush to solve a problem nobody bothered to define. This post walks through a simple four part framing method (hero, treasure, dragon, quest) and shows how to apply it to products, sales deals and RFx processes so your effort always lands on the real issue.
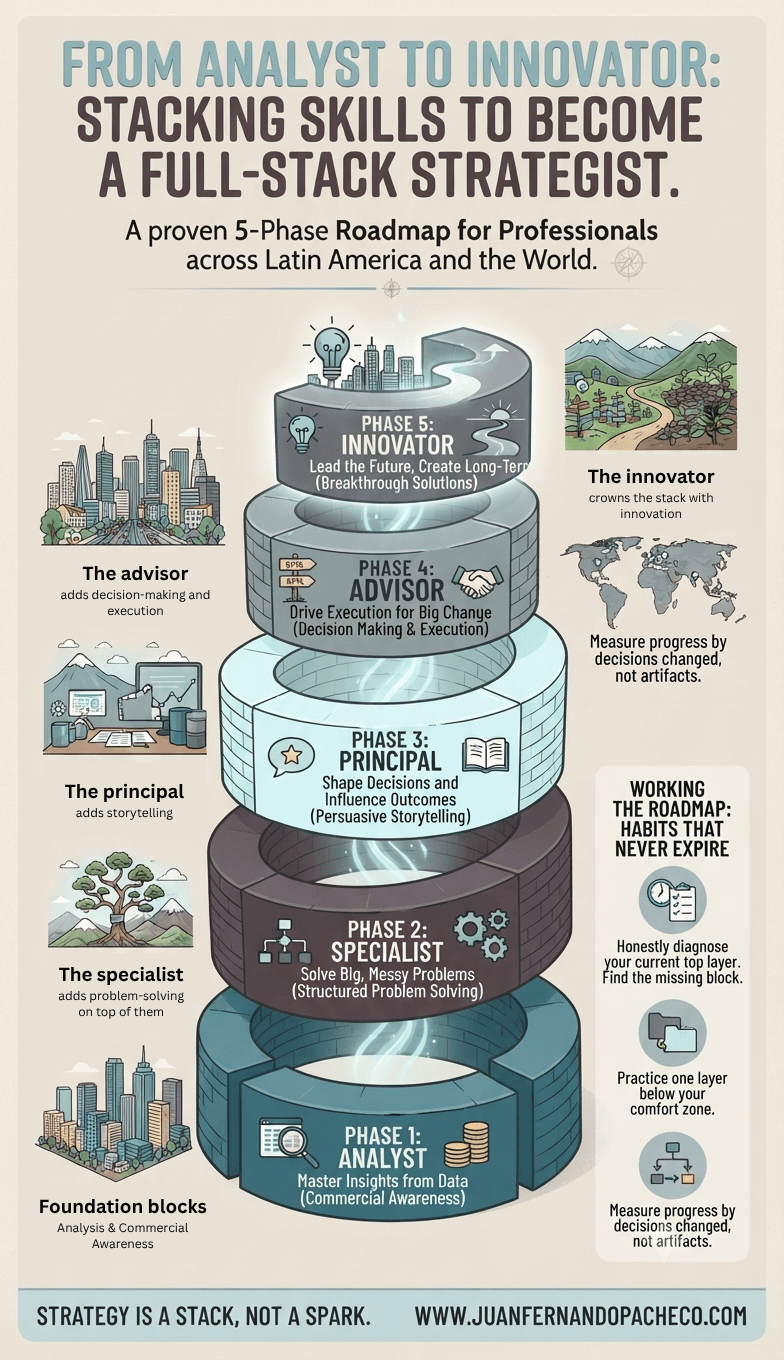
Strategy is not a title you are given; it is a stack of skills you build in a deliberate order. This post walks the five-phase roadmap — analyst, specialist, principal, advisor, innovator — and translates each layer into habits you can practice in any market, in any era.
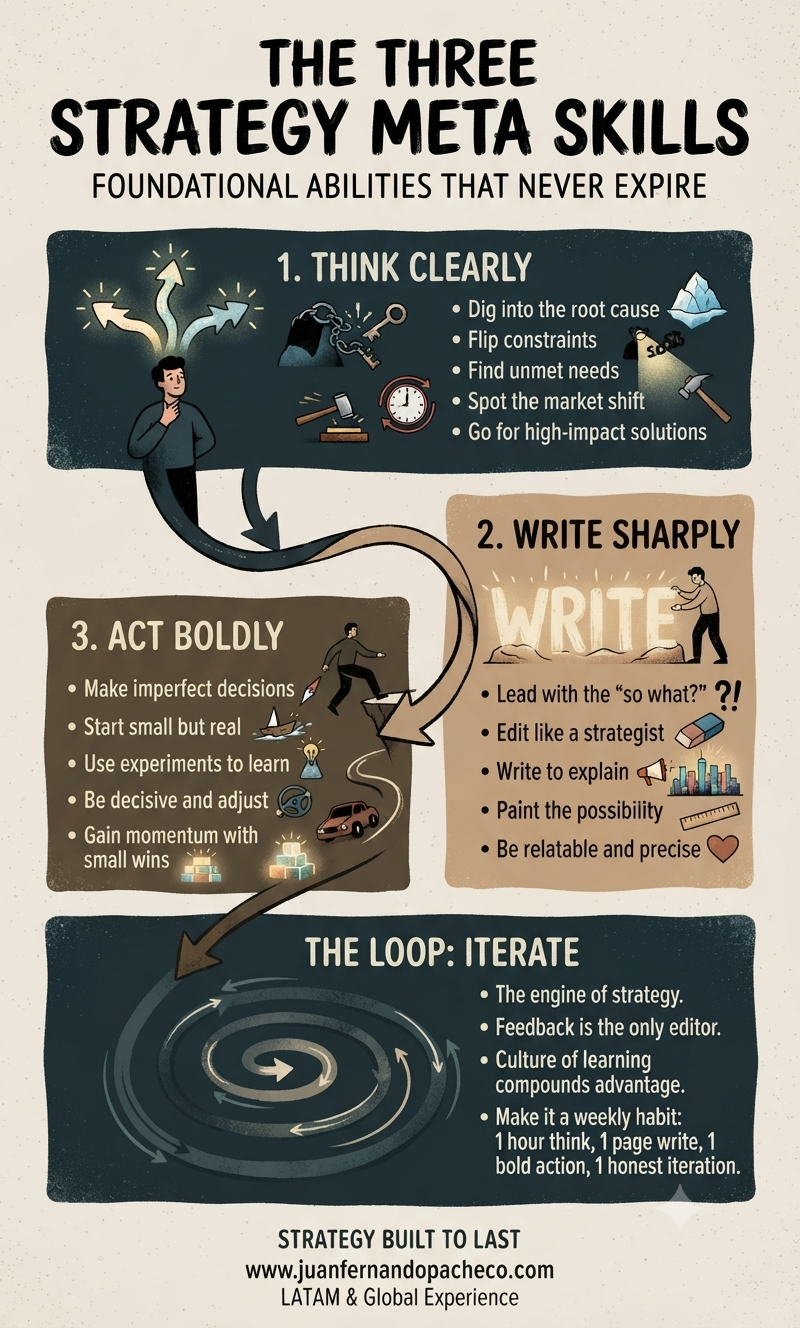
The three strategy meta skills that never expire. Most strategy fails quietly – fuzzy thinking, vague writing, hesitant execution. This post breaks down the three strategy meta skills (think clearly, write sharply, act boldly) and the iteration loop that turns them into a durable advantage, with lessons from two decades of product and deal leadership across Latin America.
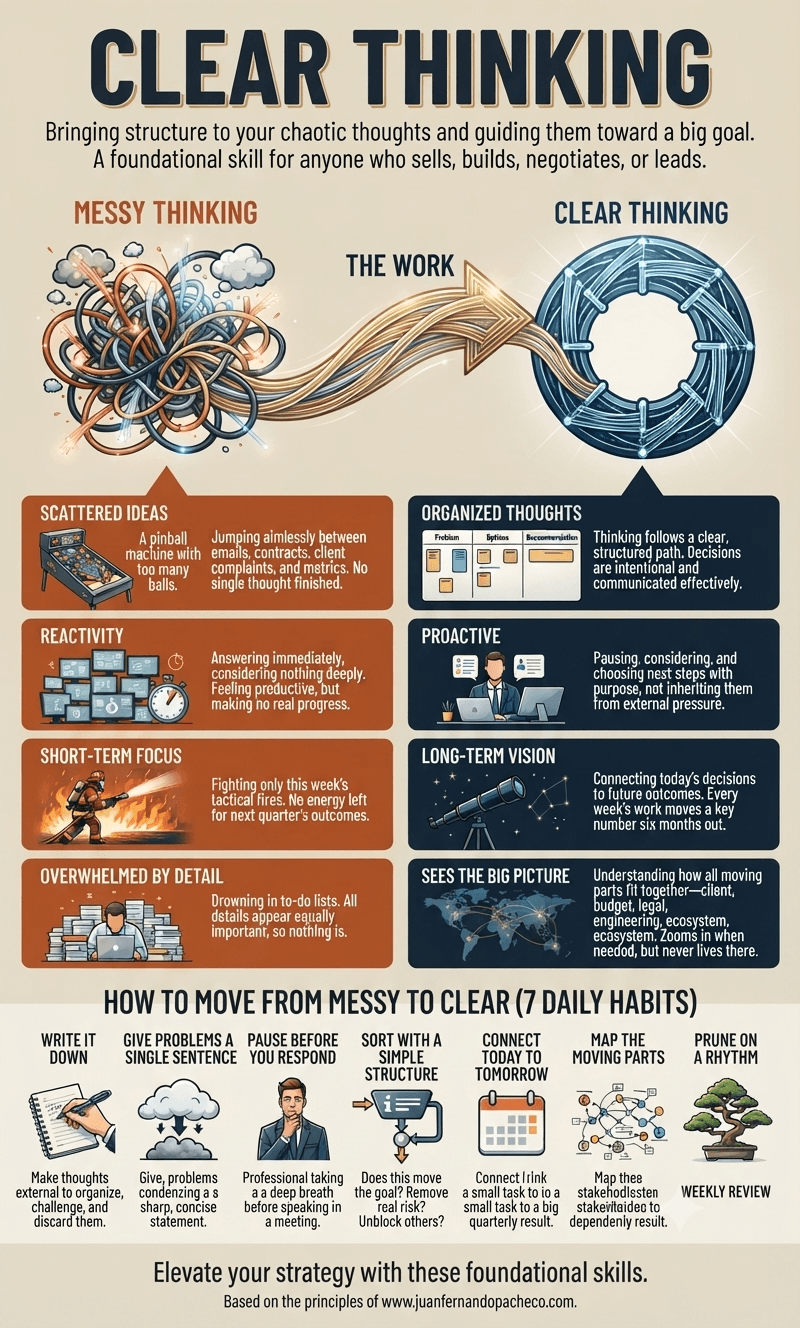
Clear thinking is the practice of bringing structure to your thoughts and guiding them toward a big goal, instead of juggling too many at once. This post looks at how messy thinking shows up in real commercial and product work, and how to build the organized, proactive, long-term habits that turn noise into judgment.
![An infographic titled "The Point of View Strategy Formula" on a light green background, illustrating a three-step process of Insight, Action, and Outcome. The Insight section shows an iceberg labeled "HUMAN TRUTH," the Action section shows a gear mechanism, and the Outcome section shows an upward-trending graph with a rocket. Below the steps, the formula reads: "This [key insight] means we should do [action] and it will create [outcome]." It includes sections on "Common Shallow Traps to Avoid" and "Case Examples" for a Designer, Business Developer, and Career Manager. The footer contains the URL "www.juanfernandopacheco.com".](https://juanfernandopacheco.com/wp-content/uploads/2026/08/The-Point-of-View-POV-Strategy-Formula-Infographic.png)
A clear point of view is the smallest usable unit of strategy. This guide breaks down the insight–action–outcome formula, shows how to pressure-test each part, and applies it to product decisions, enterprise deals, and career moves — as useful today as it will be in five years.