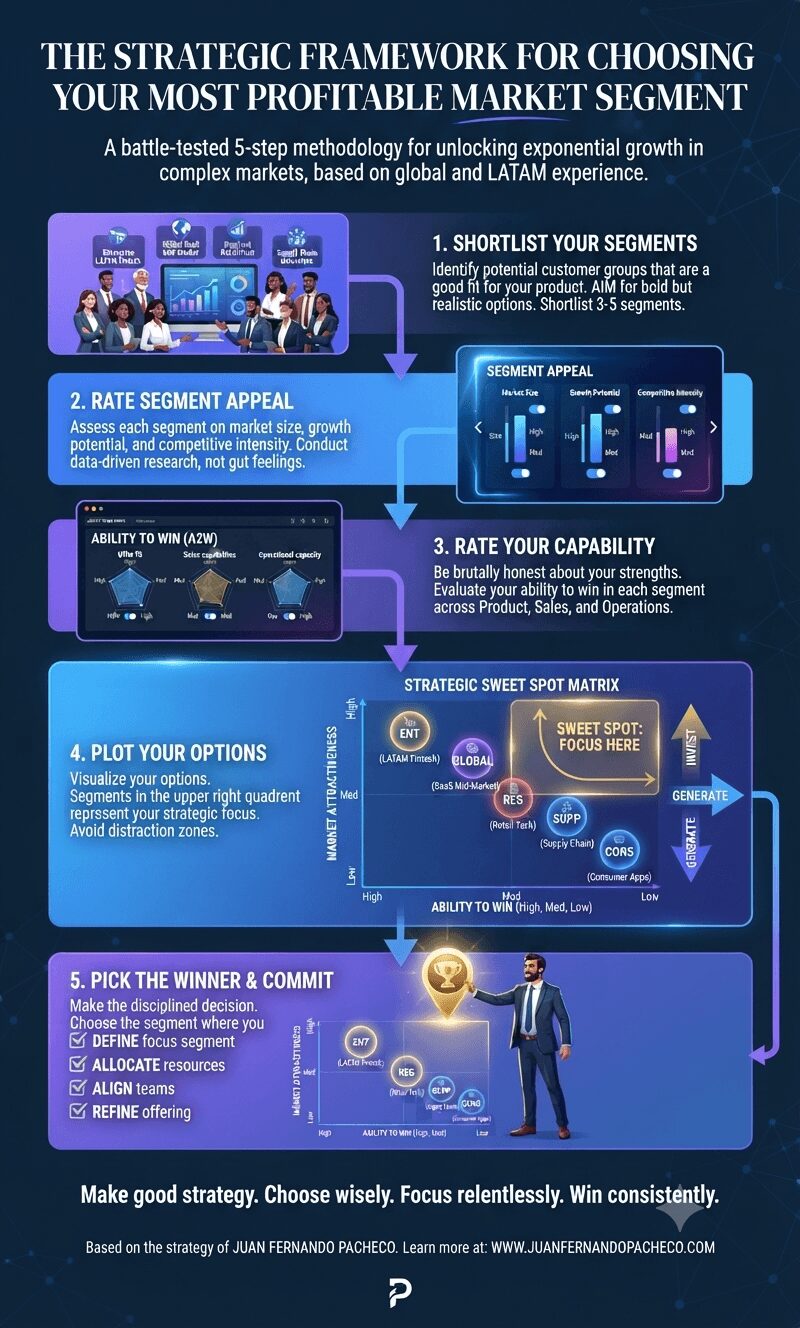
Learn a proven five-step framework to identify and dominate your most profitable market segment. Discover how to balance market attractiveness with your ability to win, ensuring sustainable growth and maximum impact.
Tag: Business Development
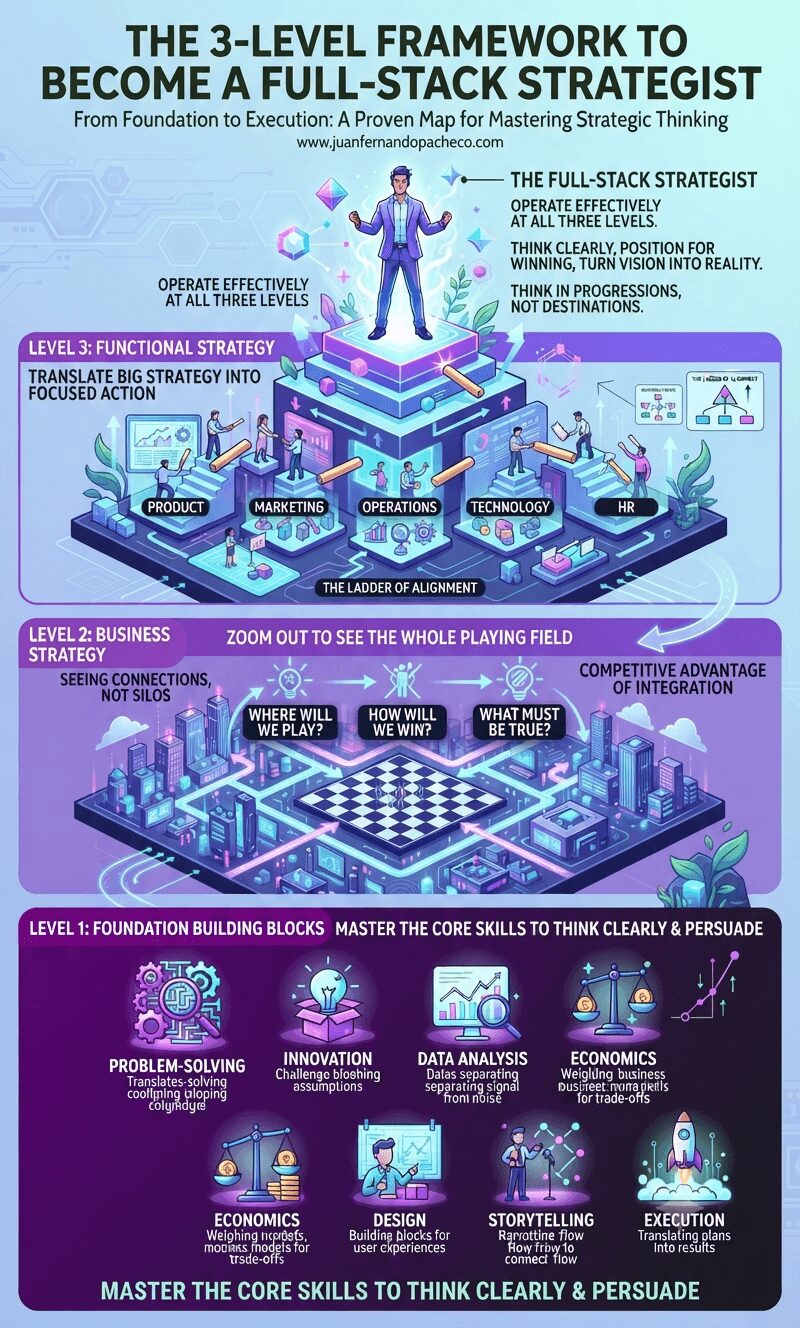
Strategy doesn’t have to be a mystery. Discover the proven 3-level framework that breaks down strategic thinking into foundation building blocks, business strategy, and functional strategy—transforming you into a full-stack strategist who can think clearly, position for winning, and translate vision into action.
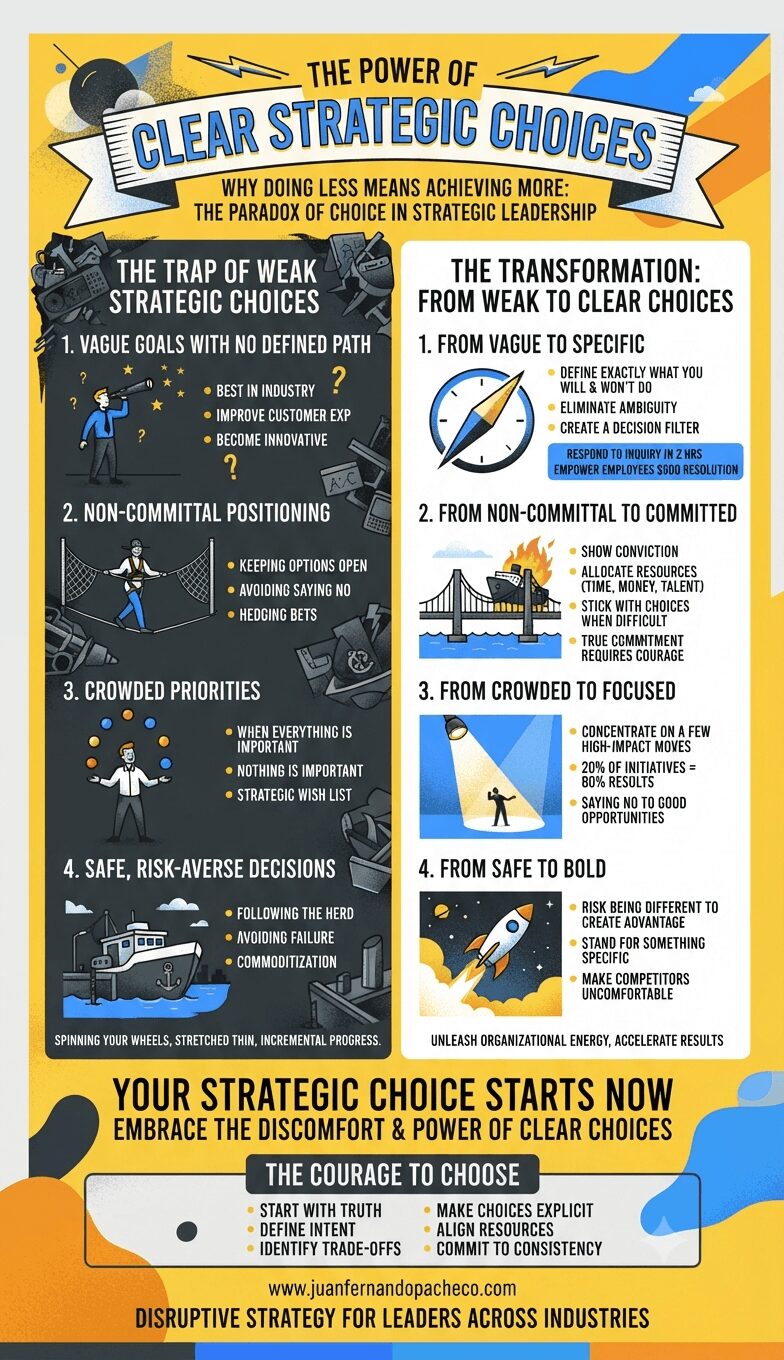
The journey from strategic confusion to clarity requires four essential steps: defining your vision, setting clear priorities, making necessary trade-offs, and committing fully to your choices.
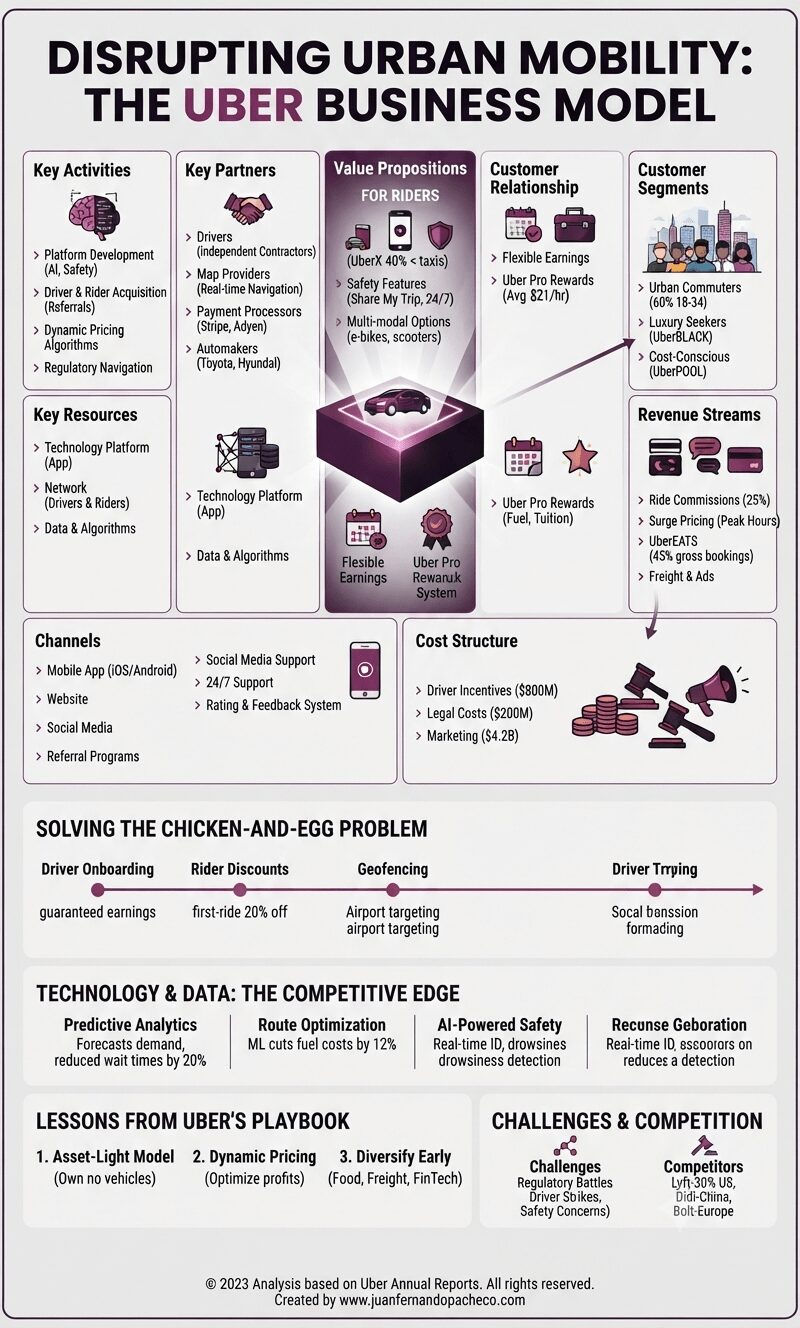
Uber’s relentless innovation—from self-driving cars to drone deliveries—positions it to dominate the future of mobility. By prioritizing scalability, data, and user experience, Uber remains a blueprint for disruptors worldwide.
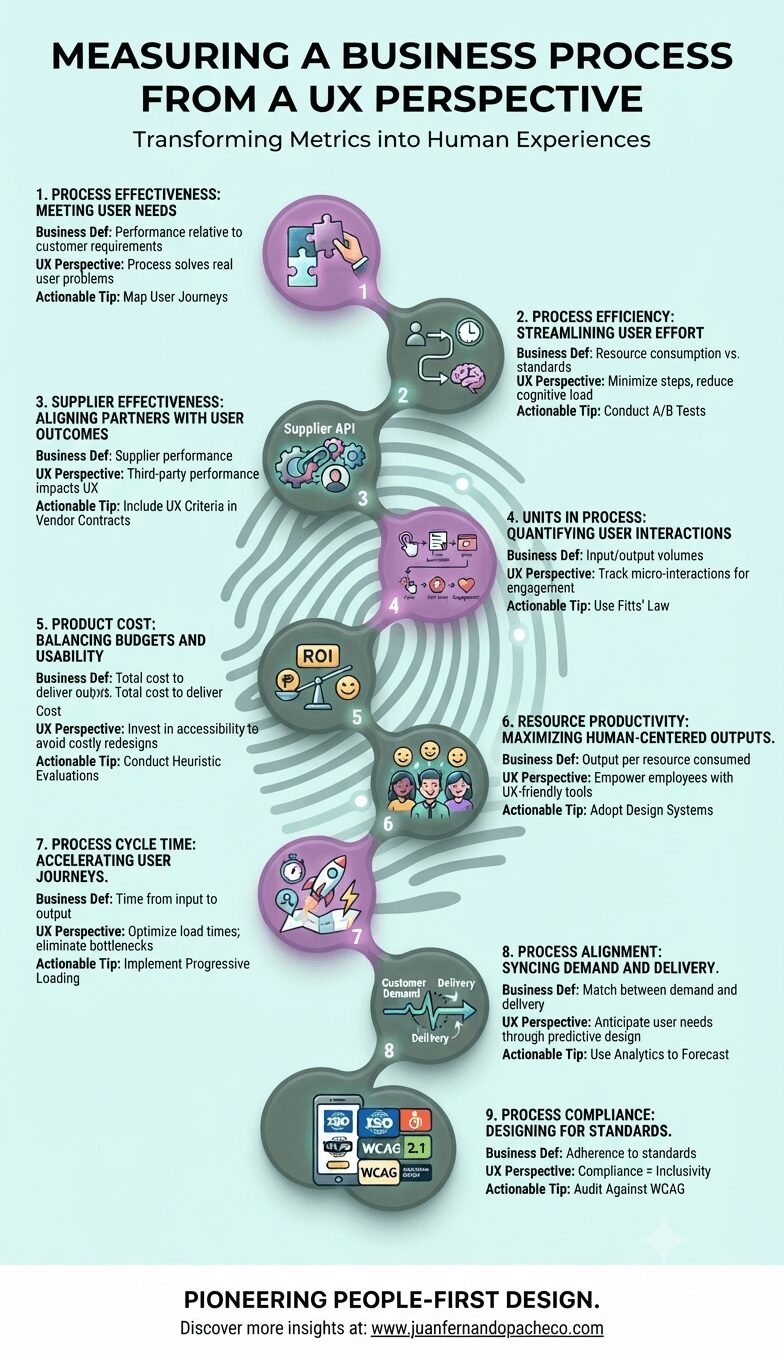
Measuring business processes through a UX lens transforms abstract metrics into human stories. By aligning efficiency with empathy, and compliance with inclusivity, organizations can create processes that delight users and drive ROI. As UX pioneers, our task is to ensure that every click, second, and dollar spent reflects a commitment to people-first design.
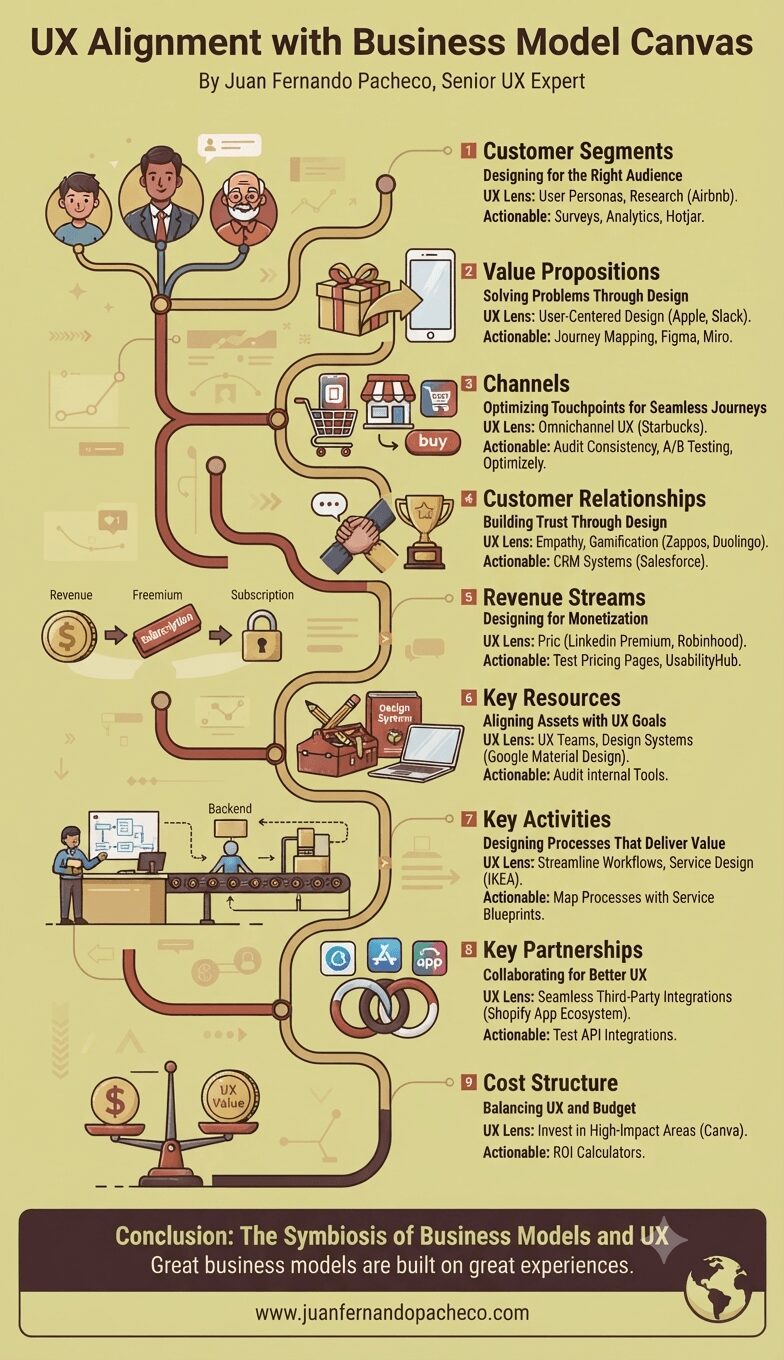
The Business Model Canvas isn’t just a strategic tool—it’s a blueprint for designing experiences that resonate. By aligning each building block with UX principles, businesses can create value that’s both sustainable and user-centric. Whether you’re a startup or an enterprise, remember:
Great business models are built on great experiences.
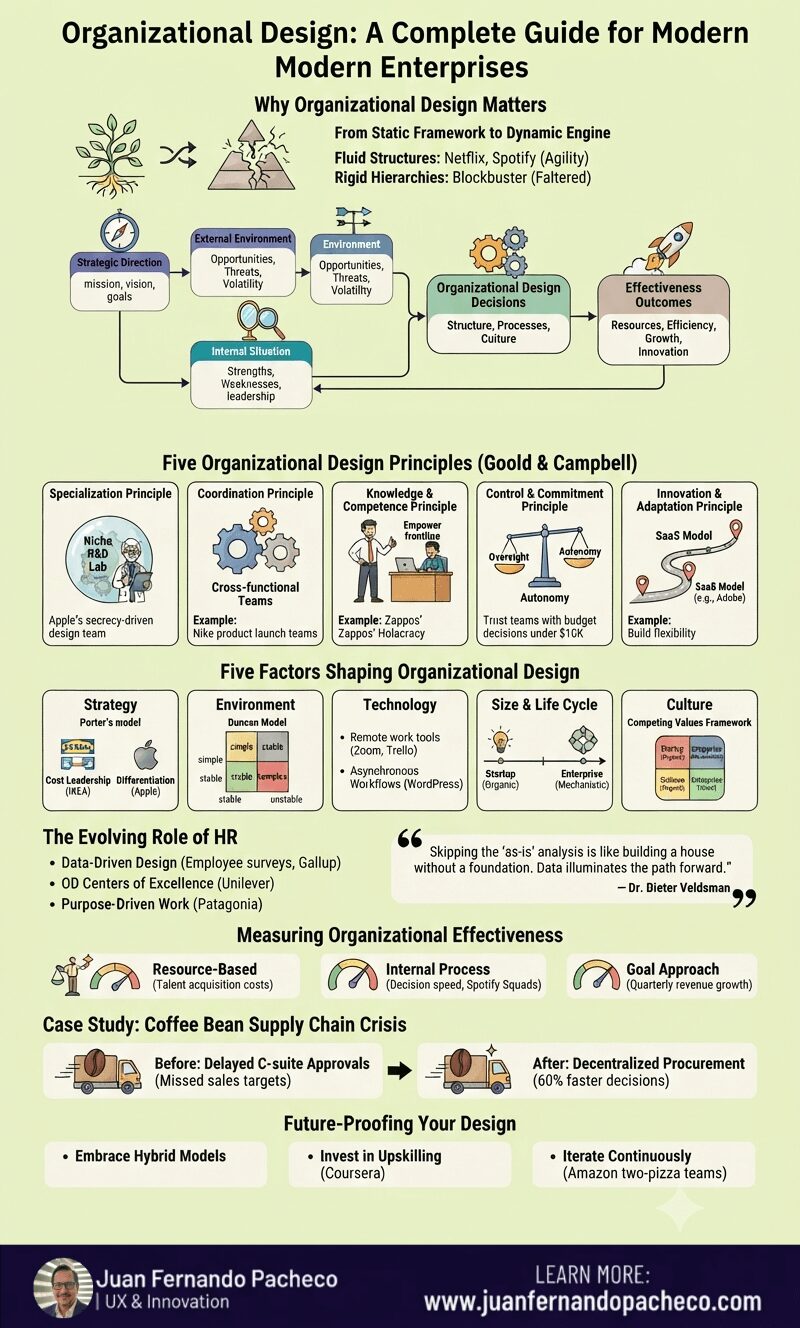
Organizational design isn’t a one-time project—it’s a journey. By aligning strategy, culture, and structure, businesses can navigate disruption, attract top talent, and outperform competitors. Start small: Audit your current design, involve cross-functional stakeholders, and prioritize flexibility. As the Greek philosopher Heraclitus said, “Change is the only constant.” Design for it.
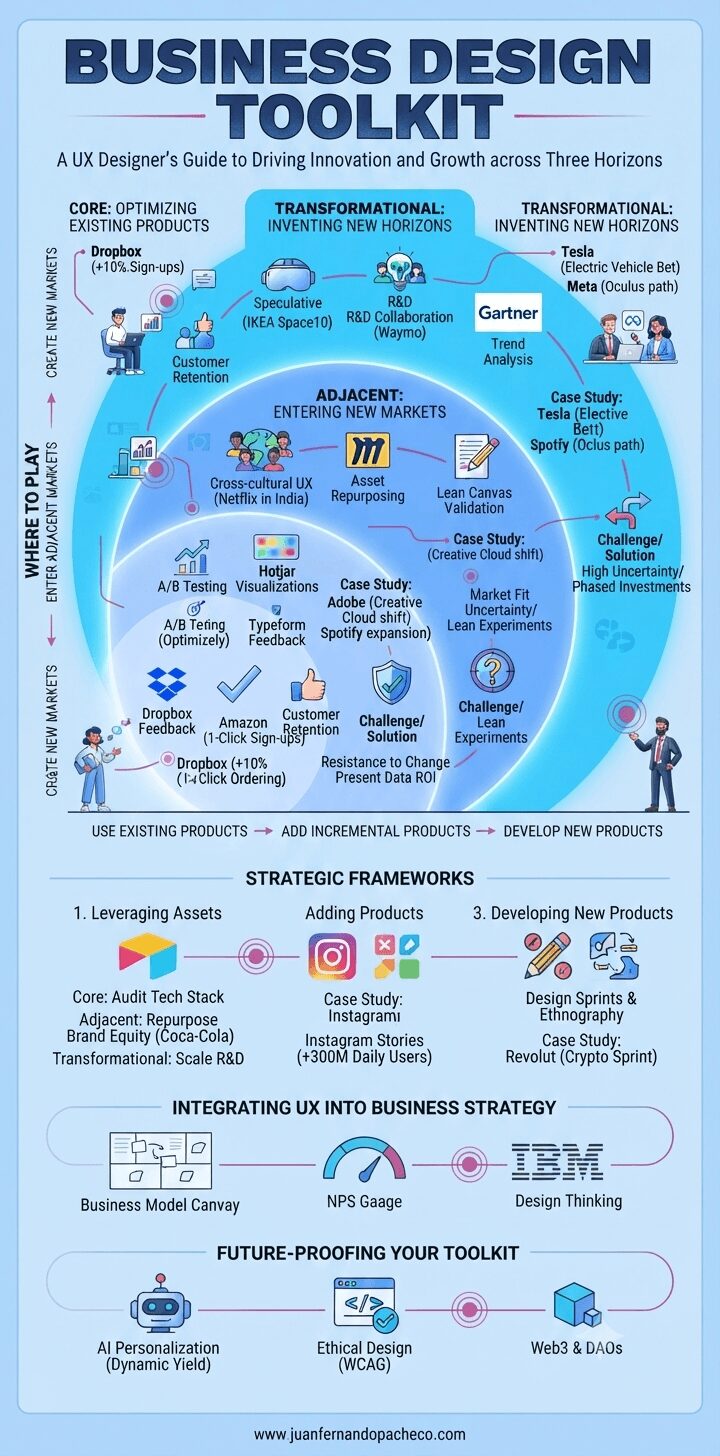
A business design toolkit is not static—it evolves with market shifts and technological advancements. By mastering Core optimization, Adjacent expansion, and Transformational disruption, UX designers can become strategic partners in driving sustainable growth.
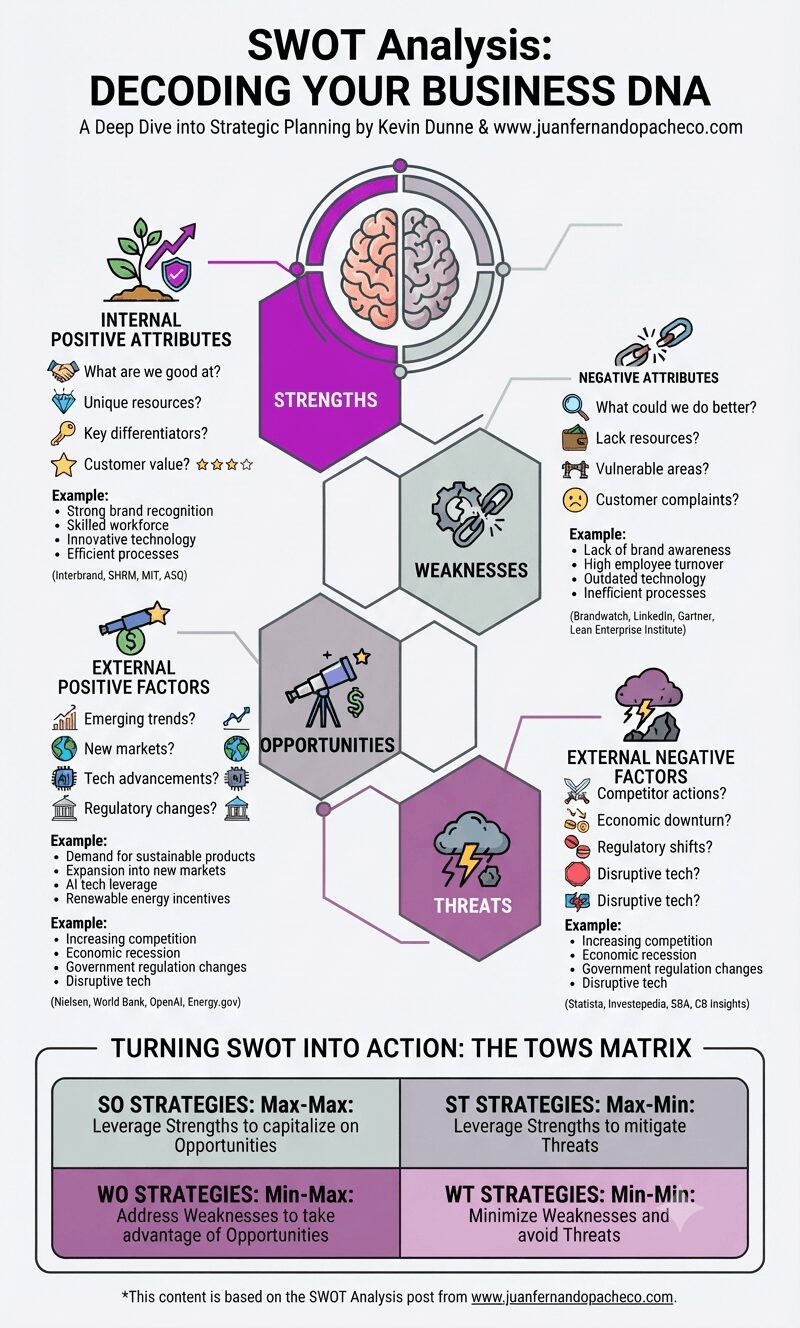
A SWOT analysis is a powerful tool for understanding your organization’s current position and charting a course for future success. By systematically analyzing your strengths, weaknesses, opportunities, and threats, you can develop targeted strategies that leverage your competitive advantages and mitigate potential risks.