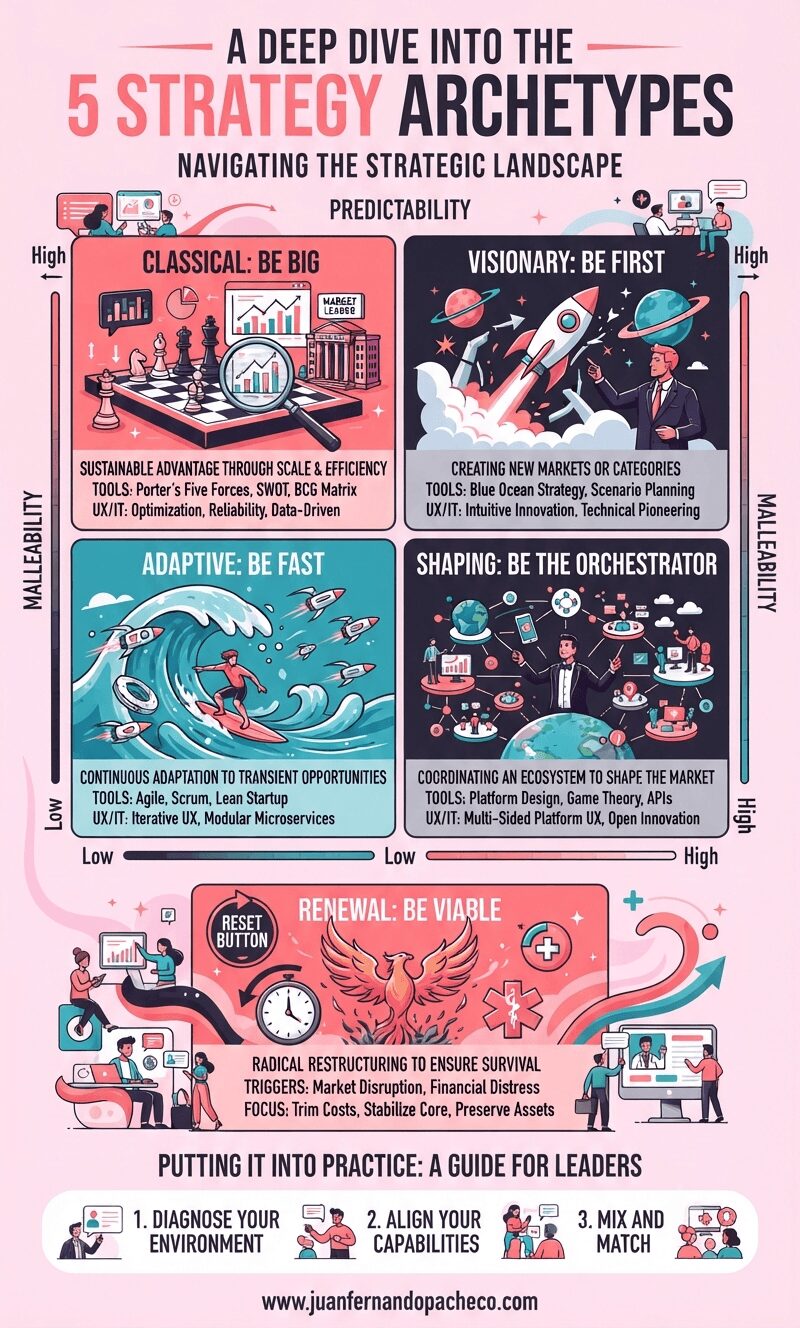
An infographic titled "A Deep Dive into the 5 Strategy Archetypes" visualizing five strategic approaches—Classical, Visionary, Adaptive, Shaping, and Renewal—mapped against the axes of Predictability and Malleability. The graphic uses a pink and blue color scheme with illustrations like a chessboard, a rocket ship, a surfer, a conductor, and a phoenix.

The greatest risk in strategy is complacency—the unconscious application of a default approach. The framework of the five archetypes empowers us to move from a reactive stance to a proactive one. It provides a language to debate not just what we are doing, but why we are doing it and how it matches the world we operate in.

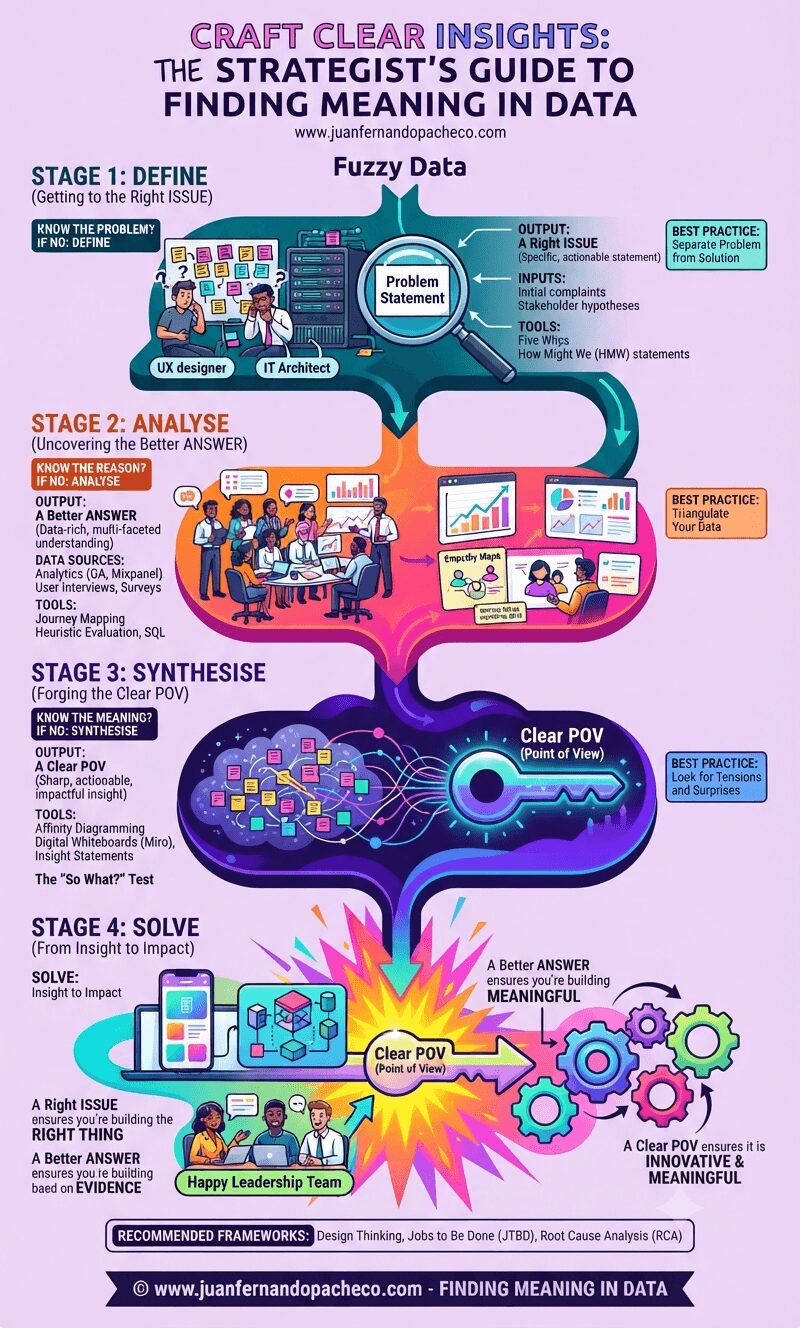
An infographic titled "CRAFT CLEAR INSIGHTS: THE STRATEGIST’S GUIDE TO FINDING MEANING IN DATA" presenting a four-stage framework for problem-solving. The flow moves from "Fuzzy Data" at the top through "Stage 1: Define," "Stage 2: Analyse," and "Stage 3: Synthesise" to "Stage 4: Solve" and "Impact" at the bottom. Visual elements include teams of UX designers and IT architects, data charts, affinity diagrams, a magnifying glass, a glowing key representing "Clear POV," and interlocking gears. The website "www.juanfernandopacheco.com" is featured throughout.

In a world saturated with data, the ability to craft clear insights is a superpower. It is the bridge between raw information and human understanding, between execution and strategy. It is what separates a feature factory from a truly impactful product team.

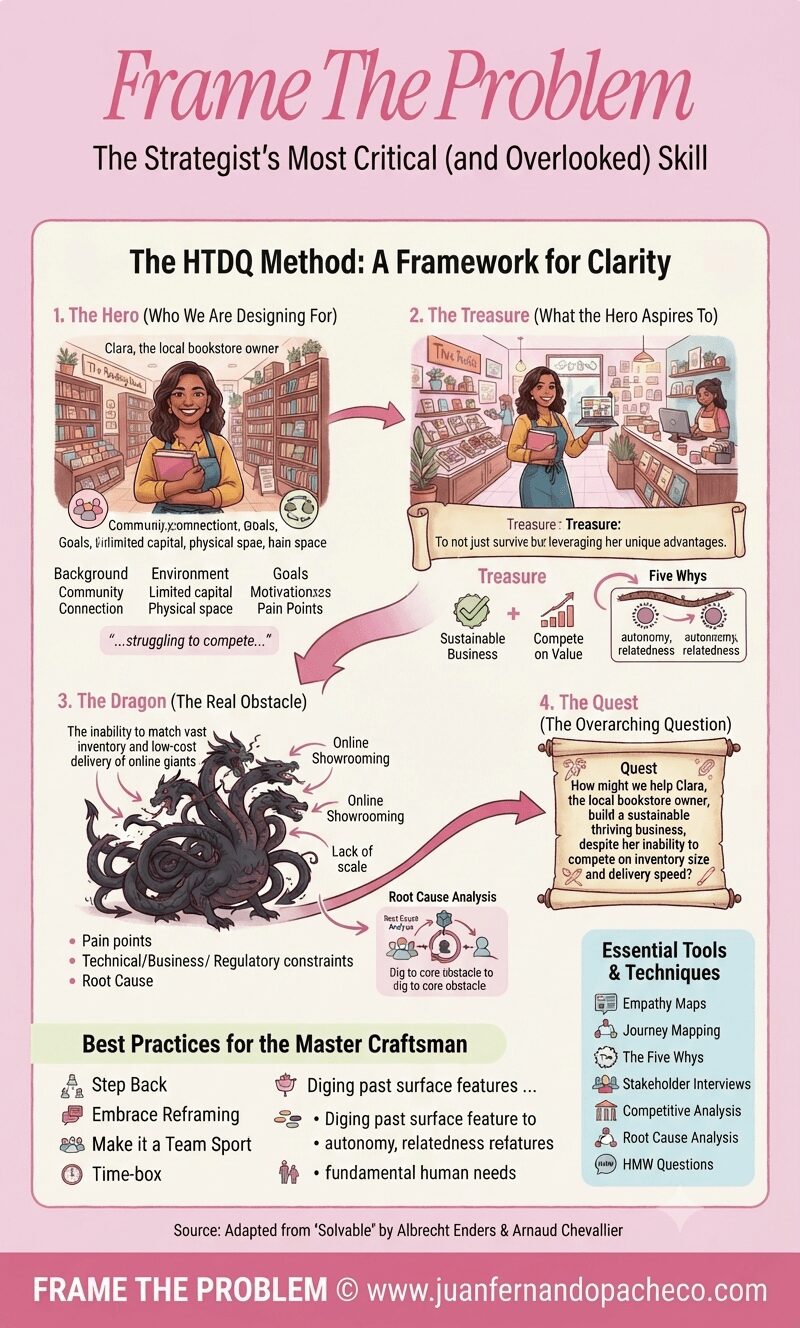
An infographic titled "Frame The Problem" illustrating the HTDQ storytelling method for strategic clarity. It uses the example of Clara, a local bookstore owner (Hero), who needs a sustainable business (Treasure) despite competition from online giants (Dragon), leading to the Quest question: "How might we help Clara...build a sustainable thriving business, despite her inability to compete on inventory size and delivery speed?" The infographic includes sections for best practices and essential tools, with attribution to www.juanfernandopacheco.com.

Framing the problem is the highest-leverage activity in any strategic endeavor. It is the art of asking the right question before desperately searching for answers. The HTDQ method provides a memorable, robust, and human-centered framework to master this art.

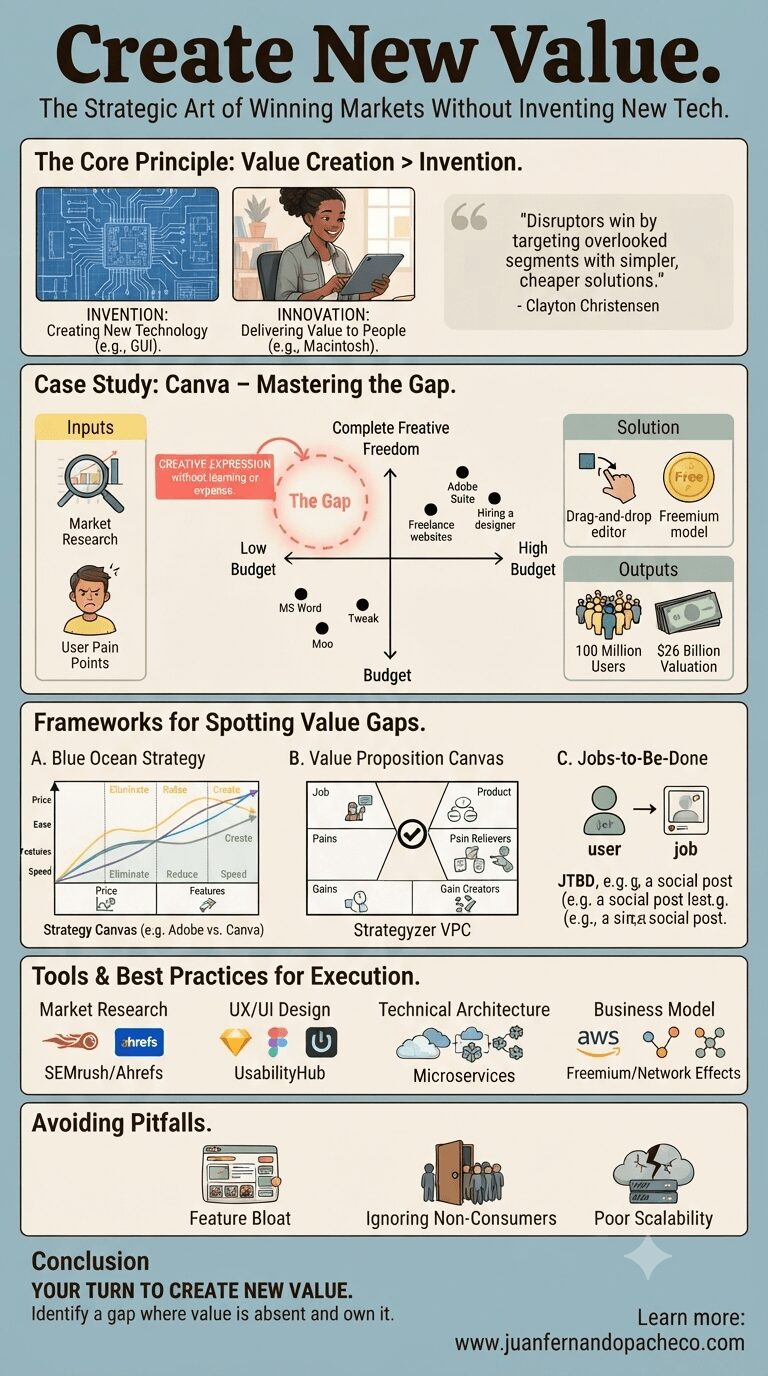
A comprehensive business infographic titled "Create New Value. The Strategic Art of Winning Markets Without Inventing New Tech." The image is divided into stacked sections: "The Core Principle: Value Creation > Invention," a detailed "Case Study: Canva – Mastering the Gap" (including a 2x2 positioning map, inputs, outputs, and UX insights), "Frameworks for Spotting Value Gaps" (Blue Ocean Strategy, Value Proposition Canvas, Jobs-to-Be-Done), "Tools & Best Practices for Execution" (Market Research, UX/UI Design, Technical Architecture, Business Model), and "Avoiding Pitfalls" (Feature Bloat, Ignoring Non-Consumers, Poor Scalability). The infographic uses diagrams, charts, and icons, concluding with a call to action and the URL "www.juanfernandopacheco.com."

Visionaries spot gaps in the market—unmet needs others overlook—and craft solutions so elegantly aligned with those gaps that they carve out entirely new categories.

Let’s dissect this with surgical precision, using real-world examples, battle-tested frameworks, and actionable tools. By the end, you’ll see how to identify and own your “white space” in any market.

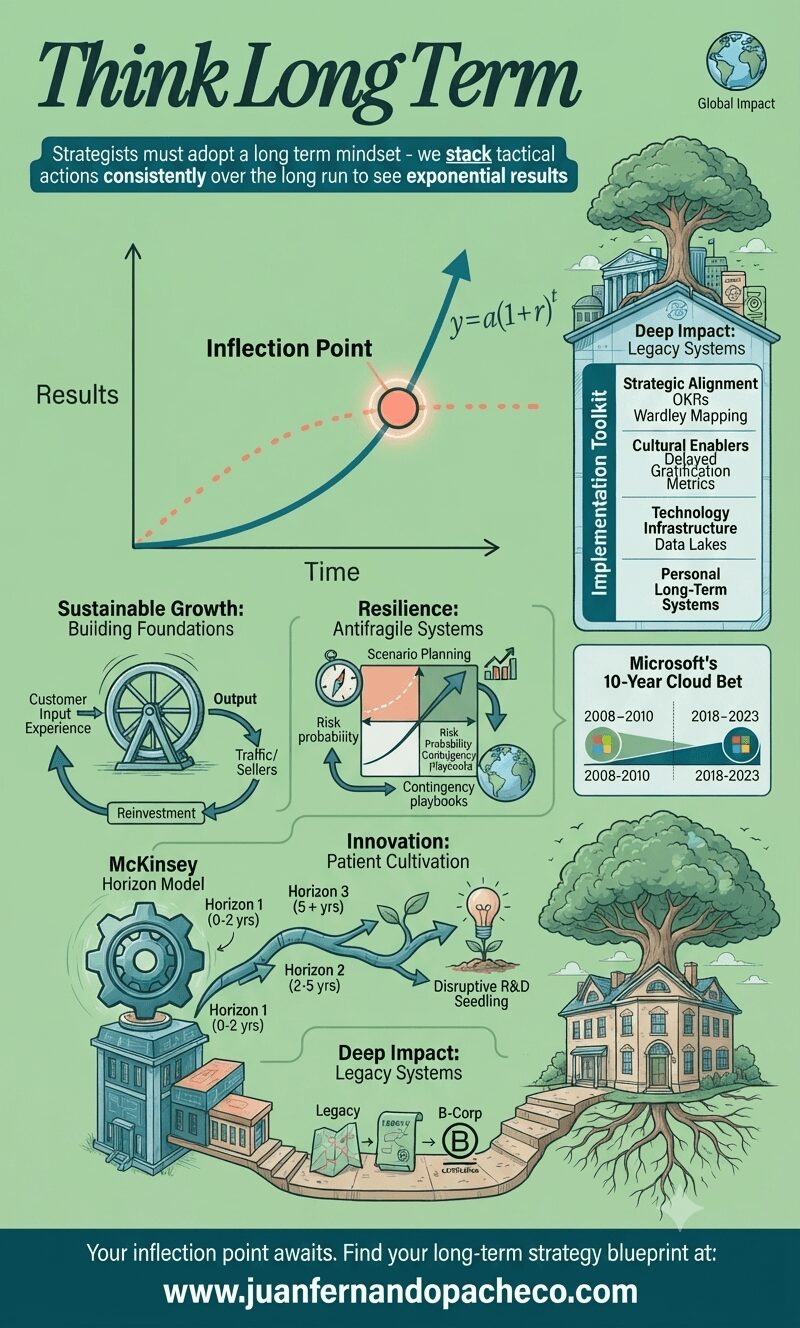
An intricate infographic titled 'Think Long Term,' illustrating a strategic blueprint for exponential growth based on the provided post. The central element is a graph showing an exponential teal curve labeled 'Long Term' overtaking a plateauing coral dotted line ('Short Term') at a glowing 'Inflection Point' (y=a(1+r)t). Below the graph, the strategy is broken into four detailed pillars: Sustainable Growth: Building Foundations, with a flywheel model (Customer Input → Output → Reinvestment). Resilience: Antifragile Systems, featuring a scenario planning matrix and contingency playbooks. Innovation: Patient Cultivation, depicted as a branching path (Horizon Model) leading to a 'Disruptive R&D Seedling.' Deep Impact: Legacy Systems, shown as a pathway from an initial structure to a mature B-Corp house with deep roots. A sidebar lists an 'Implementation Toolkit' (OKRs, Wardley Mapping, Data Lakes). A case study highlights 'Microsoft's 10-Year Cloud Bet.' The infographic ends with the footer text: 'Your inflection point awaits. Find your long-term strategy blueprint at: www.juanfernandopacheco.com.' The overall color scheme is a blend of soft green (#9ece9a), teal, and warm coral.

In the 1980s, IBM dominated mainframe computers while Microsoft focused on the embryonic PC market—a classic long-term gamble. Bill Gates famously said, 

“We always overestimate the change that will occur in two years and underestimate the change that will occur in ten.” 

This encapsulates the power of long-term thinking: the deliberate prioritization of future exponential gains over immediate rewards.