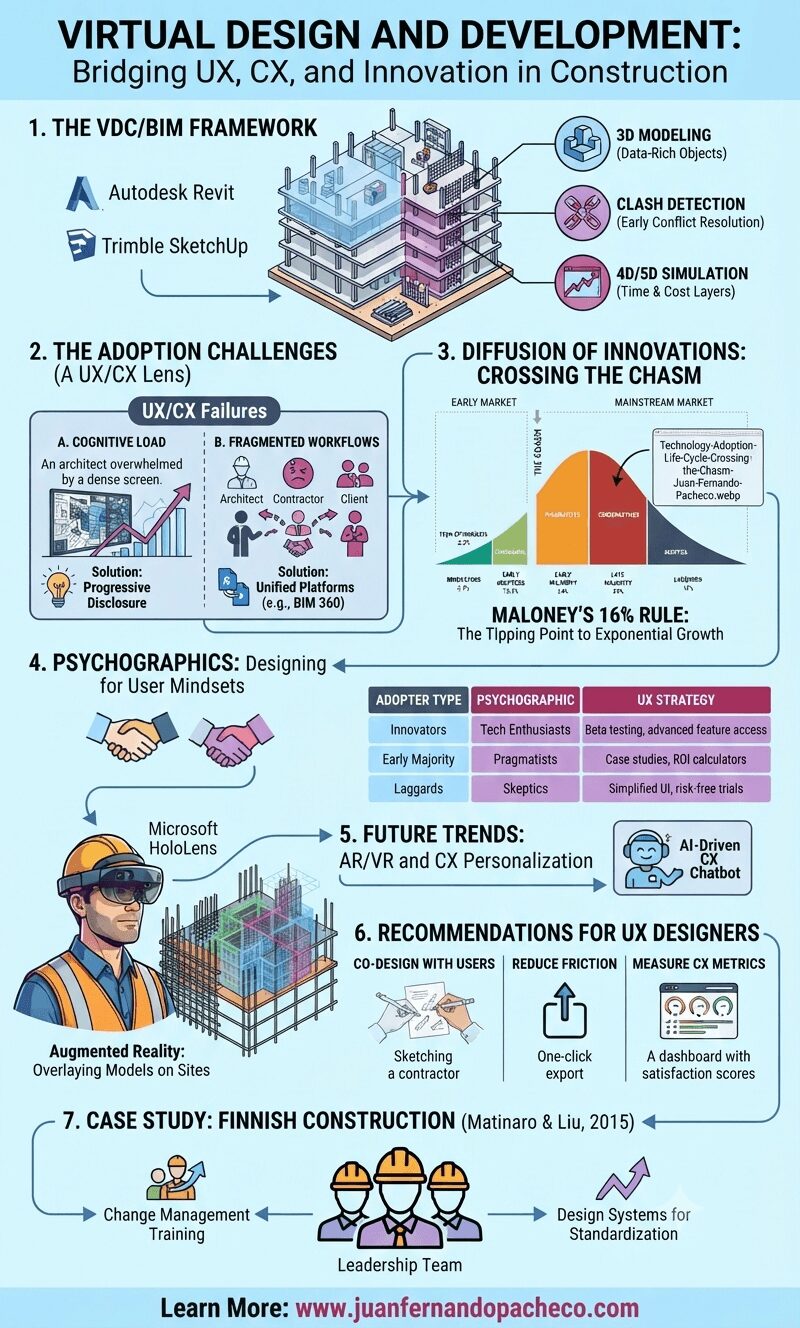
A comprehensive infographic titled 'VIRTUAL DESIGN AND DEVELOPMENT: Bridging UX, CX, and Innovation in Construction' that uses charts, diagrams, and illustrations to explain the role of User Experience (UX) and Customer Experience (CX) in the adoption of Virtual Design and Construction (VDC) and Building Information Modeling (BIM). The vertical graphic is structured in seven numbered sections: 1. The VDC/BIM Framework, 2. The Adoption Challenges (A UX/CX Lens), 3. Diffusion of Innovations: Crossing the Chasm, 4. Psychographics: Designing for User Mindsets, 5. Future Trends: AR/VR and CX Personalization, 6. Recommendations for UX Designers, and 7. Case Study: Finnish Construction (Matinaro & Liu, 2015). The infographic includes specific data from image_0.png, logos for software like Autodesk Revit and BIM 360, and concludes with a call to action to learn more at www.juanfernandopacheco.com.

VDC/BIM’s potential is undeniable, but its success hinges on human-centered design. By applying UX/CX principles—from progressive disclosure to psychographic segmentation—we can accelerate innovation diffusion and transform the construction industry.

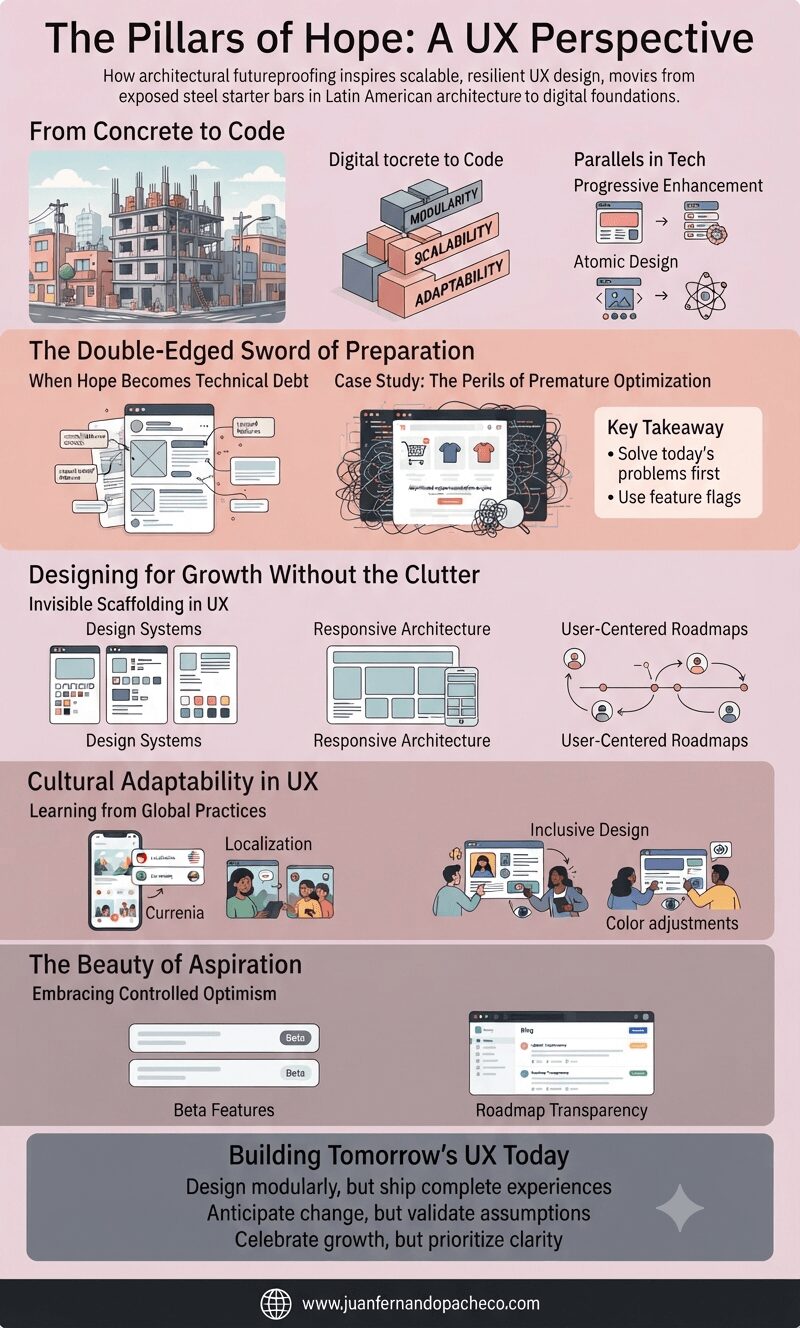
An infographic titled "The Pillars of Hope: A UX Perspective" visually explains how architectural futureproofing inspires scalable, resilient UX design, moving from exposed steel starter bars in Latin American architecture to digital foundations. The graphic is organized into five main parts: "From Concrete to Code" (showing modularity), "The Double-Edged Sword of Preparation" (addressing technical debt), "Designing for Growth Without the Clutter" (focusing on invisible scaffolding), "Cultural Adaptability in UX" (highlighting global practices), and "The Beauty of Aspiration" (emphasizing controlled optimism). The bottom footer includes the URL www.juanfernandopacheco.com.

The first time I saw steel starter bars jutting out from rooftops in Latin America, I was baffled. These exposed rods, nicknamed “Pillars of Hope,” seemed like chaotic afterthoughts. But their purpose—preparing buildings for future expansion—reveals a profound lesson for UX designers
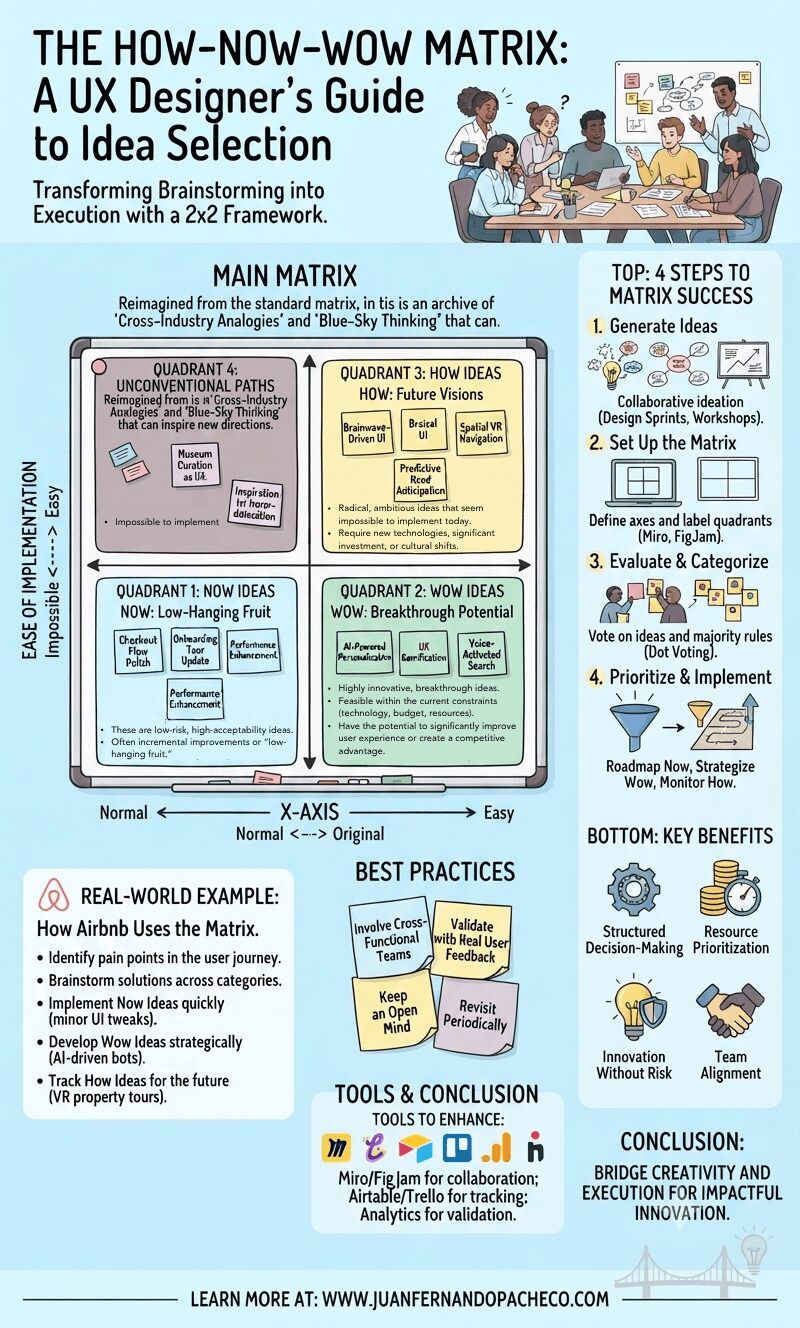
A creative infographic of the How-Now-Wow Matrix, visualized as a whiteboard with color-coded quadrants (Blue-Now, Green-Wow, Yellow-How) populated by sticky notes and hand-drawn examples. It includes a step-by-step guide for UX idea prioritization and benefits.

The How-Now-Wow Matrix is an invaluable tool in the UX designer’s toolkit. It bridges the gap between creativity and execution, ensuring that the best ideas move forward in a structured, strategic manner. Whether you’re optimizing an existing product or envisioning the future of user experience, integrating this framework will enhance your decision-making process and lead to impactful innovation.
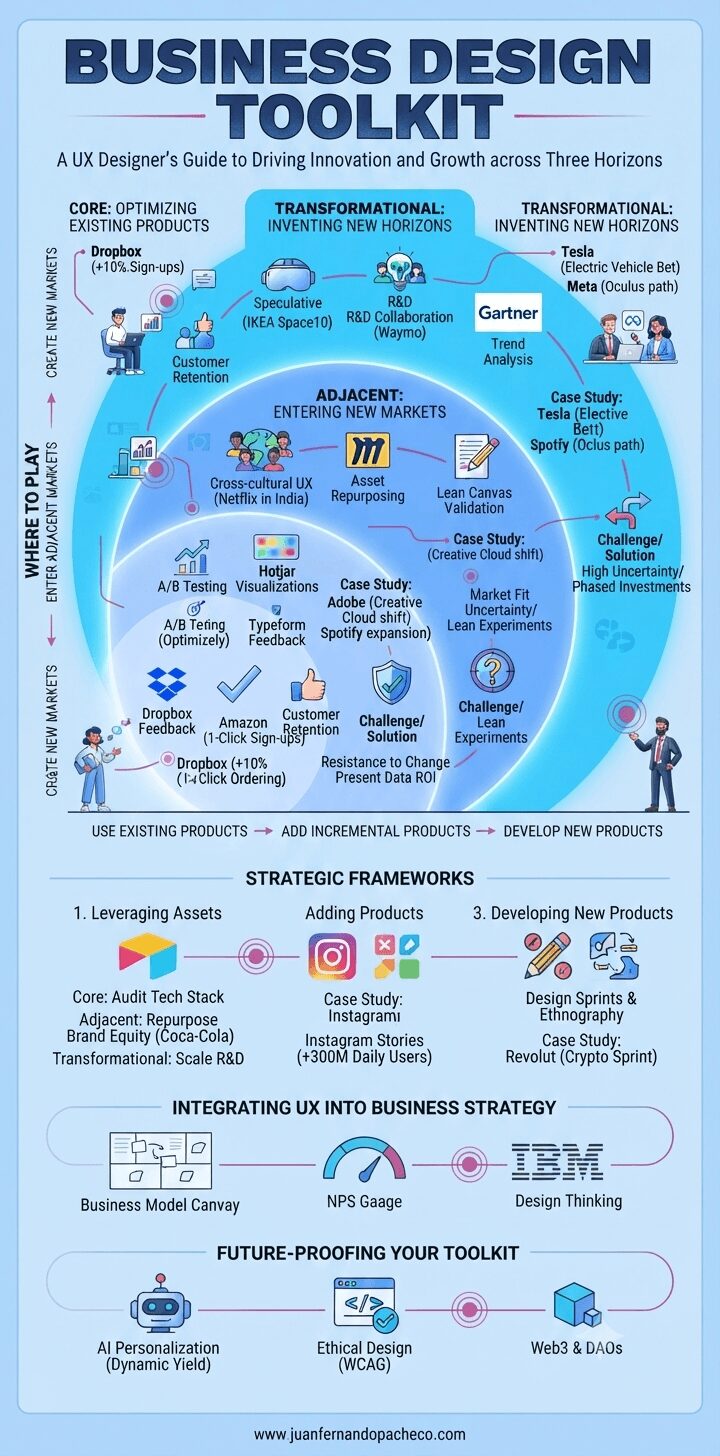
An infographic titled "Business Design Toolkit" on a light blue background, illustrating the Three Horizons framework for innovation (Core, Adjacent, Transformational), strategic frameworks, and tactics for integrating UX into business strategy. The design includes icons, flowcharts, and labels connecting UX design methods to business growth outcomes, with a footer reference to www.juanfernandopacheco.com.

A business design toolkit is not static—it evolves with market shifts and technological advancements. By mastering Core optimization, Adjacent expansion, and Transformational disruption, UX designers can become strategic partners in driving sustainable growth.
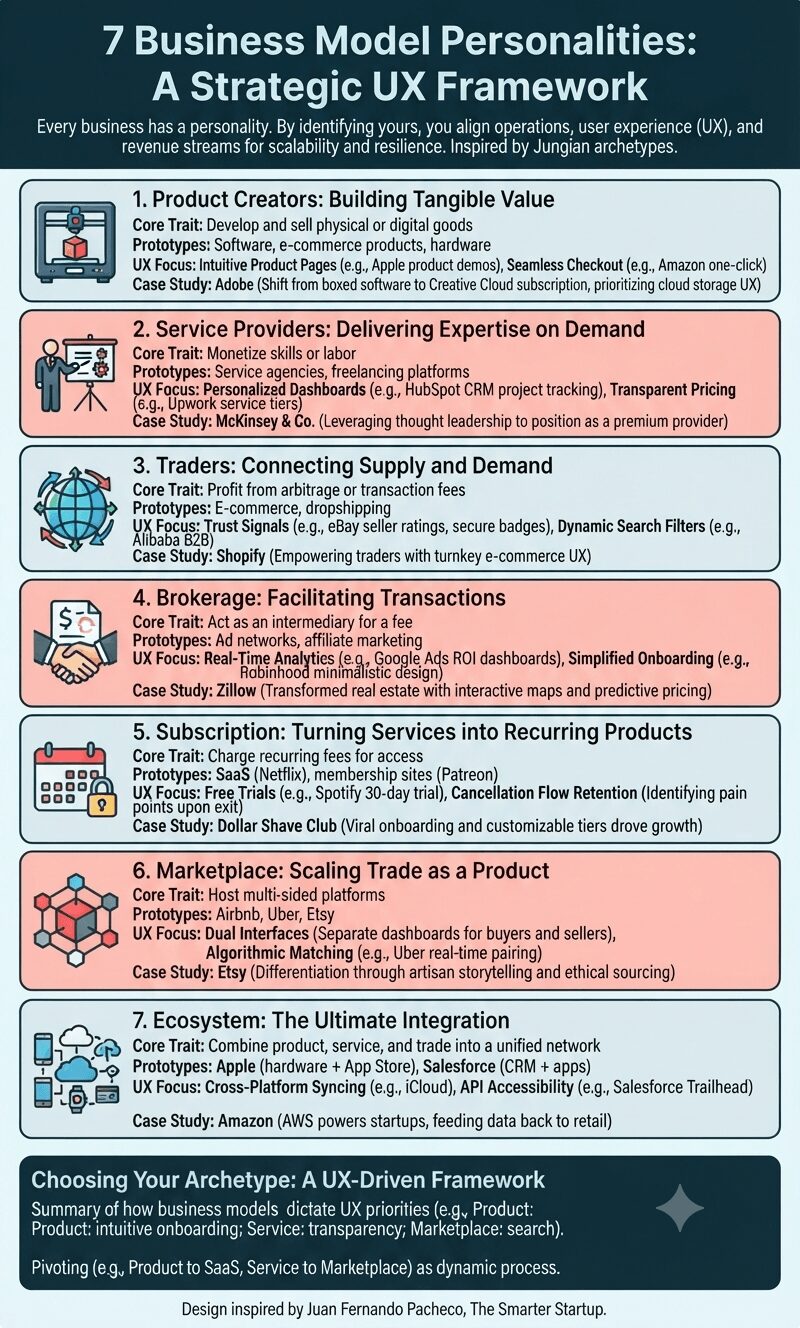
"Infographic titled '7 Business Model Personalities: A Strategic UX Framework' on a light background, detailing seven archetypes—Product Creators, Service Providers, Traders, Brokerage, Subscription, Marketplace, and Ecosystem—each with an icon, core traits, prototypes, UX focus, and a real-world case study."

Every business operates like a machine—input resources, process value, and output profits. But without a clear “instruction manual,” even brilliant ideas risk failure.

Inspired by Carl Jung’s personality archetypes, the 7 Business Model Personalities framework offers a strategic lens to align your operations, user experience (UX), and revenue streams.
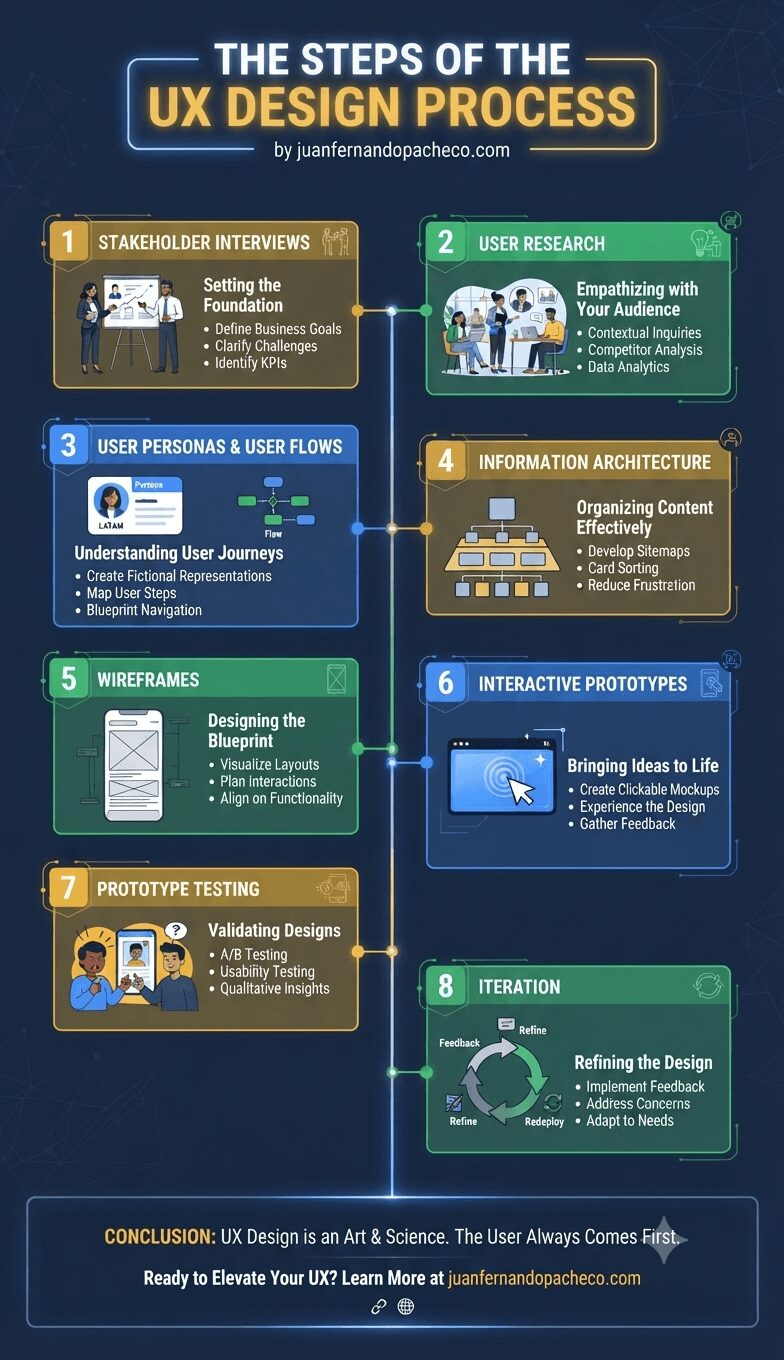
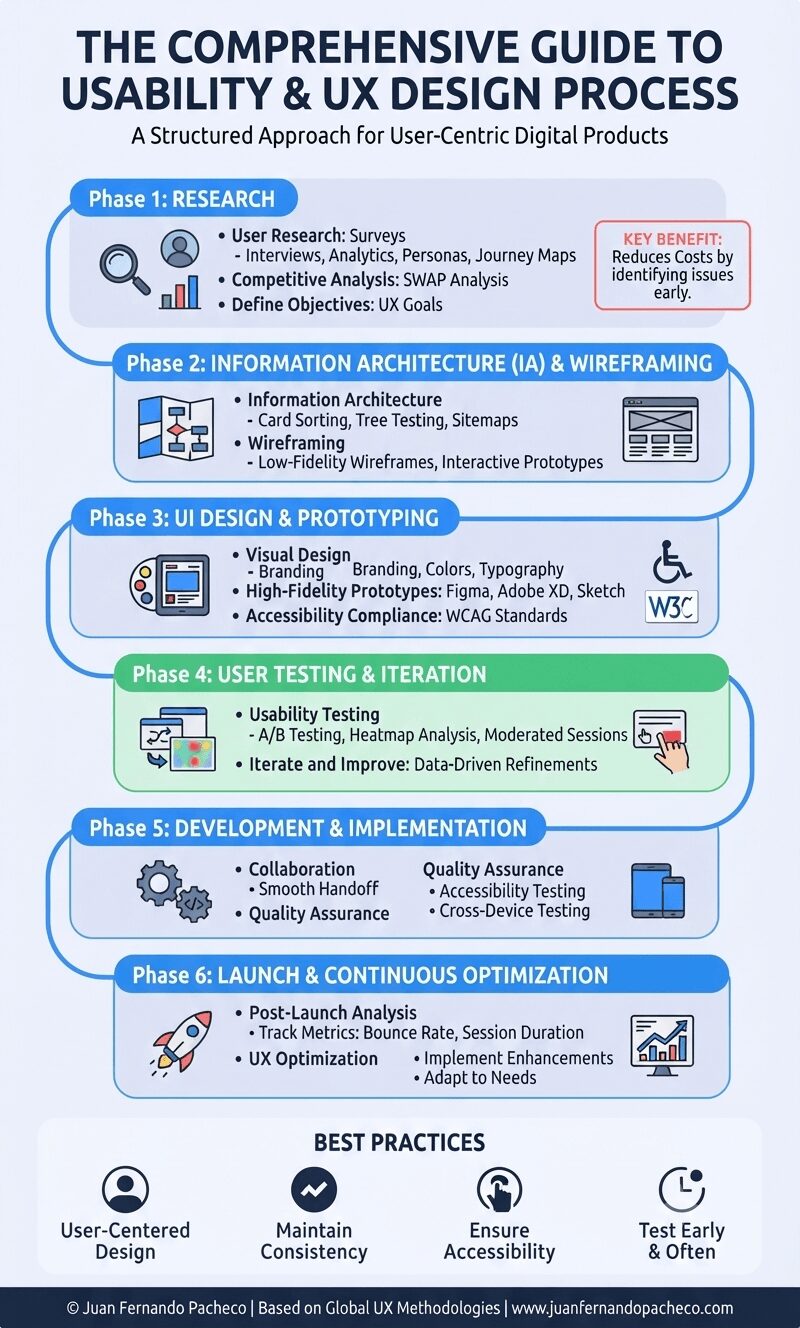
Infographic titled "The Steps of the UX Design Process by juanfernandopacheco.com" presented in a vertical, connected layout against a dark blue background. Eight numbered steps are detailed sequentially: 1. Stakeholder Interviews, 2. User Research, 3. User Personas & User Flows, 4. Information Architecture, 5. Wireframes, 6. Interactive Prototypes, 7. Prototype Testing, and 8. Iteration. Each step features a descriptive icon or illustration, a subtitle explaining the goal, and three specific bullet points outlining the activity. The infographic concludes with a summary banner emphasizing user-centered design and a call to action for the provided website.

The UX design process is both an art and a science. By following these steps, you’ll create products that resonate with users and achieve business goals. Whether you’re designing a simple app or a complex enterprise platform, remember: the user always comes first.
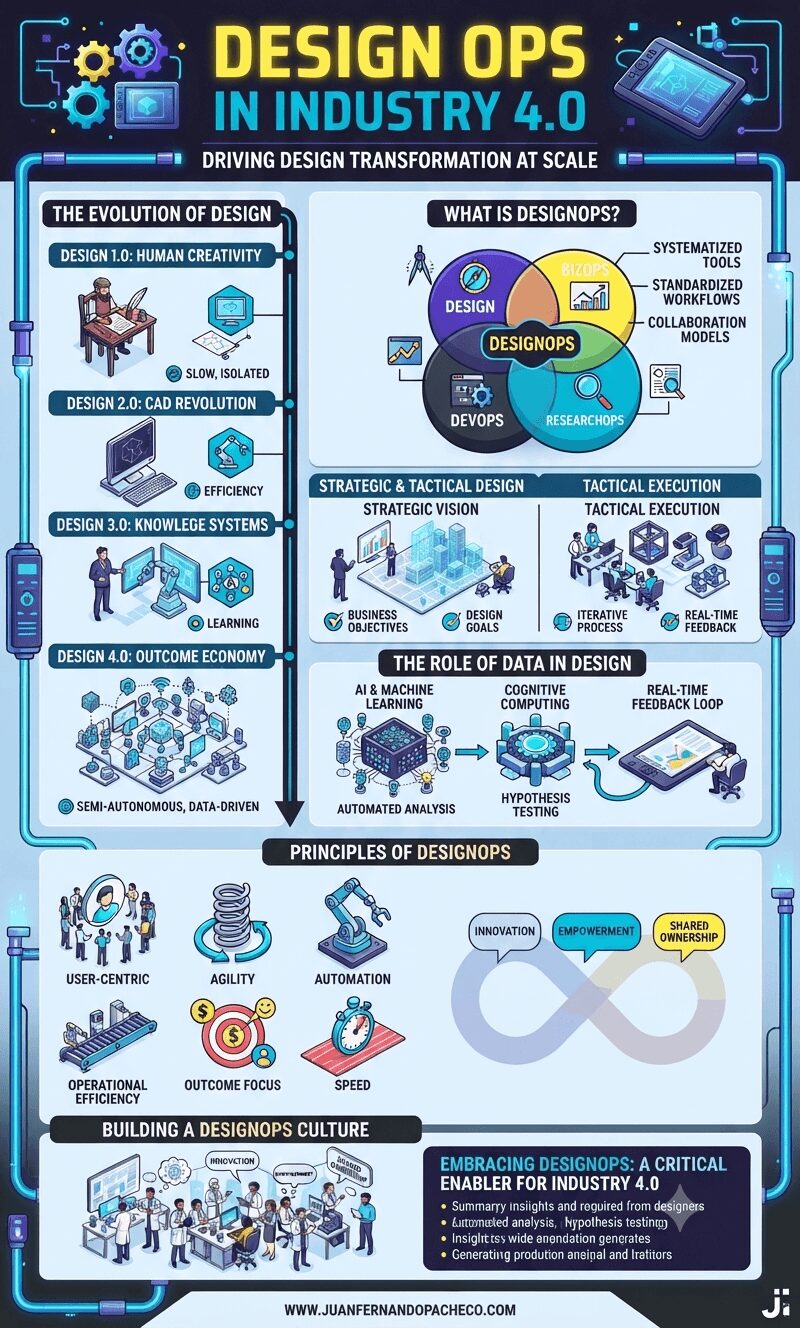
A comprehensive vertical infographic titled "Design Ops in Industry 4.0: Driving Design Transformation at Scale," with a new color palette of light blues, purples, teals, and yellow accents against a #edf5fc background. The infographic is structured in clear, stacked sections: "The Evolution of Design" (1.0 to 4.0), a central "What is DesignOps?" Venn diagram, "Strategic & Tactical Design," "The Role of Data in Design," "Principles of DesignOps" (User-Centric, Agility, Automation, Operational Efficiency, Outcome Focus, Speed), "Building a DesignOps Culture," and "Embracing DesignOps: A Critical Enabler for Industry 4.0." Small illustrations, icons, and connecting lines guide the eye. The bottom includes a reference to www.juanfernandopacheco.com.

As organizations navigate the complexities of Industry 4.0, DesignOps emerges as a critical enabler of success. By operationalizing design, fostering collaboration, and leveraging data, companies can deliver innovative solutions at scale.

Embracing DesignOps is not just about optimizing processes; it’s about transforming how businesses think, design, and deliver value in a rapidly changing world.
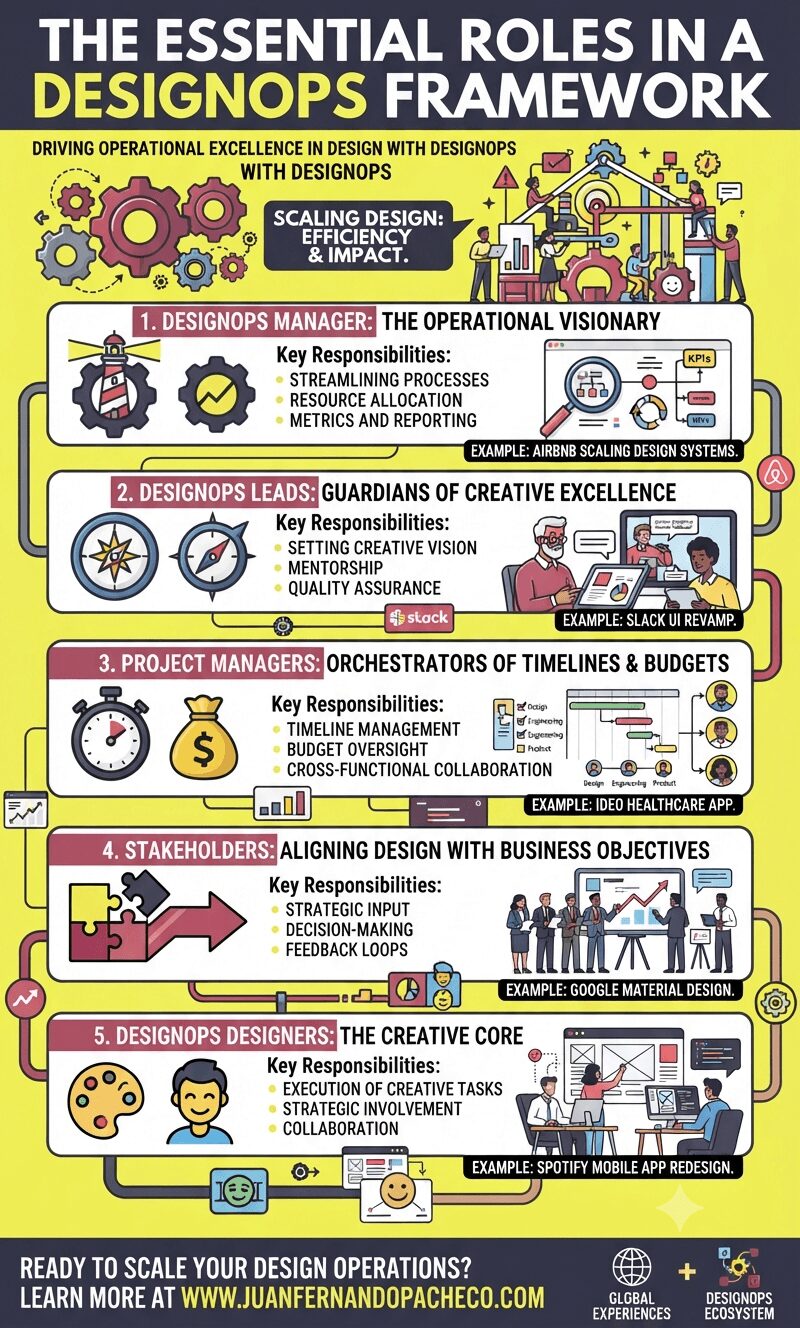
A vertical infographic titled "The Essential Roles in a DesignOps Framework" on a bright yellow background, detailing five key roles. From top to bottom: 1. DesignOps Manager (Lighthouse icon), responsible for processes, resources, metrics (with an Airbnb example). 2. DesignOps Leads (Compass icon), focused on vision, mentorship, quality assurance (with a Slack example). 3. Project Managers (Stopwatch icon), managing timelines, budgets, and collaboration (with an IDEO example). 4. Stakeholders (Puzzle piece icon), aligning design with business objectives (with a Google example). 5. DesignOps Designers (Palette icon), the creative core executing tasks and collaborating (with a Spotify example). The bottom features a call to action for www.juanfernandopacheco.com.

The rapid pace of digital transformation has propelled organizations to place greater emphasis on design as a strategic lever for innovation and customer satisfaction.

Yet, scaling design efforts across teams, tools, and workflows remains a formidable challenge. This is where DesignOps (Design Operations) emerges as a critical discipline, providing the scaffolding for designers to focus on what they do best: creating impactful experiences.