Comprehensive Guide for UX Professionals
Crafting Exceptional Experiences Through Strategic Visualization
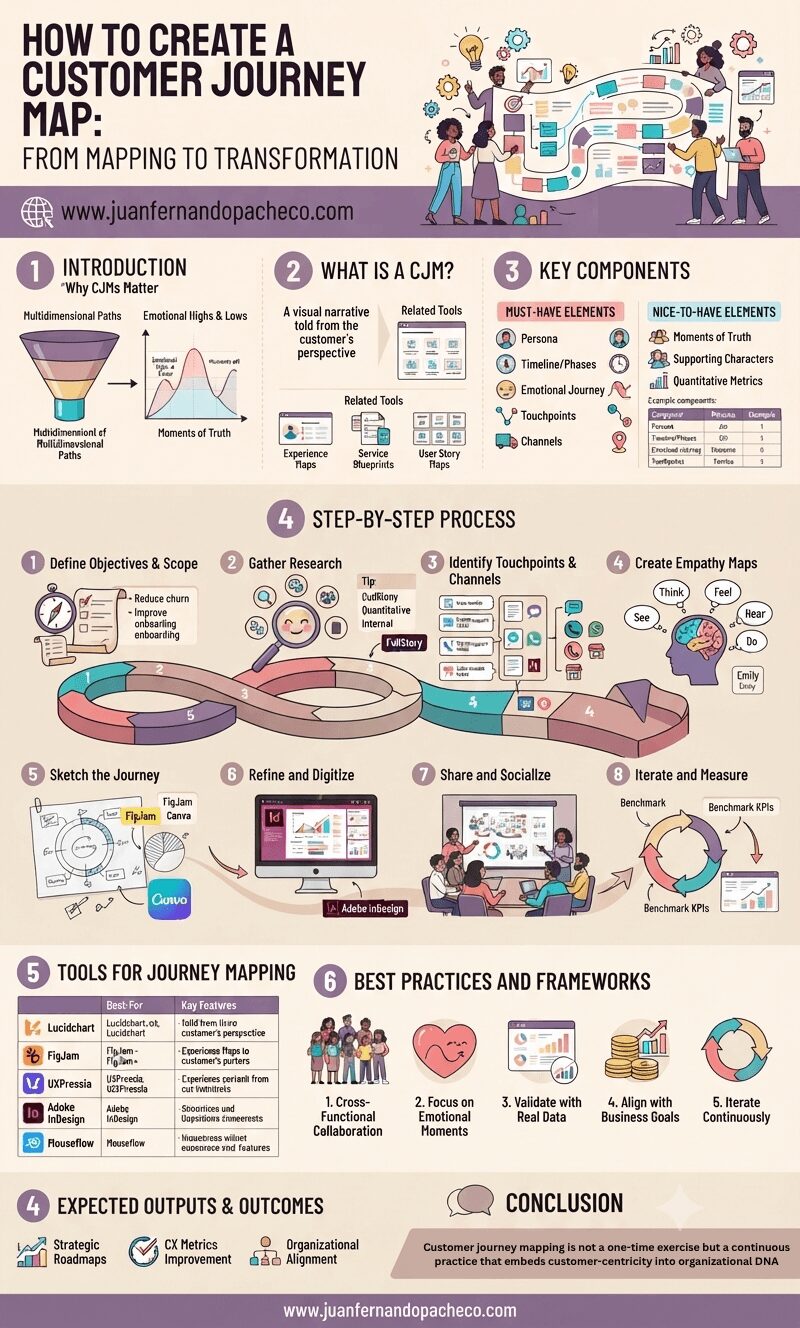
Introduction: Why Customer Journey Maps Matter
In an era when customer experience (CX) quality has hit an all-time low, organizations must prioritize understanding and optimizing every touchpoint.
A customer journey map (CJM) is a powerful tool that visualizes the end-to-end experience of a customer interacting with your organization, product, or service.
Unlike linear funnel diagrams, CJMs capture the multidimensional, often non-linear paths customers take—from awareness to advocacy—while highlighting emotional highs and lows, pain points, and moments of truth.
For UX designers and architects, CJMs bridge the gap between business goals and user needs, fostering cross-departmental alignment and ensuring customer-centric decision-making. Research shows that 79% of companies investing in CJMs become more customer-centric, directly impacting retention, revenue, and loyalty.
What Is a Customer Journey Map?
A customer journey map is a visual narrative of a customer’s relationship with a brand, told from their perspective. It synthesizes qualitative and quantitative data into a cohesive story, emphasizing:
Emotional landscapes: Peaks of satisfaction and valleys of frustration.
Touchpoints and channels: Interactions (e.g., website visits, support calls) and their contexts (e.g., mobile app, in-store).
Key phases: Awareness, consideration, decision, retention, and advocacy.
CJMs differ from related tools:
Experience maps explore broad human behaviors (e.g., “how people travel”) unrelated to specific brands.
Service blueprints focus on backend processes supporting customer interactions.
User story maps plan Agile functionalities rather than holistic experiences.
Key Components of a Customer Journey Map
Must-Have Elements
Persona: A detailed profile of the target customer, including demographics, goals, and pain points.
Timeline/Phases: Chronological stages (e.g., pre-purchase, usage, renewal) or variable phases (e.g., awareness to advocacy).
Emotional Journey: A graph plotting emotional states (e.g., frustration, delight) across phases.
Touchpoints: Specific interactions (e.g., “submit support ticket”).
Channels: Locations where interactions occur (e.g., website, physical store).
Nice-to-Have Elements
Moments of Truth: Critical interactions that define perception (e.g., first use onboarding).
Supporting Characters: Influencers like friends or customer support agents.
Quantitative Metrics: Drop-off rates, CSAT scores, or time spent per phase .
Example Component Structure:
| Phase | Touchpoint | Channel | Emotion | Pain Point |
|---|---|---|---|---|
| Consideration | Read reviews | Mobile app | Curious | Limited pricing info |
| Decision | Contact sales | Anxious | Slow response |
Step-by-Step Process for Creating a CJM
1. Define Objectives and Scope
Goal: Align CJM focus with business outcomes (e.g., reduce churn, improve onboarding).
Questions to Answer:
Whose journey are we mapping? (e.g., first-time buyers).
What scenario does it cover? (e.g., purchasing a subscription).
Output: A project charter endorsed by stakeholders.
2. Gather Research
Combine data sources to inform the map:
Qualitative: Customer interviews, diary studies, usability tests.
Quantitative: Analytics, CSAT scores, CRM data.
Internal: Support logs, stakeholder interviews.
Tip: Use tools like FullStory for session replays or UXPressia for centralizing insights.
3. Identify Touchpoints and Channels
Brainstorm all current and potential interactions:
Touchpoint Examples: “View invoice,” “request refund.”
Channel Examples: Chatbot, call center, retail store.
Tools: Lucidchart for collaborative diagramming.
4. Create Empathy Maps
Develop personas by detailing:
What customers think, feel, see, hear, and do at critical junctures.
Example: A persona “Emily” feeling overwhelmed during checkout due to hidden fees.
5. Sketch the Journey
Plot phases, touchpoints, and emotions visually.
Innovate layouts: Circular timelines for cyclical journeys (e.g., subscription renewals) or helical maps for complex processes.
Tools: FigJam for real-time collaboration or Canva for templates.
6. Refine and Digitize
Polish sketches into shareable artifacts using design tools (e.g., Adobe InDesign ).
Embed data visualizations (e.g., emotion curves, analytics metrics).
7. Share and Socialize
Present CJMs to cross-functional teams to drive action.
Use CJMs in workshops to prioritize initiatives (e.g., fixing high-frustration touchpoints).
8. Iterate and Measure
Benchmark: Compare CJM predictions against KPIs (e.g., conversion rates).
Update: Revise maps quarterly based on new data.
Tools for Journey Mapping
| Tool | Best For | Key Features |
|---|---|---|
| Lucidchart | Collaboration & integrations | Real-time co-editing, data linking |
| FigJam | Real-time brainstorming | Sticky notes, drawing tools, mobile app |
| UXPressia | Centralized CX management | Persona libraries, analytics integrations |
| Adobe InDesign | High-fidelity design | Advanced graphics, interactive PDFs |
| Mouseflow | Identifying drop-offs | Heatmaps, path analysis |
Best Practices and Frameworks
1. Cross-Functional Collaboration
Involve marketing, sales, support, and IT in workshops to break silos .
2. Focus on Emotional Moments
Prioritize “moments that matter” (e.g., post-purchase support) where emotional load is highest .
3. Validate with Real Data
Use tools like FullStory to augment assumptions with behavioral analytics .
4. Align with Business Goals
Ensure CJMs link to ROI metrics (e.g., McKinsey notes CX improvements can lift revenue by 15% ).
5. Iterate Continuously
Treat CJMs as living documents updated with customer feedback.
Expected Outputs and Outcomes
Strategic Roadmaps: Prioritize initiatives based on pain points (e.g., simplifying checkout).
CX Metrics Improvement: Higher NPS, reduced churn, and increased retention.
Organizational Alignment: Shared understanding of customer needs across departments.
Conclusion: From Mapping to Transformation
Customer journey mapping is not a one-time exercise but a continuous practice that embeds customer-centricity into organizational DNA.
By visualizing the intersection of human emotions and business processes, UX professionals can drive transformative change—turning fragmented interactions into cohesive, respectful experiences that build long-term loyalty.
As CX expectations escalate, the brands that thrive will be those who listen, adapt, and design journeys that resonate deeply with the people they serve.
References and Further Reading
Image belongs to: Learning Loop