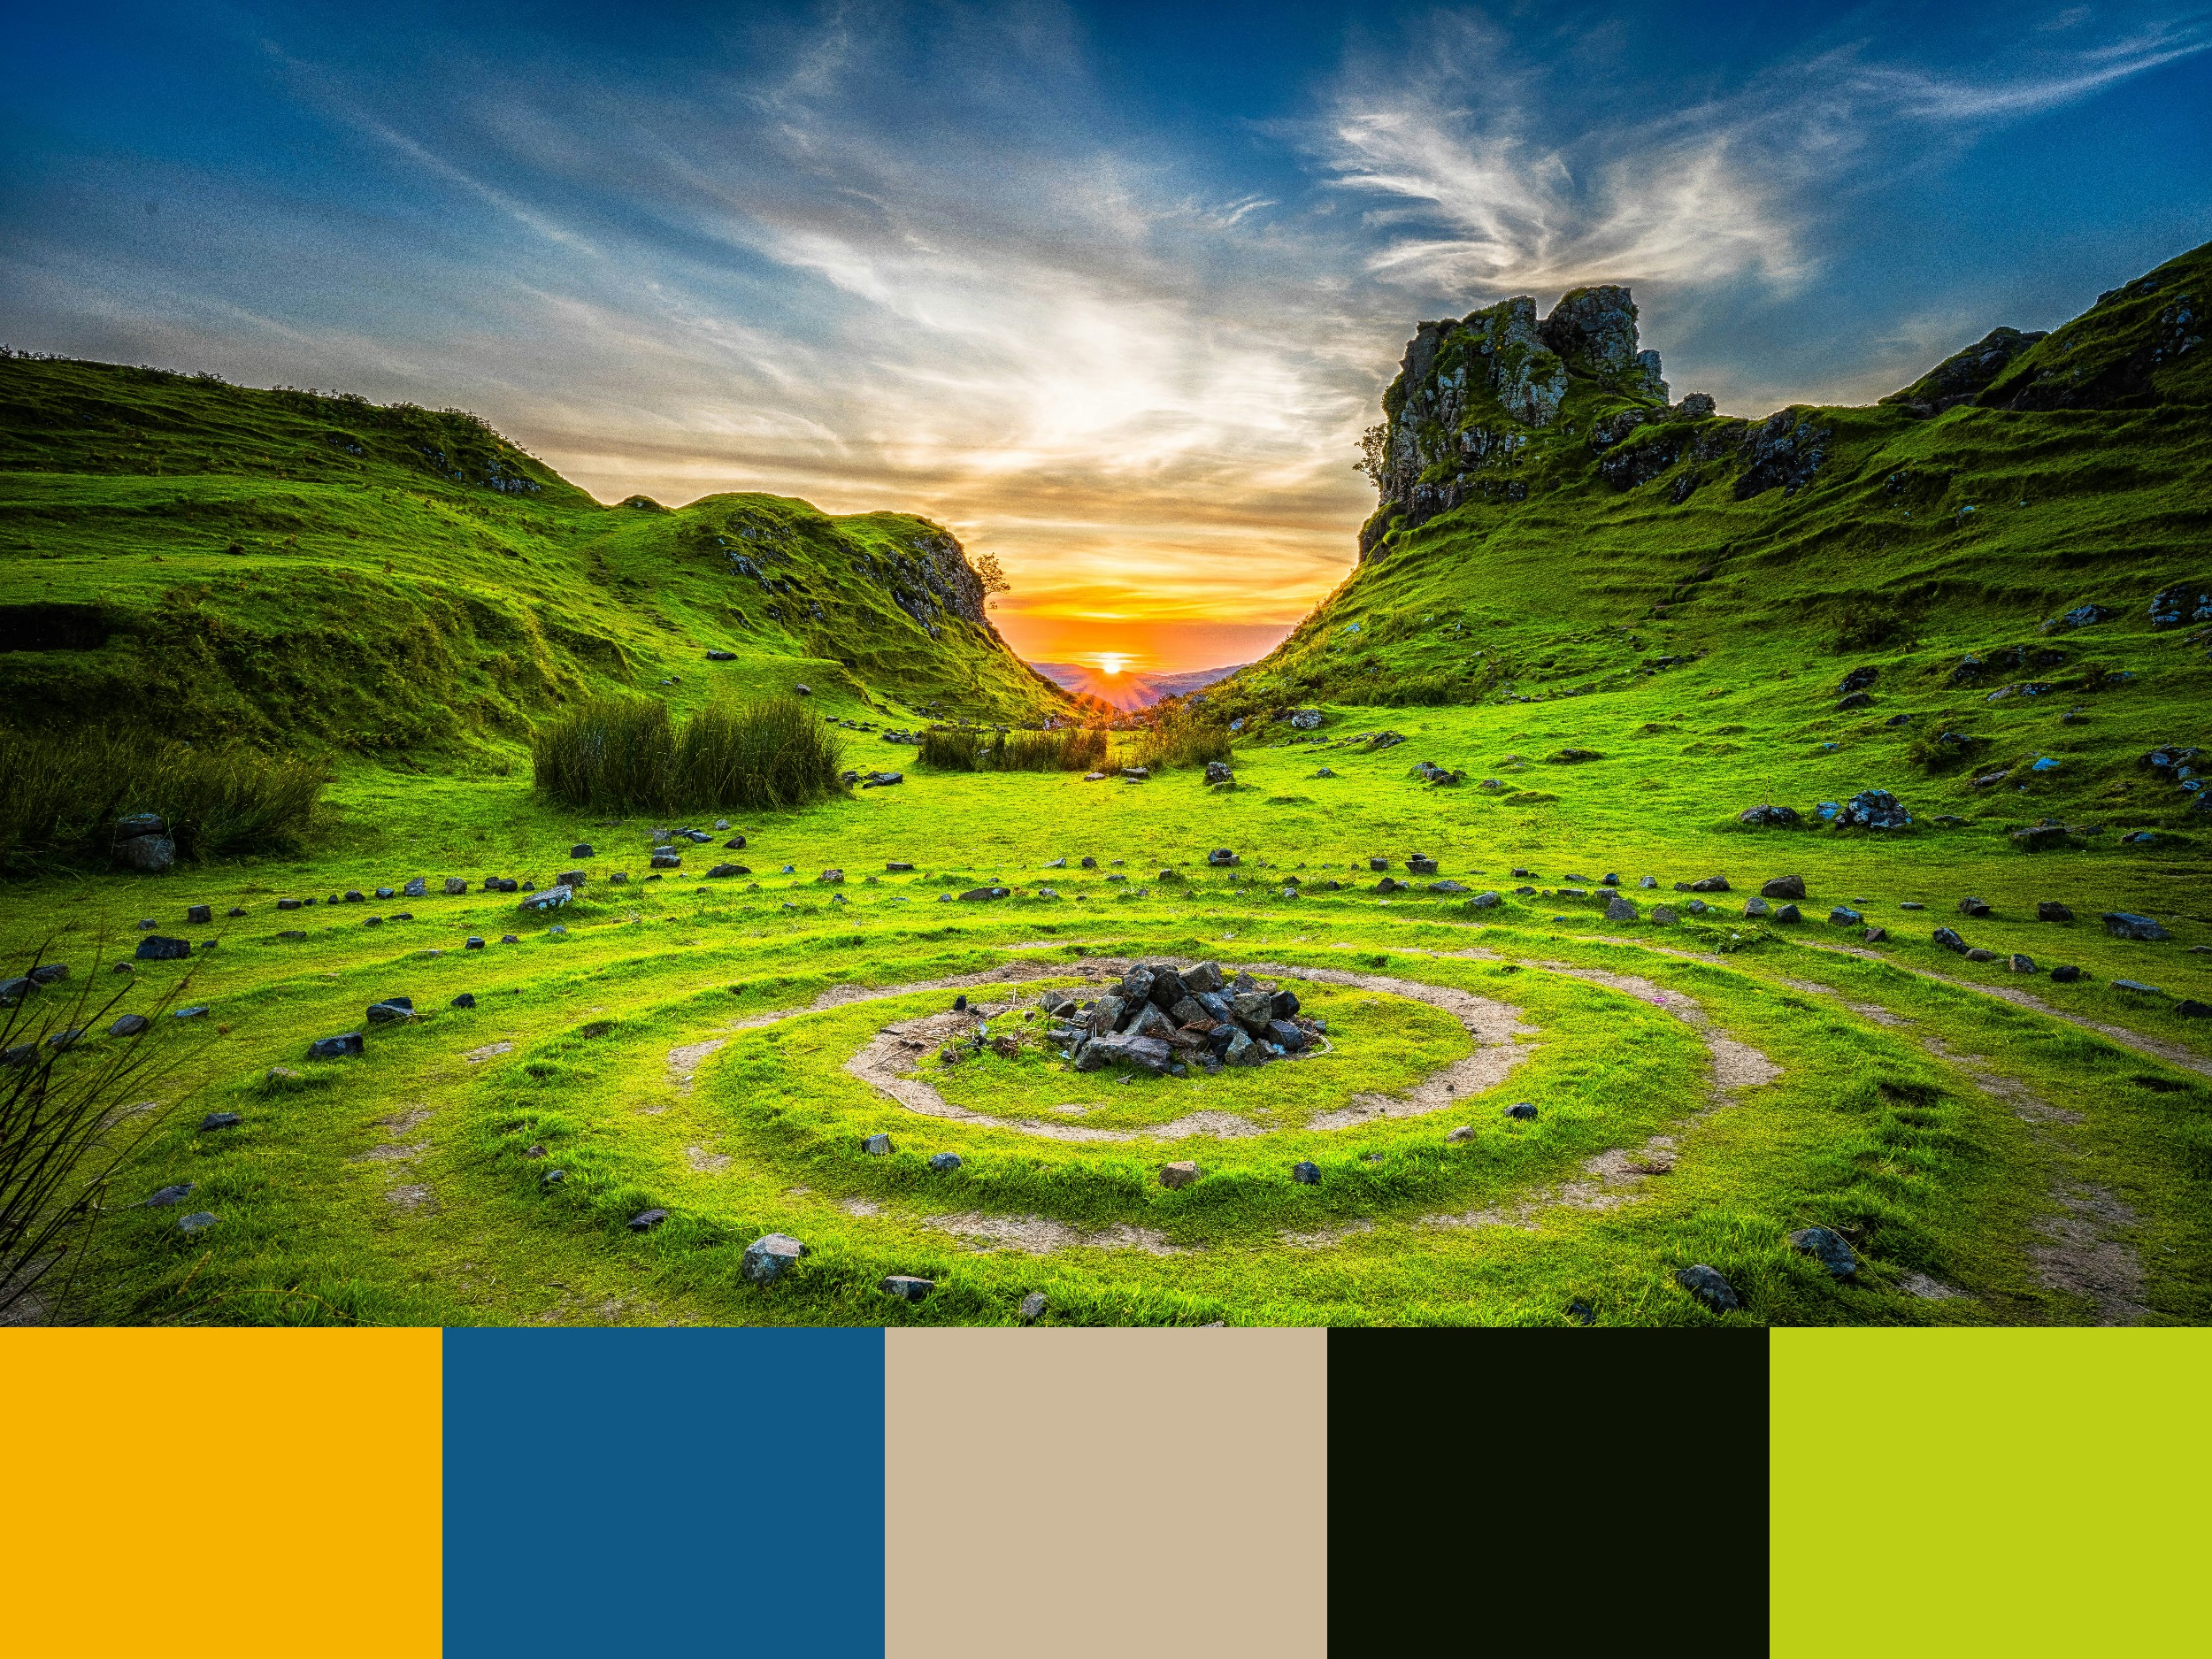
A Designer’s Guide to Utilizing Nature-Inspired Color Palettes The visual landscape surrounding us offers an
Author: Juan Fernando Pacheco
I am Juan Fernando Pacheco, a Business Development Manager, Senior Product Designer, and UX Designer with 20+ years of experience working on user-centered experiences, developing products and services driven by research and design.
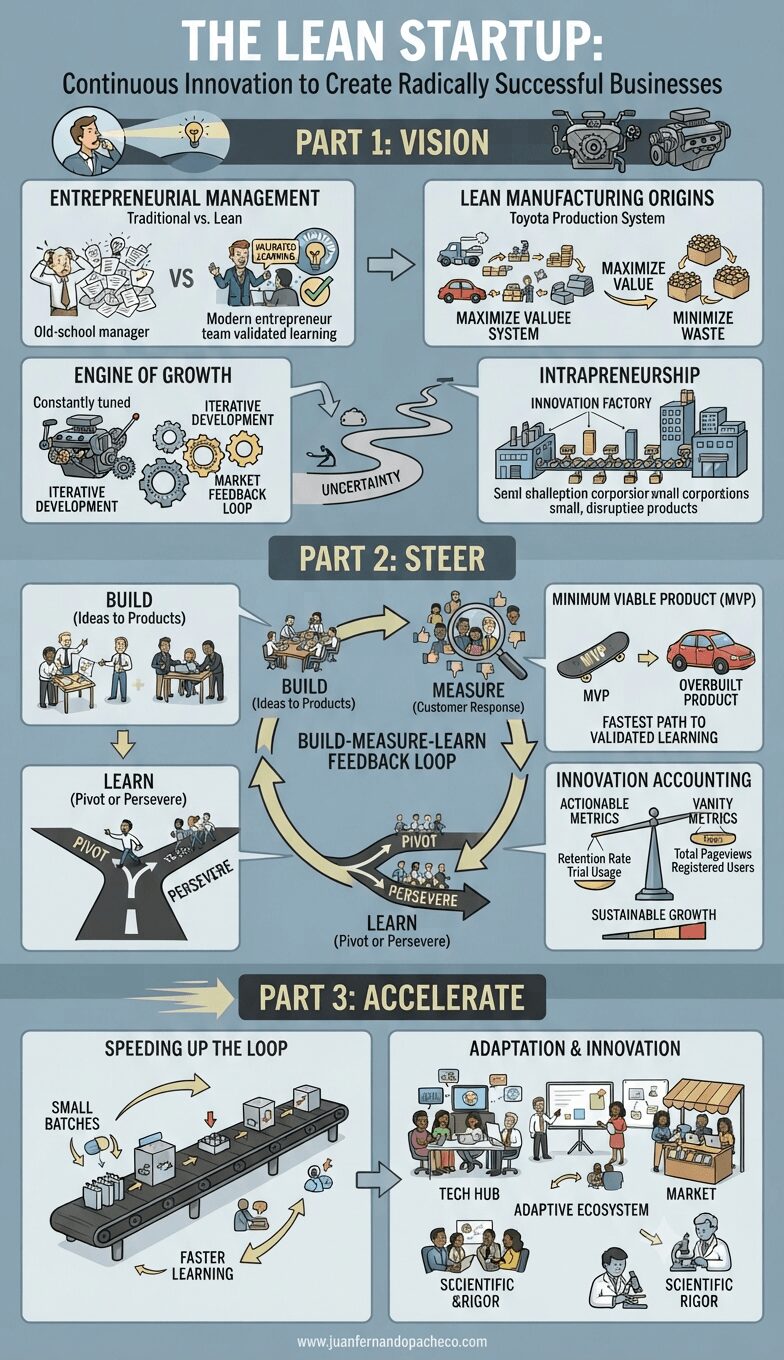
“The Lean Startup” offers a comprehensive framework for entrepreneurs and innovators to navigate the uncertainties of creating new ventures. By advocating for validated learning, iterative development, and a scientific approach to experimentation, Ries provides a pathway to build sustainable businesses and drive continuous innovation.
Design Thinking isn’t just a trendy term—it’s a human-centered revolution in problem-solving. Rooted in industrial design
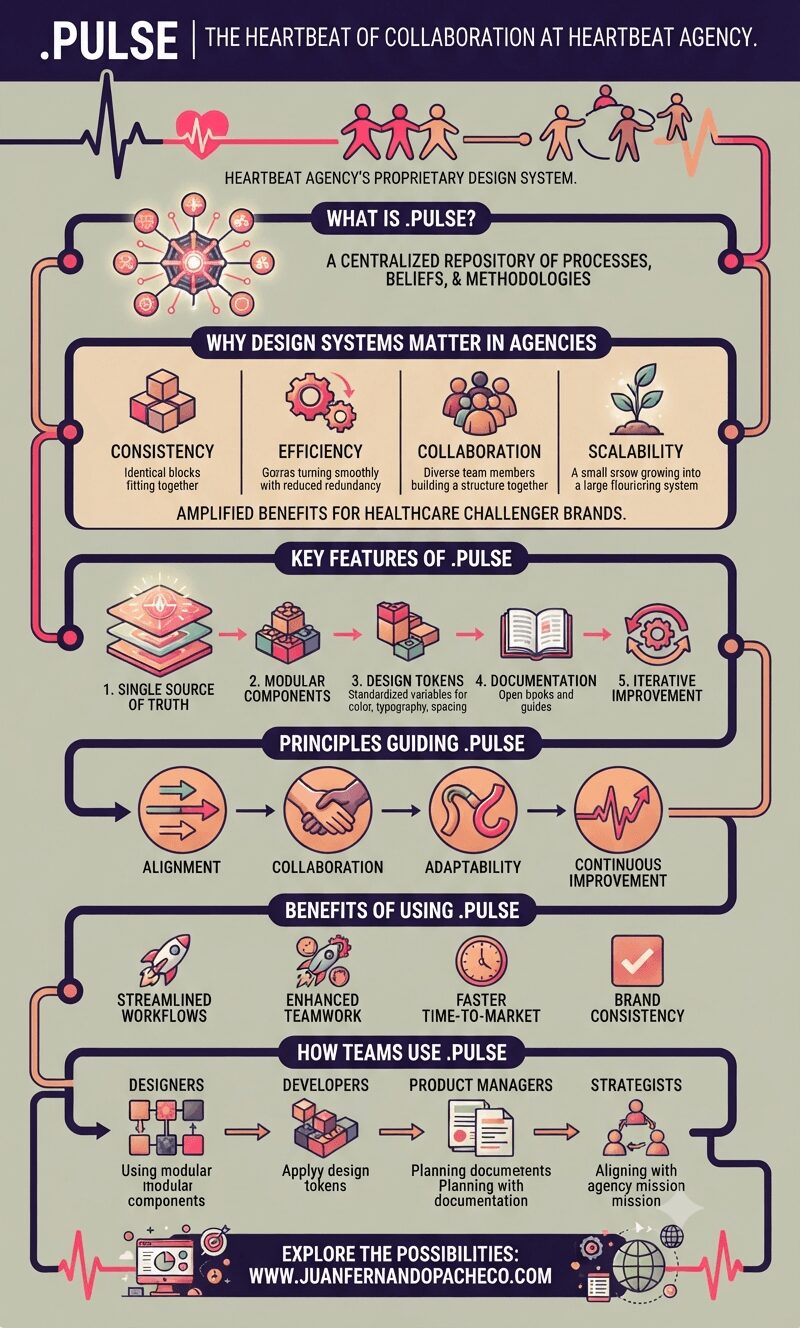
.pulse exemplifies how a well-crafted design system can transform an organization’s workflows while fostering collaboration and innovation. For Heartbeat Agency—a pioneer in healthcare marketing—this centralized source of truth has become a cornerstone of its success.

A Guide to Using Nature’s Canvas Colors in UI and Graphic Design In the realm
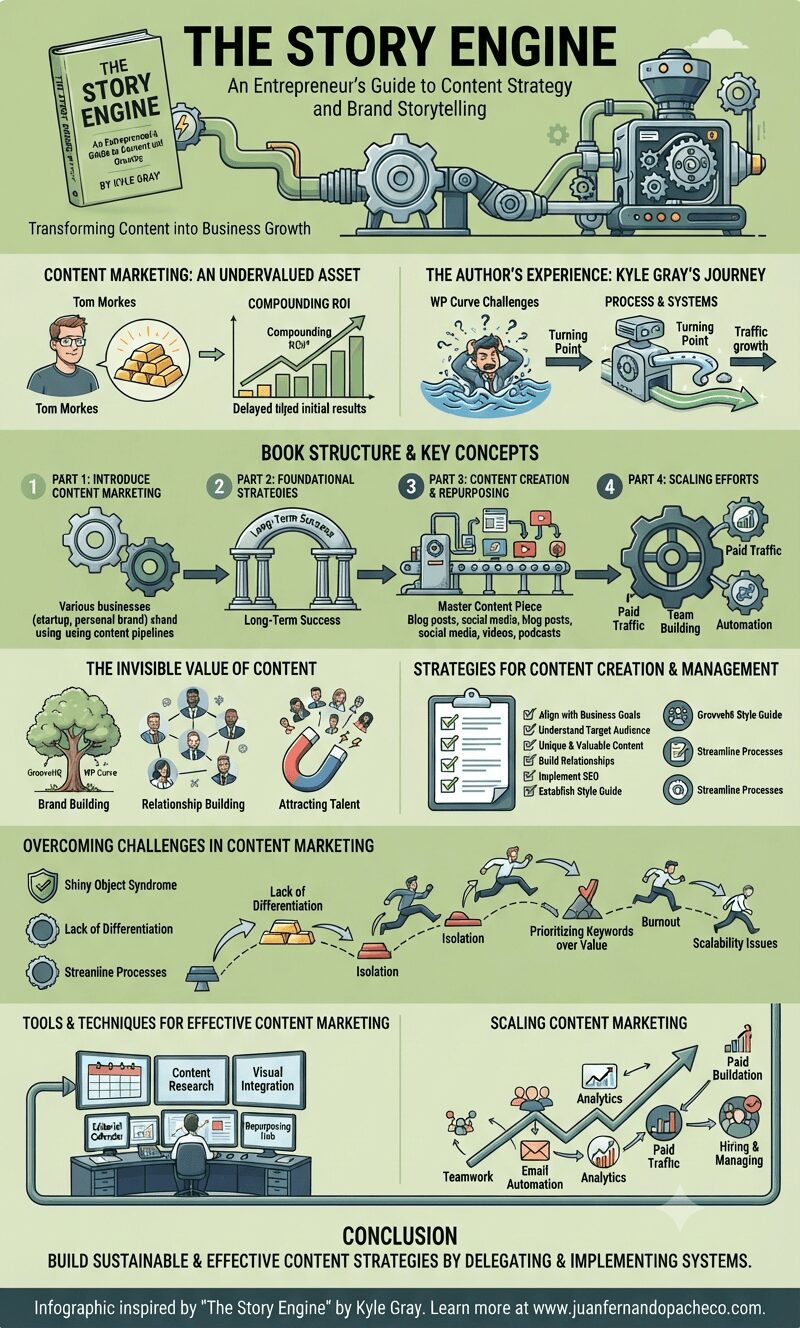
“The Story Engine” provides a comprehensive guide to content marketing, focusing on strategy, efficiency, and scalability. It combines practical advice with insights on the broader value of content marketing, aiming to help entrepreneurs build sustainable and effective content strategies.

This episode reframes problem-solving through the lens of Design Thinking—a human-centered approach rooted in empathy, creativity,
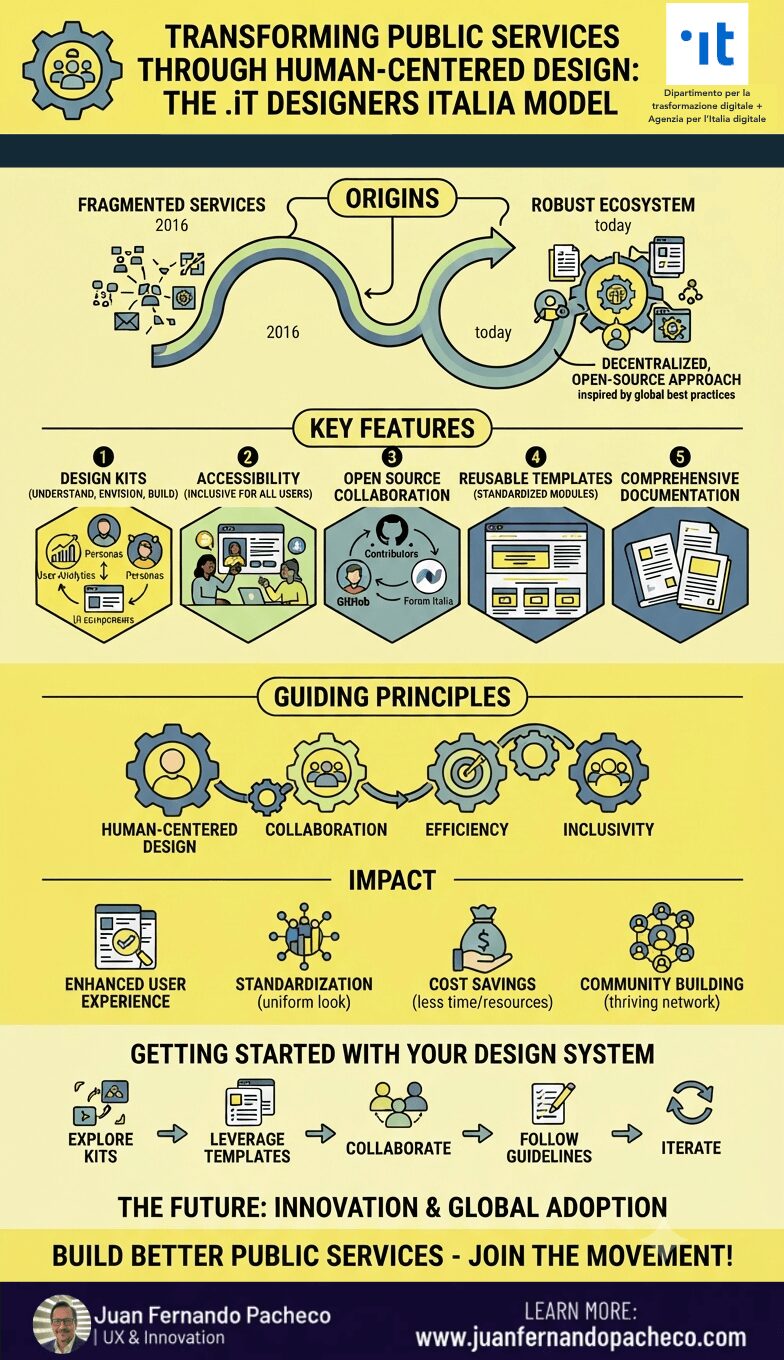
Designers Italia exemplifies how thoughtful design can transform public administration into a more inclusive and efficient entity. By providing tools, guidelines, and a collaborative platform for designers and developers, it empowers agencies to deliver high-quality digital services that truly meet citizen needs.

A Practical Color Strategy for Design Professionals The natural world provides an enduring and universally
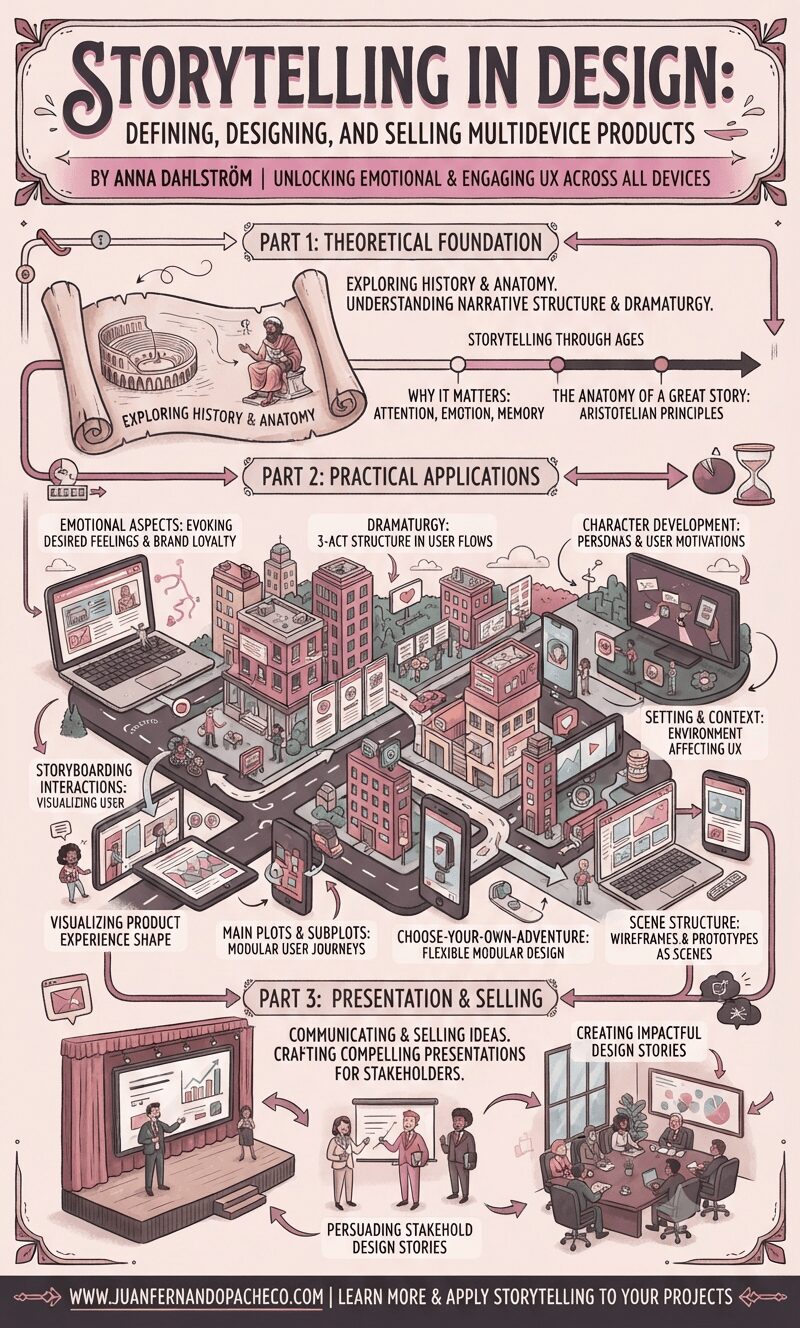
Throughout the book, Dahlström provides practical exercises and examples to help readers apply storytelling principles to their design projects.
She emphasizes that storytelling is not just about creating entertaining narratives but also about designing effective and user-centered experiences.
By drawing on the power of storytelling in design, designers can create products that are not only functional but also engaging, meaningful, and memorable.