An infographic titled 'The Eisenhower Matrix' deconstructing a productivity framework. A large 2x2 grid is divided by axes labeled 'Urgent', 'Not Urgent', 'Important', and 'Not Important'. Quadrant I (Urgent/Important, top-left) is 'Do It First' with icons of a breaking dam and fire. Quadrant II (Not Urgent/Important, top-right) is 'Schedule It' with a growing tree and gears. Quadrant III (Urgent/Not Important, bottom-left) is 'Delegate It' with a group of people. Quadrant IV (Not Urgent/Not Important, bottom-right) is 'Delete It' with a sinking ship. Below the matrix, a three-step process ('Brain Dump', 'Evaluate', 'Execute') shows how to apply the method. The bottom of the image includes the URL www.juanfernandopacheco.com.

The Eisenhower Matrix is more than a productivity hack; it is a philosophy of intentional living. It teaches us to be the architects of our time rather than the tenants of other people’s urgency. By consistently asking, “Is this important?” we align our daily actions with our long-term vision.

The goal is not to achieve a perfect, static state where no emergencies exist. The goal is to cultivate the habit of discernment—to spend more of our precious time in Quadrant II, building a meaningful future, one scheduled, important task at a time.

Infographic illustrating the "Levers for Value Creation" framework by Juan Fernando Pacheco, using a central "Value Stick" with WTP and WTS, surrounded by interconnected illustrated sections on Customer Delight, Business Profit, and Supplier Surplus, and an architectural view of technology integration.

The Value Stick is more than a diagram; it is a mindset. It forces a holistic view of your business ecosystem. You cannot win by delighting customers while exploiting employees. You cannot sustain profit by cutting costs without regard for the value you destroy.

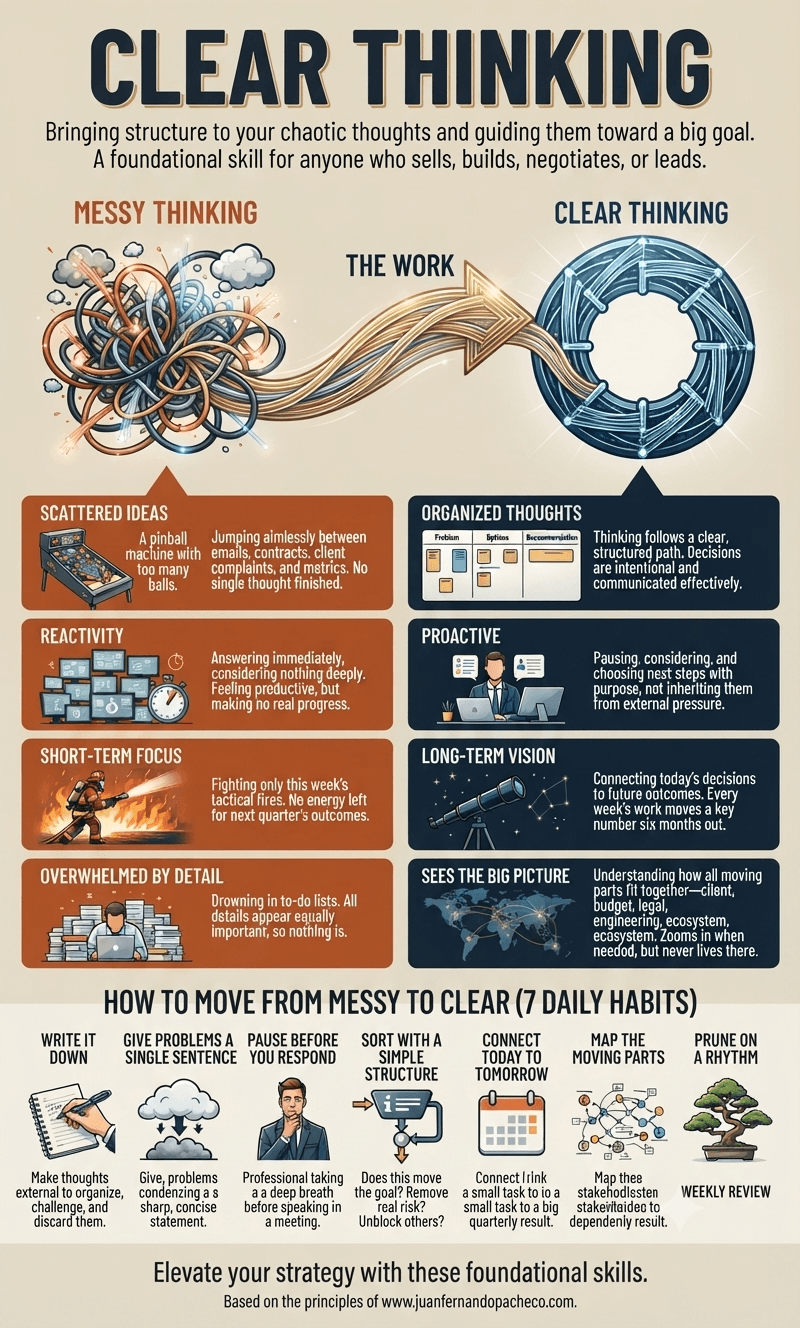
An infographic titled "Think Strategic" featuring an olive green background, illustrating the transition from messy, reactive thinking to structured strategic clarity using the Double Diamond framework and best practices for global digital products.

The journey from messy to clear thinking is a discipline. It’s a commitment to moving beyond the comfortable chaos of reaction and into the disciplined clarity of purpose. It’s the difference between juggling blindly and walking purposefully toward a known destination.

An infographic titled "Strategy Done Right," presented in three main sections on a grey background. Part 1: "The Ingredients" shows a funnel collecting data (user, competitors, analytics) leading to "Synthesis," resulting in insights, journey maps, and personas. Part 2: "The Recipe" displays three scroll icons representing Act I: The Past & Present, Act II: The Future Vision, and Act III: The Path Forward, detailing the narrative flow. Part 3: "The Alchemy" features interlocking gears labeled "Insights" and "Story," with an arrow pointing to "Beautiful Strategy" and the description "Actionable, Aligned, and Championed." The bottom banner reads "Strategy as a Craft" and "www.juanfernandopacheco.com."

Strategy is the compelling story that explains why those steps are necessary and how they lead to victory. It is the bridge between the current reality and a desired future.

The framework in this post encapsulates this perfectly:

Beautiful Strategy emerges from the alchemy of Clear Insights and a Persuasive Story.

Think of insights as your raw “ingredients” and the story as your “strategy recipe.”

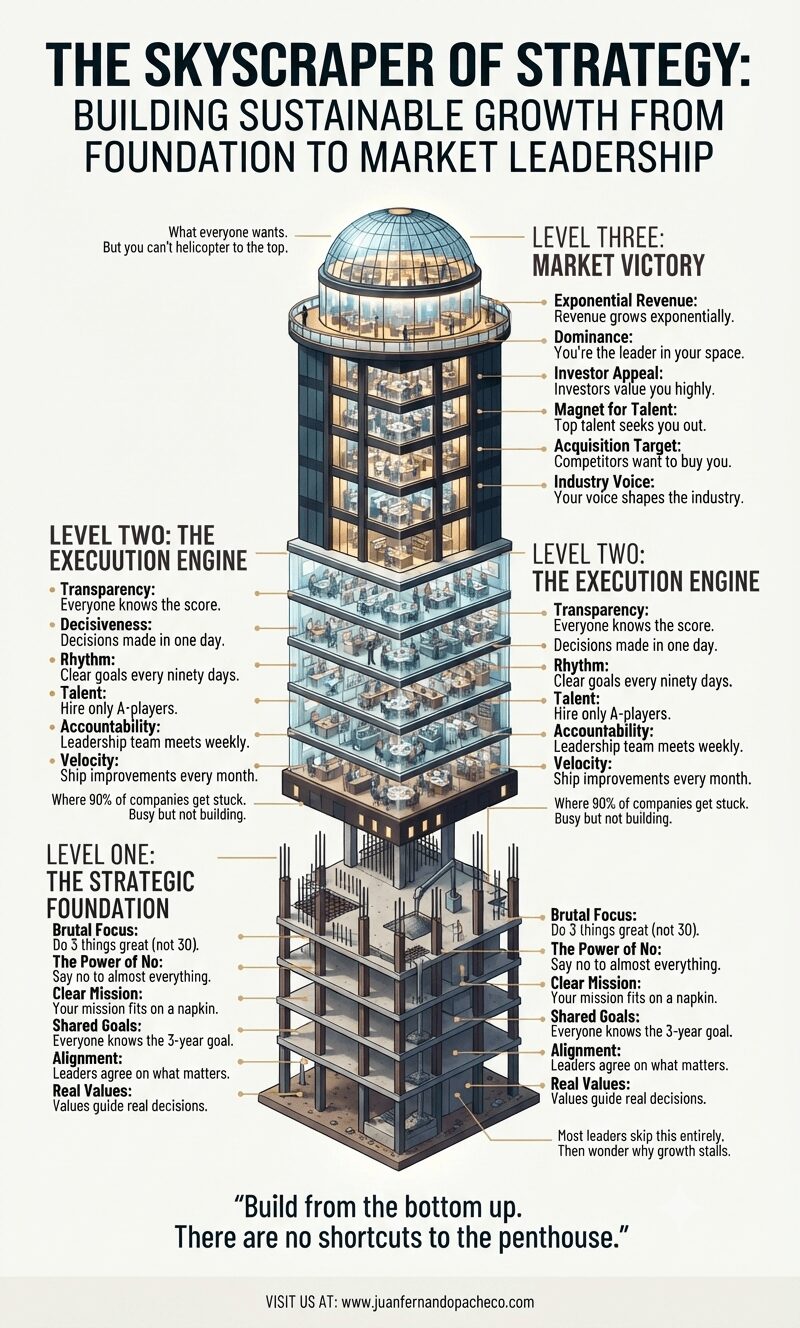
An infographic titled "Strategy Decoded" illustrating a 3-level framework for full-stack strategists, featuring Level 1 (Foundation Building Blocks), Level 2 (Business Strategy), and Level 3 (Functional Strategy) against a cream and warm earth-tone background with the URL www.juanfernandopacheco.com at the bottom.

Becoming a full-stack strategist is a journey.

Start by auditing your proficiency in the seven building blocks. Where are you strong? Where do you need improvement?
Then, practice articulating the business strategy for your team or company—even if it’s not your official job.
Finally, constantly scrutinize your functional work (whether in design, tech, product, or marketing) and ask: “Does this truly ladder up to how we’ve chosen to win?”

An educational infographic with a modern, illustrated aesthetic, structured into six sections with a teal and earth-tone color palette. It defines ecosystem thinking in UX design, dispels misconceptions, compares it to service design, provides a detailed home-buying example, outlines how to draw maps, lists strategic frameworks, and includes best practices and the website www.juanfernandopacheco.com.

The future of UX design is not in crafting perfect, isolated interactions. It is in designing intelligent, adaptive, and respectful nodes within a vast and complex human ecosystem. It requires us to be not just designers, but strategists, systems thinkers, and diplomats who can navigate the relationships between services, businesses, and most importantly, people.

By adopting ecosystem thinking, we move from creating products that people use to crafting environments that people live in. We stop building features and start building worlds. The map is the first step. It’s time to start charting.

An infographic titled "A Deep Dive into the 5 Strategy Archetypes" visualizing five strategic approaches—Classical, Visionary, Adaptive, Shaping, and Renewal—mapped against the axes of Predictability and Malleability. The graphic uses a pink and blue color scheme with illustrations like a chessboard, a rocket ship, a surfer, a conductor, and a phoenix.

The greatest risk in strategy is complacency—the unconscious application of a default approach. The framework of the five archetypes empowers us to move from a reactive stance to a proactive one. It provides a language to debate not just what we are doing, but why we are doing it and how it matches the world we operate in.

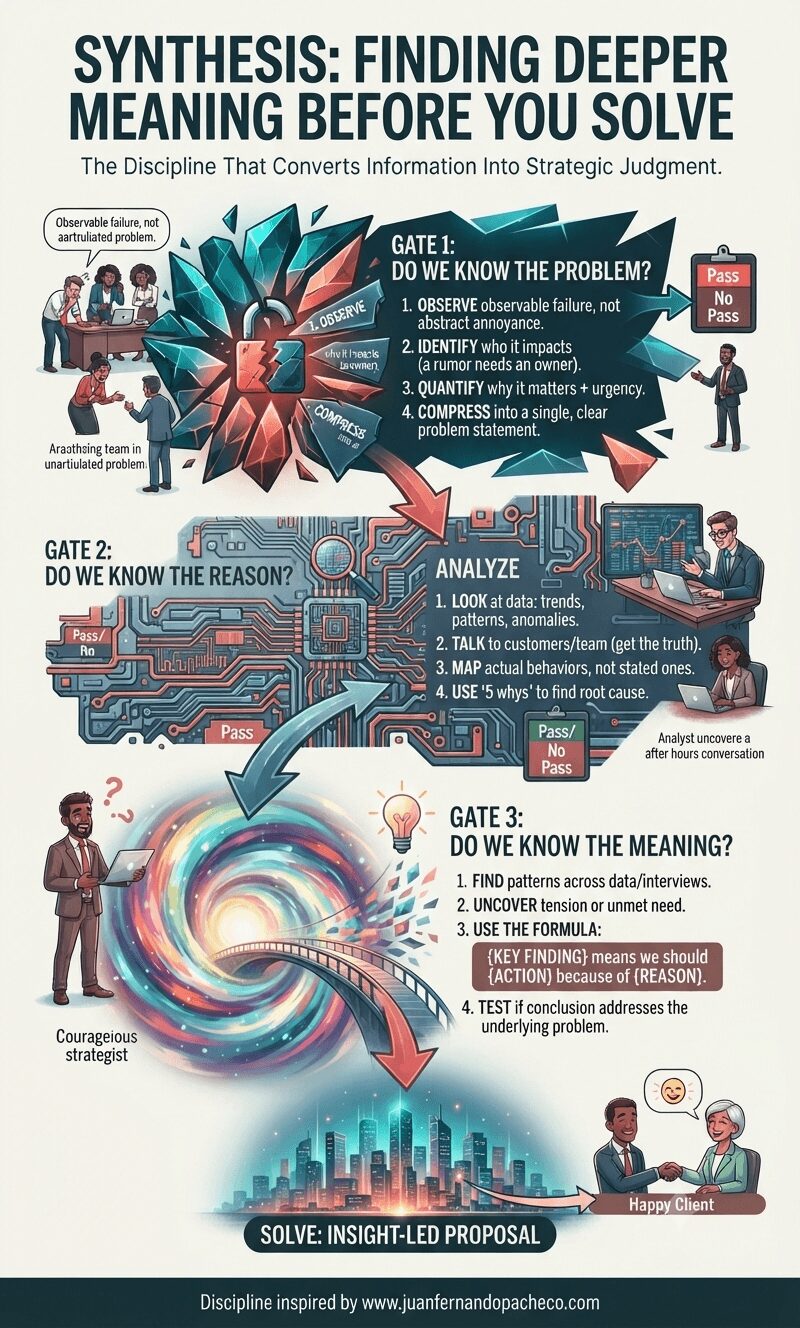
An infographic titled "CRAFT CLEAR INSIGHTS: THE STRATEGIST’S GUIDE TO FINDING MEANING IN DATA" presenting a four-stage framework for problem-solving. The flow moves from "Fuzzy Data" at the top through "Stage 1: Define," "Stage 2: Analyse," and "Stage 3: Synthesise" to "Stage 4: Solve" and "Impact" at the bottom. Visual elements include teams of UX designers and IT architects, data charts, affinity diagrams, a magnifying glass, a glowing key representing "Clear POV," and interlocking gears. The website "www.juanfernandopacheco.com" is featured throughout.

In a world saturated with data, the ability to craft clear insights is a superpower. It is the bridge between raw information and human understanding, between execution and strategy. It is what separates a feature factory from a truly impactful product team.

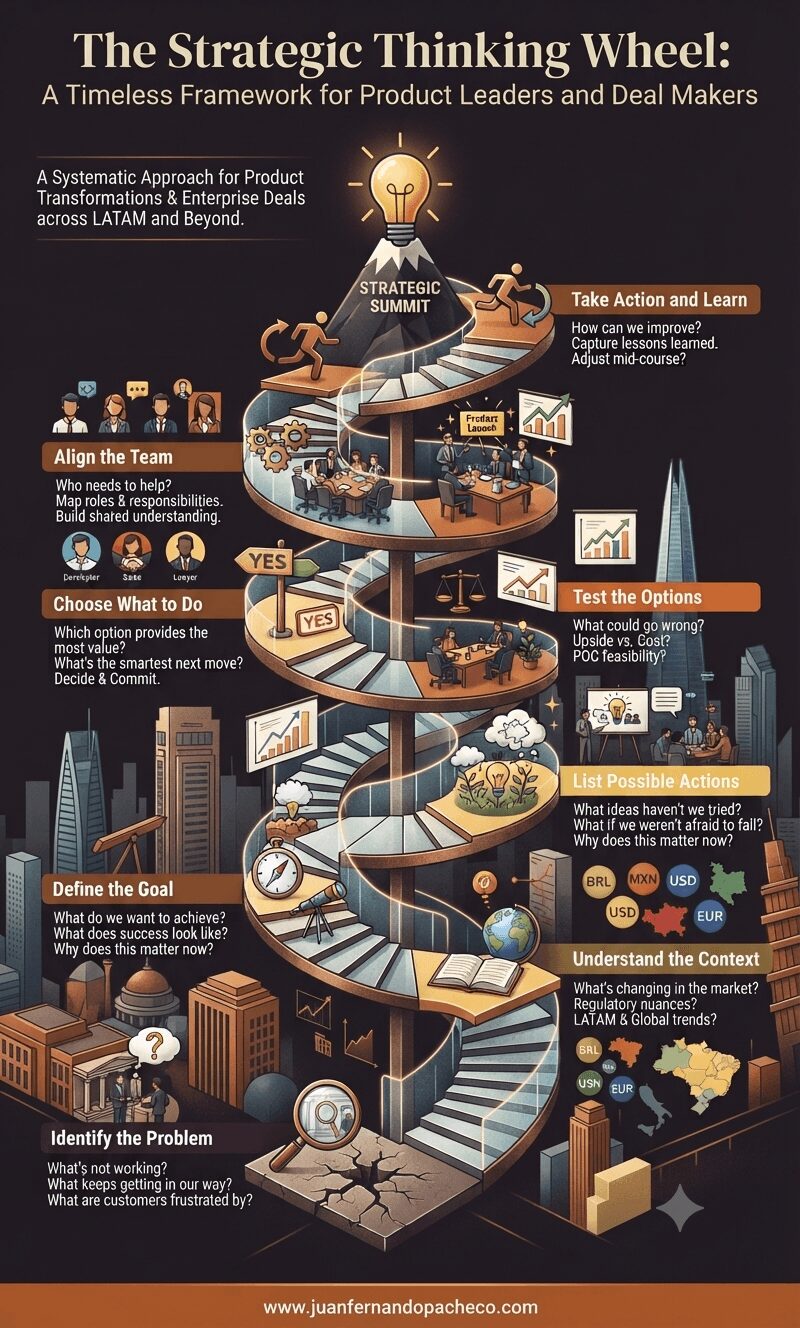
An infographic titled "Frame The Problem" illustrating the HTDQ storytelling method for strategic clarity. It uses the example of Clara, a local bookstore owner (Hero), who needs a sustainable business (Treasure) despite competition from online giants (Dragon), leading to the Quest question: "How might we help Clara...build a sustainable thriving business, despite her inability to compete on inventory size and delivery speed?" The infographic includes sections for best practices and essential tools, with attribution to www.juanfernandopacheco.com.

Framing the problem is the highest-leverage activity in any strategic endeavor. It is the art of asking the right question before desperately searching for answers. The HTDQ method provides a memorable, robust, and human-centered framework to master this art.

A comprehensive business infographic titled "Create New Value. The Strategic Art of Winning Markets Without Inventing New Tech." The image is divided into stacked sections: "The Core Principle: Value Creation > Invention," a detailed "Case Study: Canva – Mastering the Gap" (including a 2x2 positioning map, inputs, outputs, and UX insights), "Frameworks for Spotting Value Gaps" (Blue Ocean Strategy, Value Proposition Canvas, Jobs-to-Be-Done), "Tools & Best Practices for Execution" (Market Research, UX/UI Design, Technical Architecture, Business Model), and "Avoiding Pitfalls" (Feature Bloat, Ignoring Non-Consumers, Poor Scalability). The infographic uses diagrams, charts, and icons, concluding with a call to action and the URL "www.juanfernandopacheco.com."

Visionaries spot gaps in the market—unmet needs others overlook—and craft solutions so elegantly aligned with those gaps that they carve out entirely new categories.

Let’s dissect this with surgical precision, using real-world examples, battle-tested frameworks, and actionable tools. By the end, you’ll see how to identify and own your “white space” in any market.

An intricate infographic titled 'Think Long Term,' illustrating a strategic blueprint for exponential growth based on the provided post. The central element is a graph showing an exponential teal curve labeled 'Long Term' overtaking a plateauing coral dotted line ('Short Term') at a glowing 'Inflection Point' (y=a(1+r)t). Below the graph, the strategy is broken into four detailed pillars: Sustainable Growth: Building Foundations, with a flywheel model (Customer Input → Output → Reinvestment). Resilience: Antifragile Systems, featuring a scenario planning matrix and contingency playbooks. Innovation: Patient Cultivation, depicted as a branching path (Horizon Model) leading to a 'Disruptive R&D Seedling.' Deep Impact: Legacy Systems, shown as a pathway from an initial structure to a mature B-Corp house with deep roots. A sidebar lists an 'Implementation Toolkit' (OKRs, Wardley Mapping, Data Lakes). A case study highlights 'Microsoft's 10-Year Cloud Bet.' The infographic ends with the footer text: 'Your inflection point awaits. Find your long-term strategy blueprint at: www.juanfernandopacheco.com.' The overall color scheme is a blend of soft green (#9ece9a), teal, and warm coral.

In the 1980s, IBM dominated mainframe computers while Microsoft focused on the embryonic PC market—a classic long-term gamble. Bill Gates famously said, 

“We always overestimate the change that will occur in two years and underestimate the change that will occur in ten.” 

This encapsulates the power of long-term thinking: the deliberate prioritization of future exponential gains over immediate rewards.