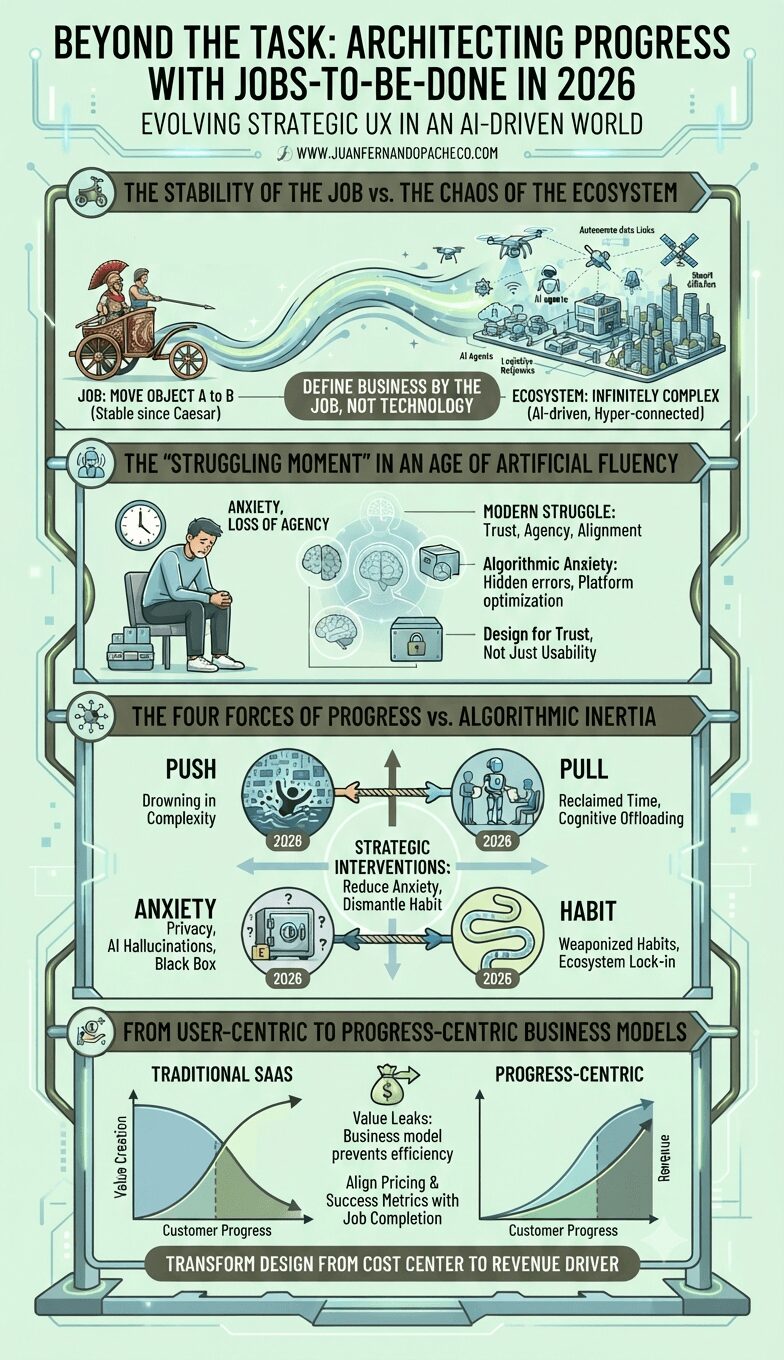
To truly master Strategic UX and Jobs-to-be-Done, we must look beyond the functional task and dive into the deep psychology of the user.
Tag: Business
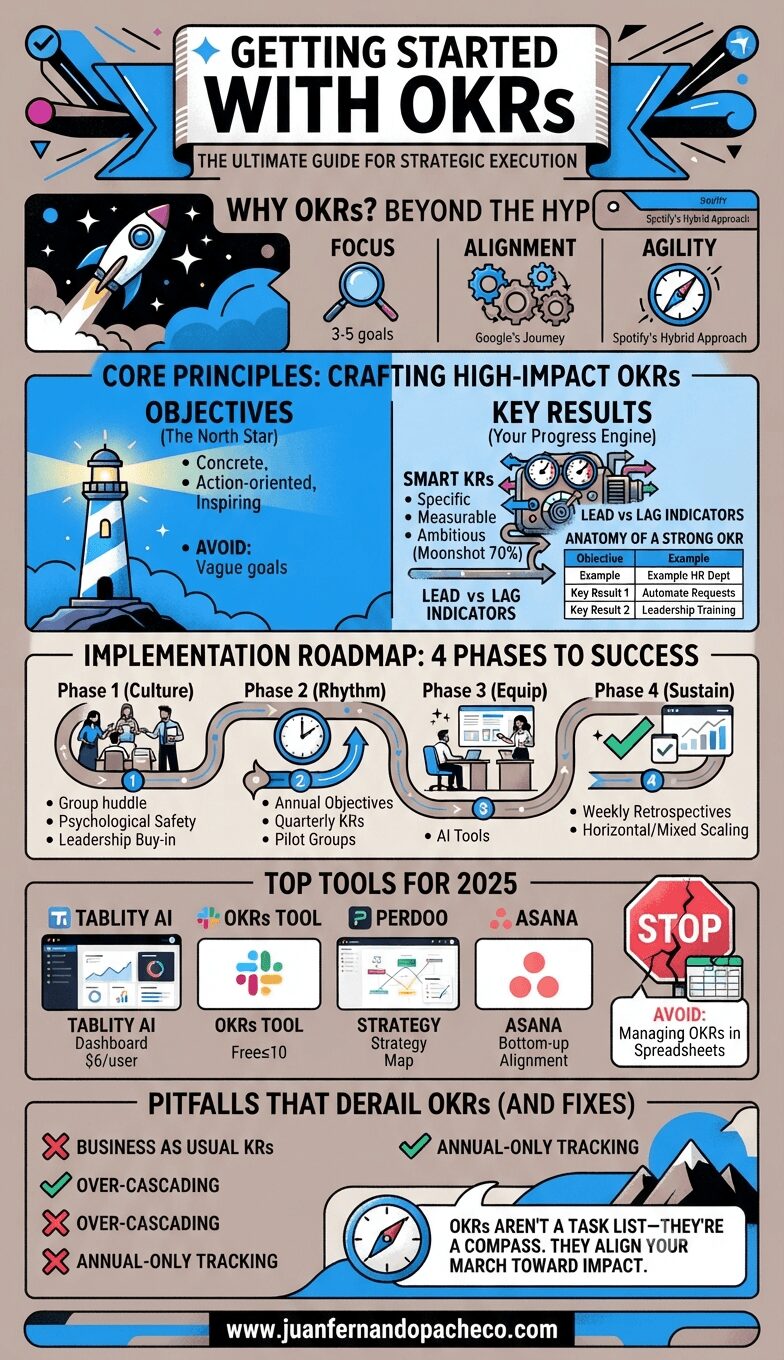
Objectives and Key Results (OKRs) emerged as the solution—a goal-setting framework that turned companies like Google from a 40-person startup into a 100,000-employee tech giant.
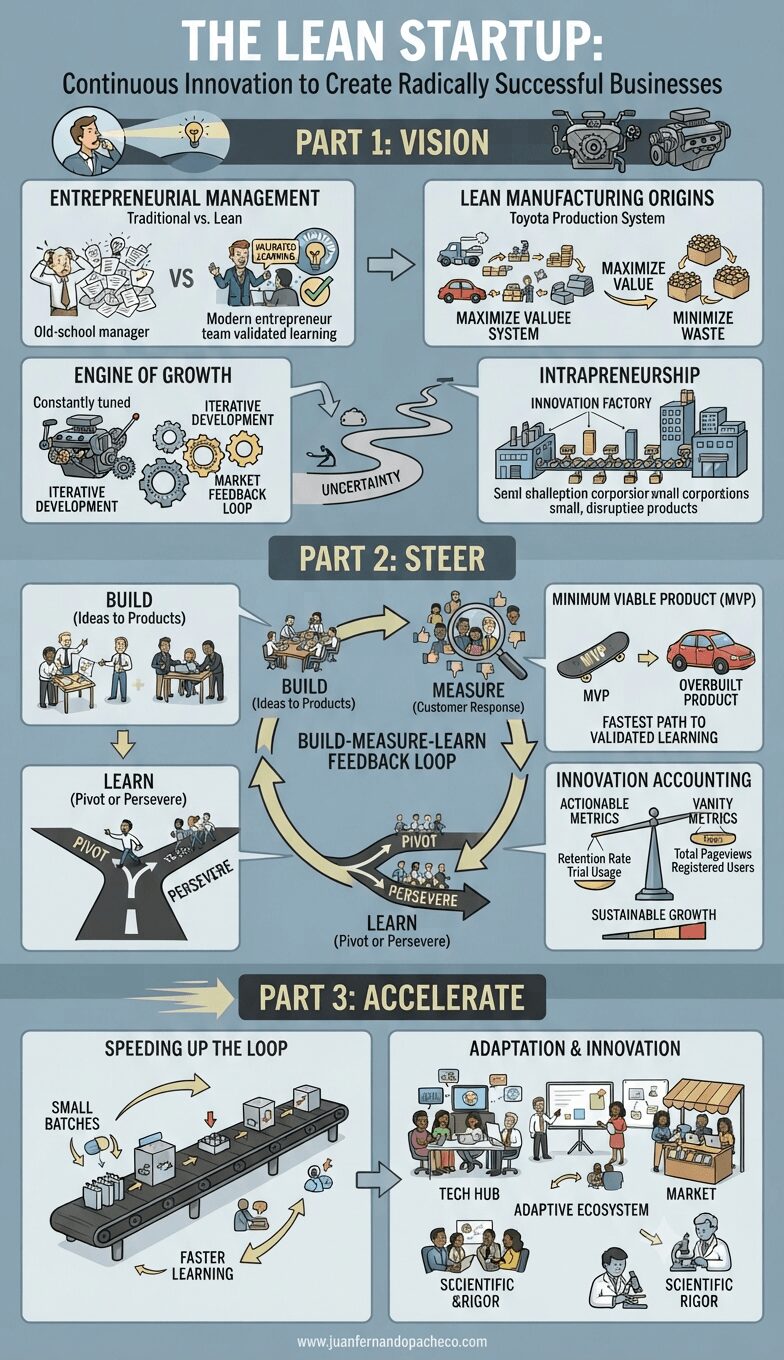
“The Lean Startup” offers a comprehensive framework for entrepreneurs and innovators to navigate the uncertainties of creating new ventures. By advocating for validated learning, iterative development, and a scientific approach to experimentation, Ries provides a pathway to build sustainable businesses and drive continuous innovation.
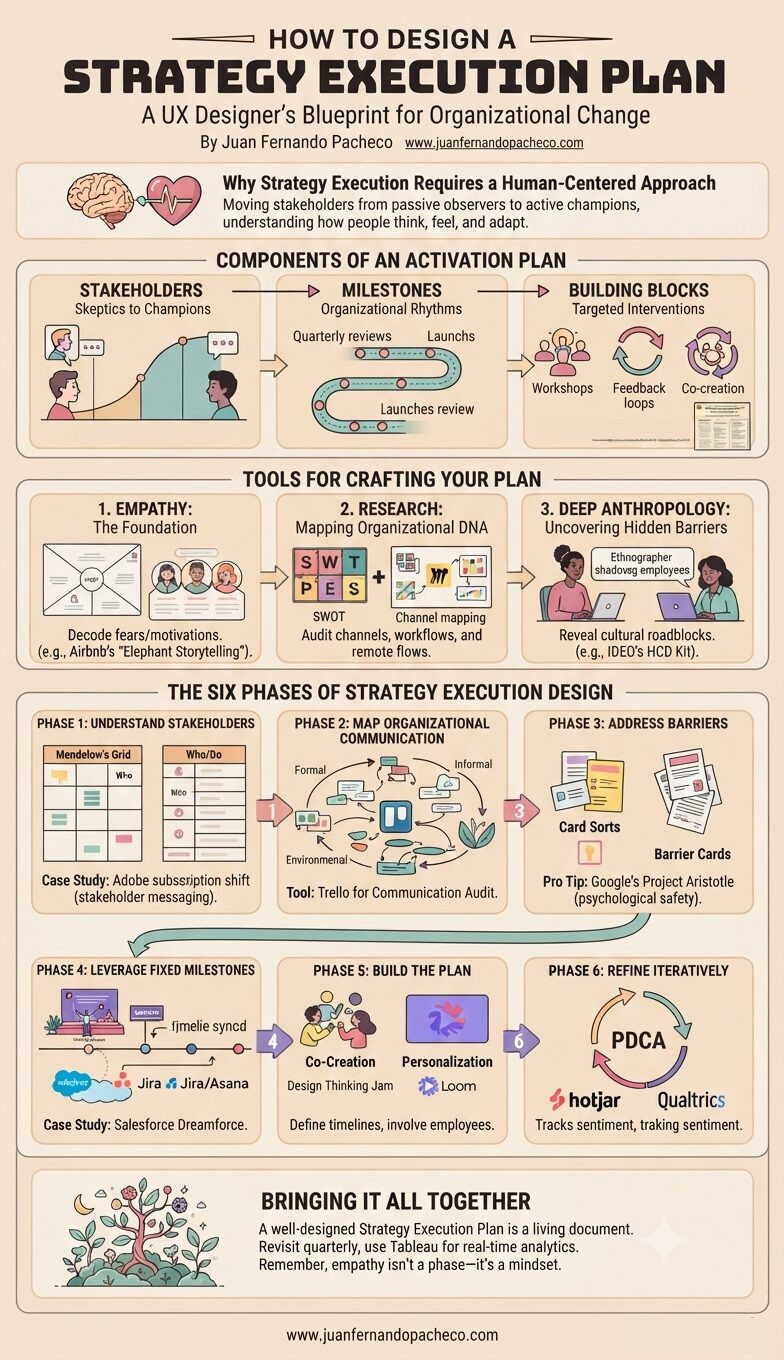
Designing a Strategy Execution Plan is less about checklists and more about understanding the human ecosystem. By marrying UX principles with organizational psychology, you turn resistance into momentum.
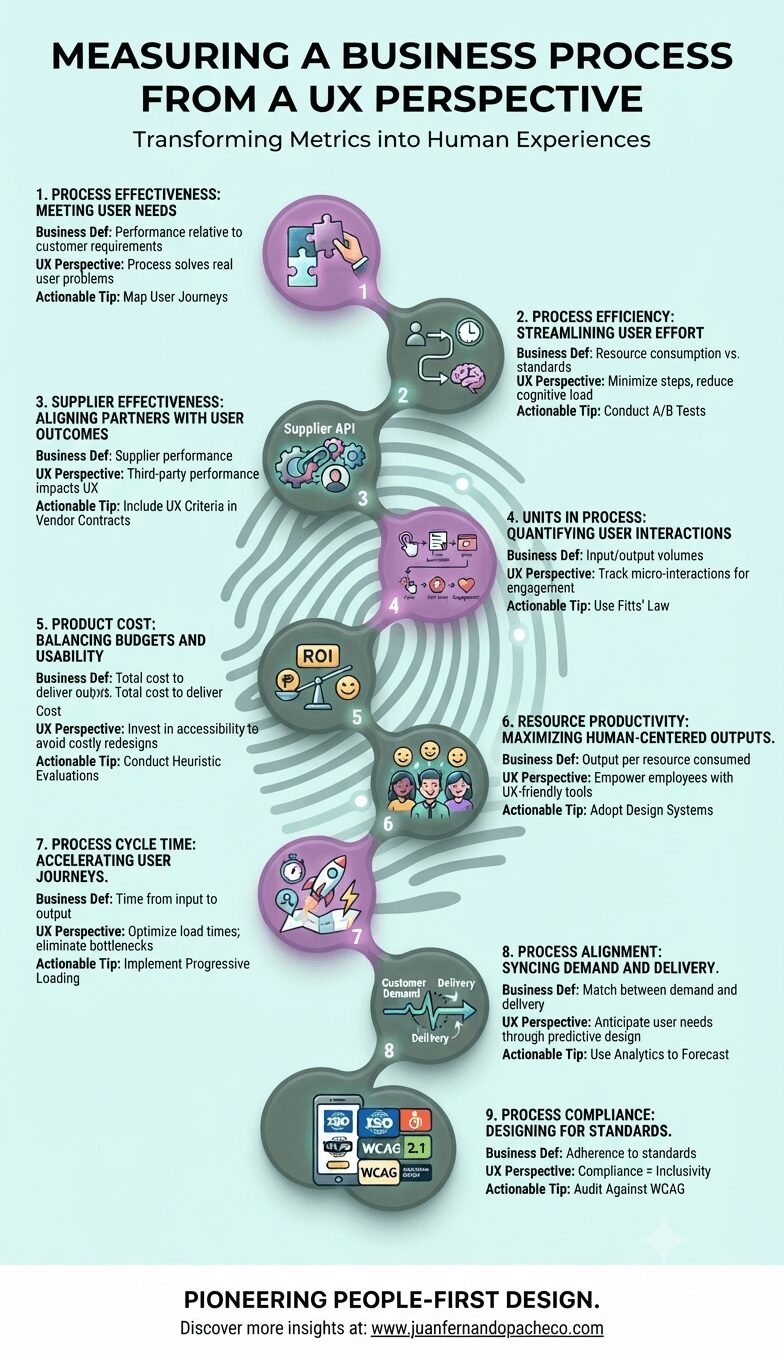
Measuring business processes through a UX lens transforms abstract metrics into human stories. By aligning efficiency with empathy, and compliance with inclusivity, organizations can create processes that delight users and drive ROI. As UX pioneers, our task is to ensure that every click, second, and dollar spent reflects a commitment to people-first design.
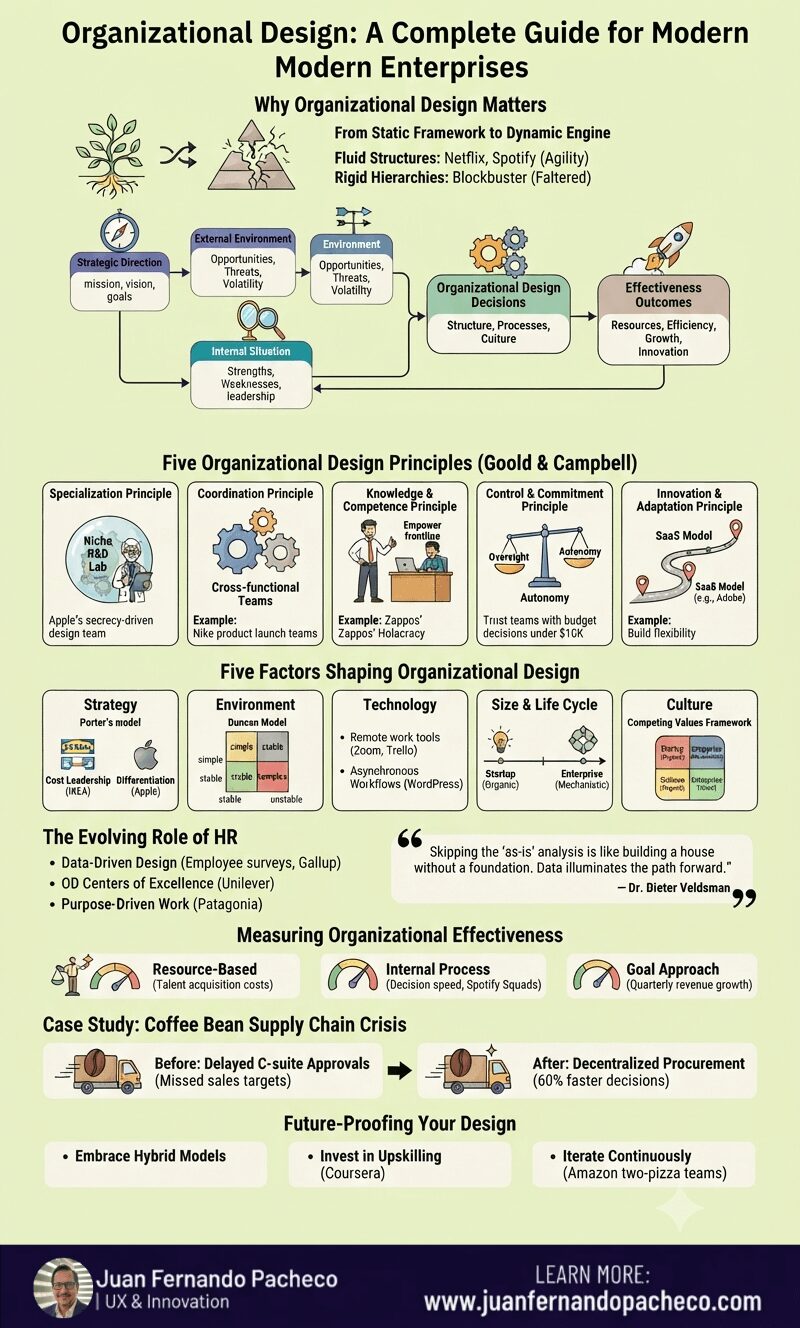
Organizational design isn’t a one-time project—it’s a journey. By aligning strategy, culture, and structure, businesses can navigate disruption, attract top talent, and outperform competitors. Start small: Audit your current design, involve cross-functional stakeholders, and prioritize flexibility. As the Greek philosopher Heraclitus said, “Change is the only constant.” Design for it.
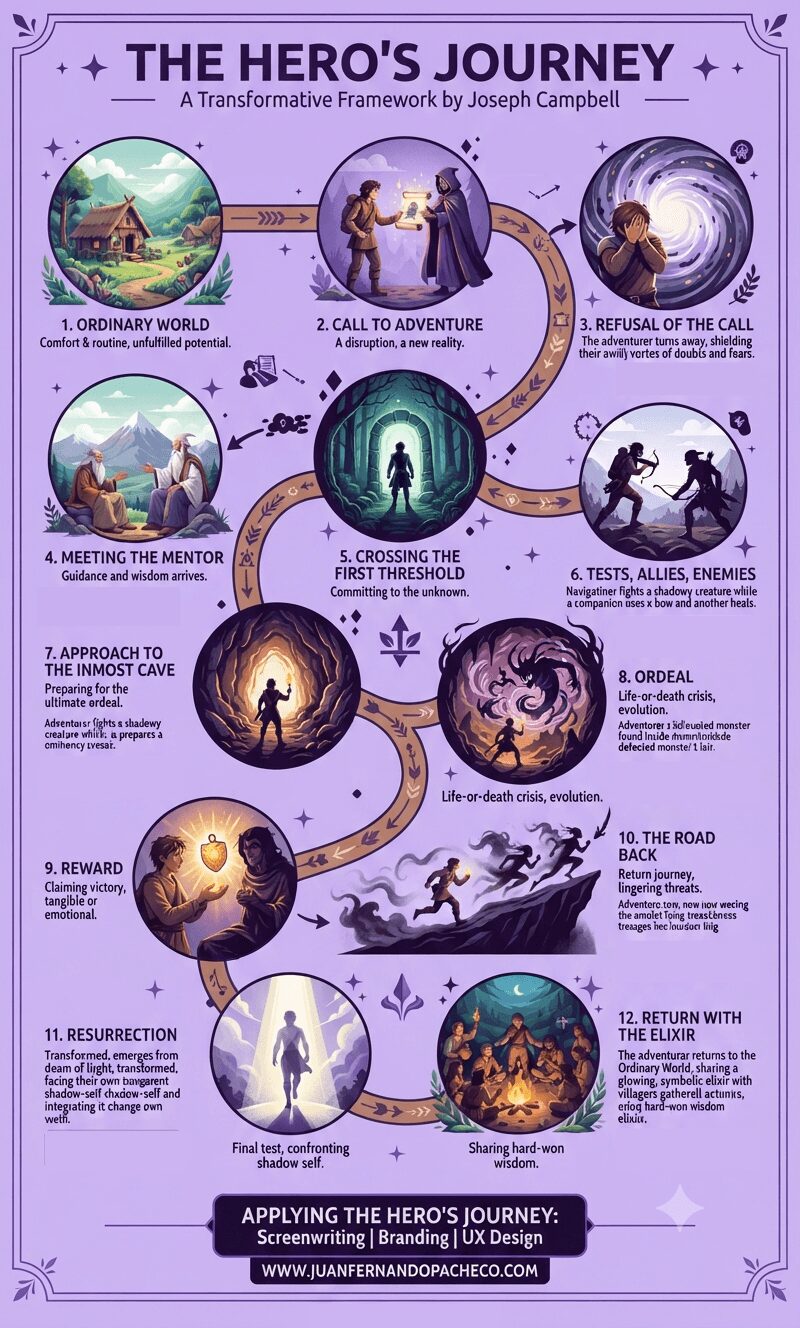
The Hero’s Journey isn’t just a storytelling tool—it’s a mirror reflecting our collective struggles and triumphs. Whether you’re writing a novel, designing an app, or navigating personal growth, remember Campbell’s words: “Where you stumble, there lies your treasure.”
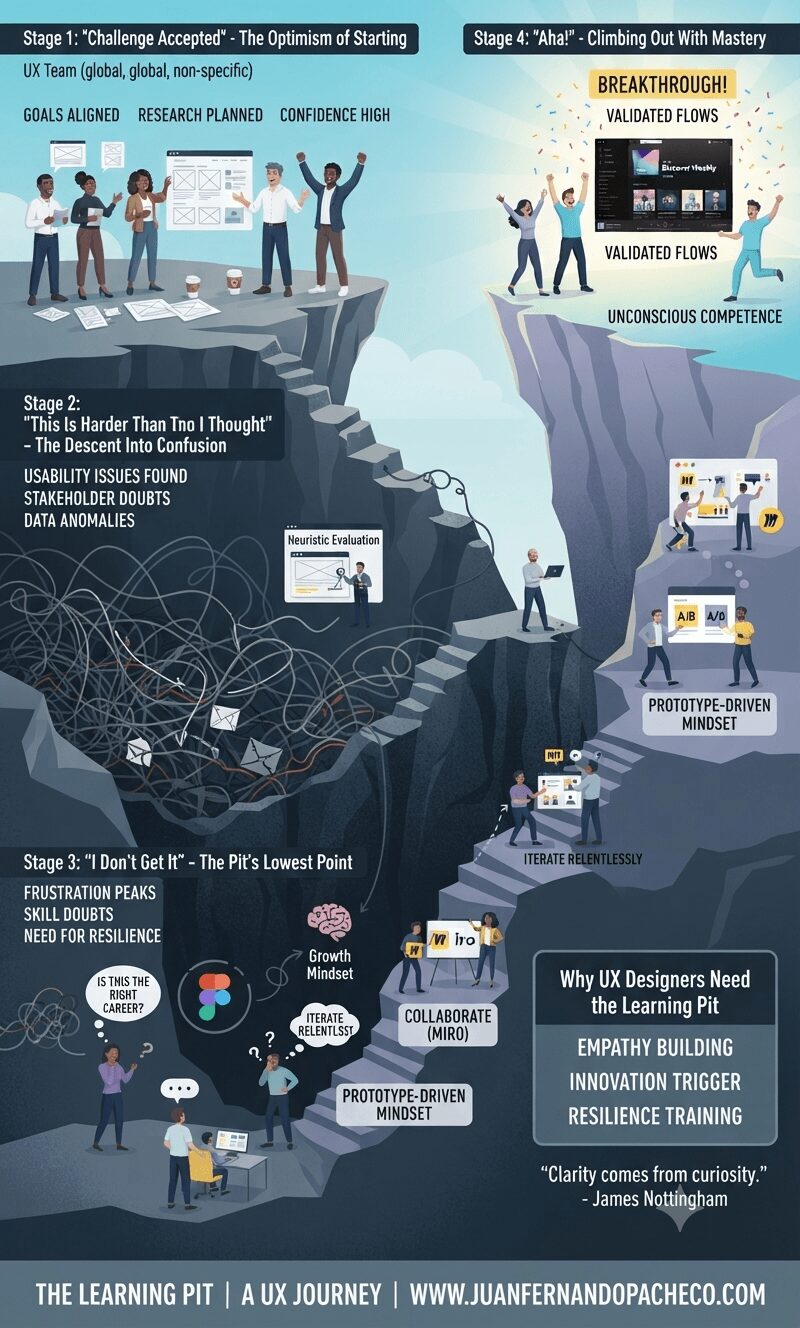
The Learning Pit isn’t just a metaphor; it’s a roadmap for UX excellence. By embracing confusion, designers uncover deeper insights, build resilience, and create solutions that truly resonate. As James Nottingham says, “Clarity comes from curiosity.” So next time you’re in the pit, remember: the struggle is where magic happens.
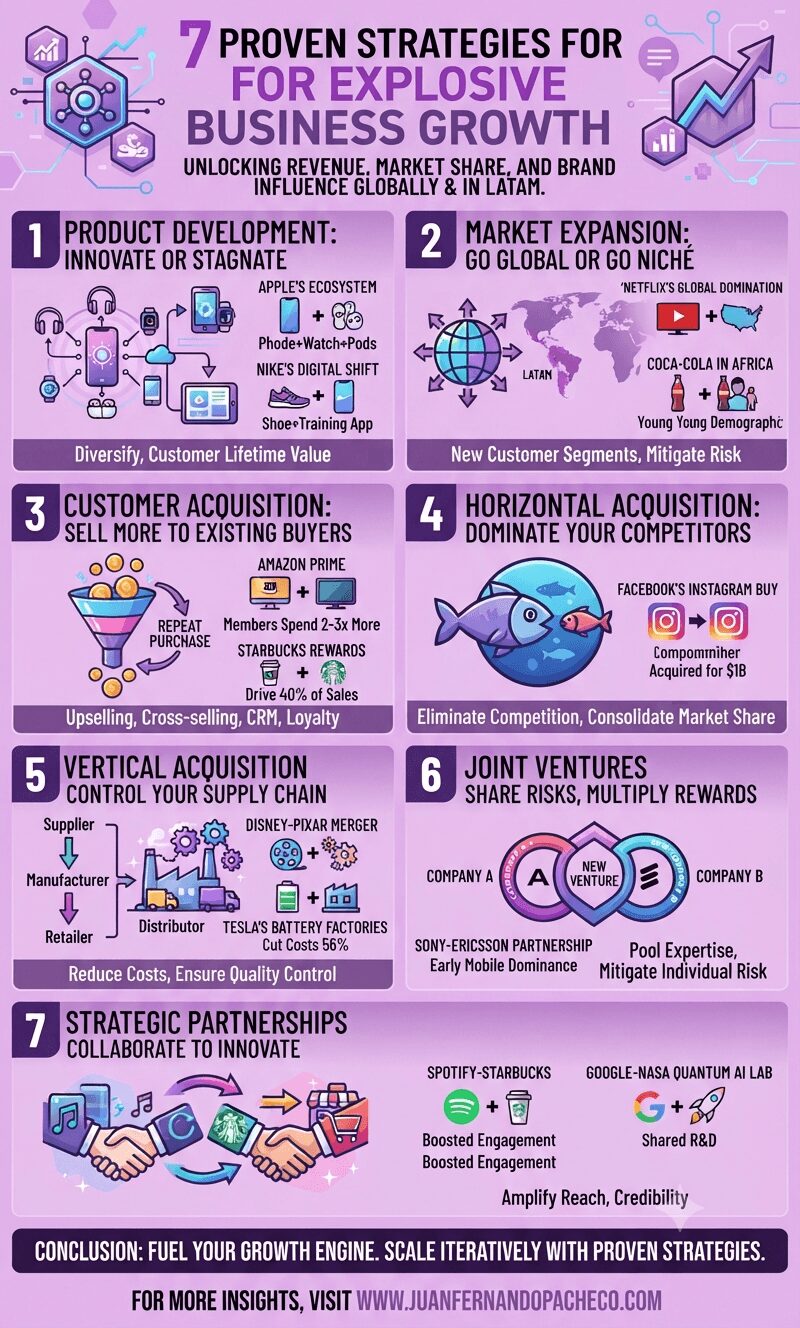
Explosive growth isn’t accidental—it’s engineered through strategic choices. Whether through acquisitions, partnerships, or product innovation, each strategy offers unique advantages.
Start with one tactic, measure results using KPIs, and scale iteratively. For tailored guidance, explore tools like SEMrush for SEO optimization or McKinsey’s Growth Framework for strategic planning.
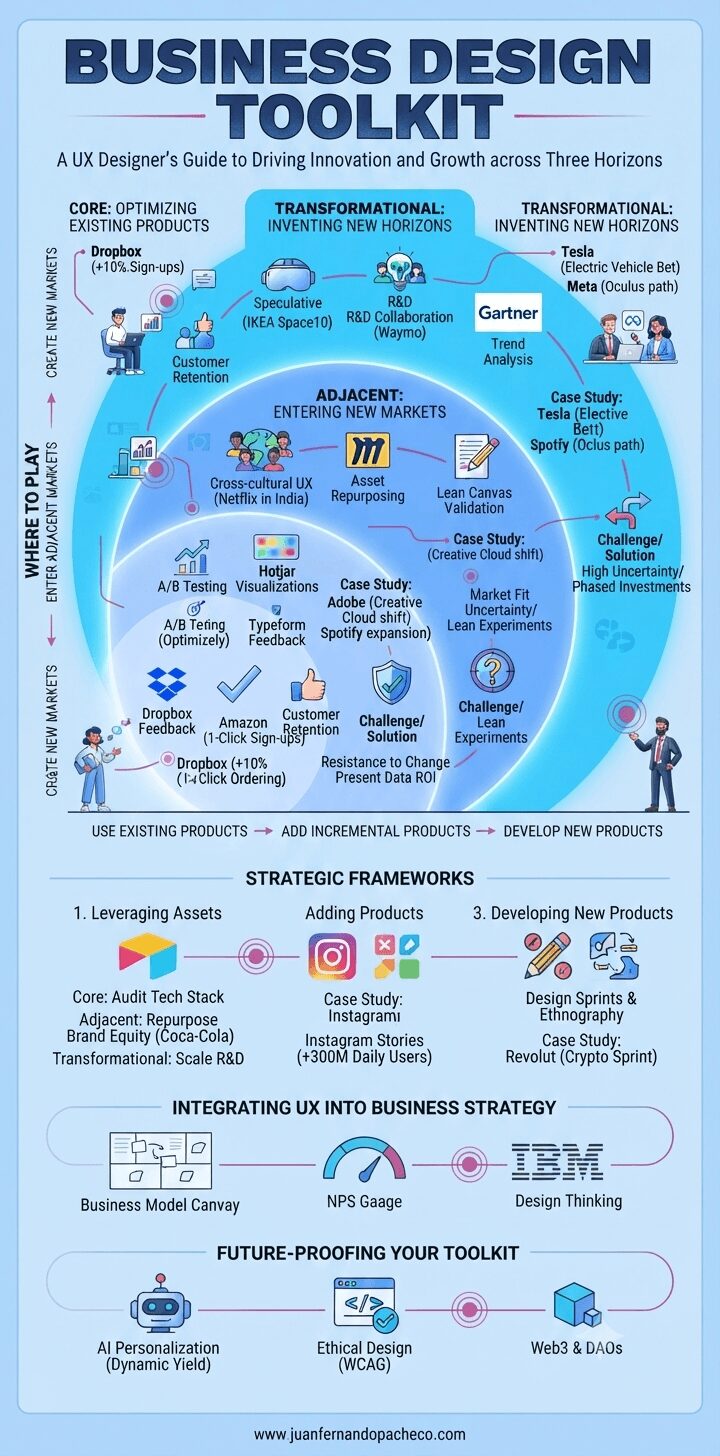
A business design toolkit is not static—it evolves with market shifts and technological advancements. By mastering Core optimization, Adjacent expansion, and Transformational disruption, UX designers can become strategic partners in driving sustainable growth.