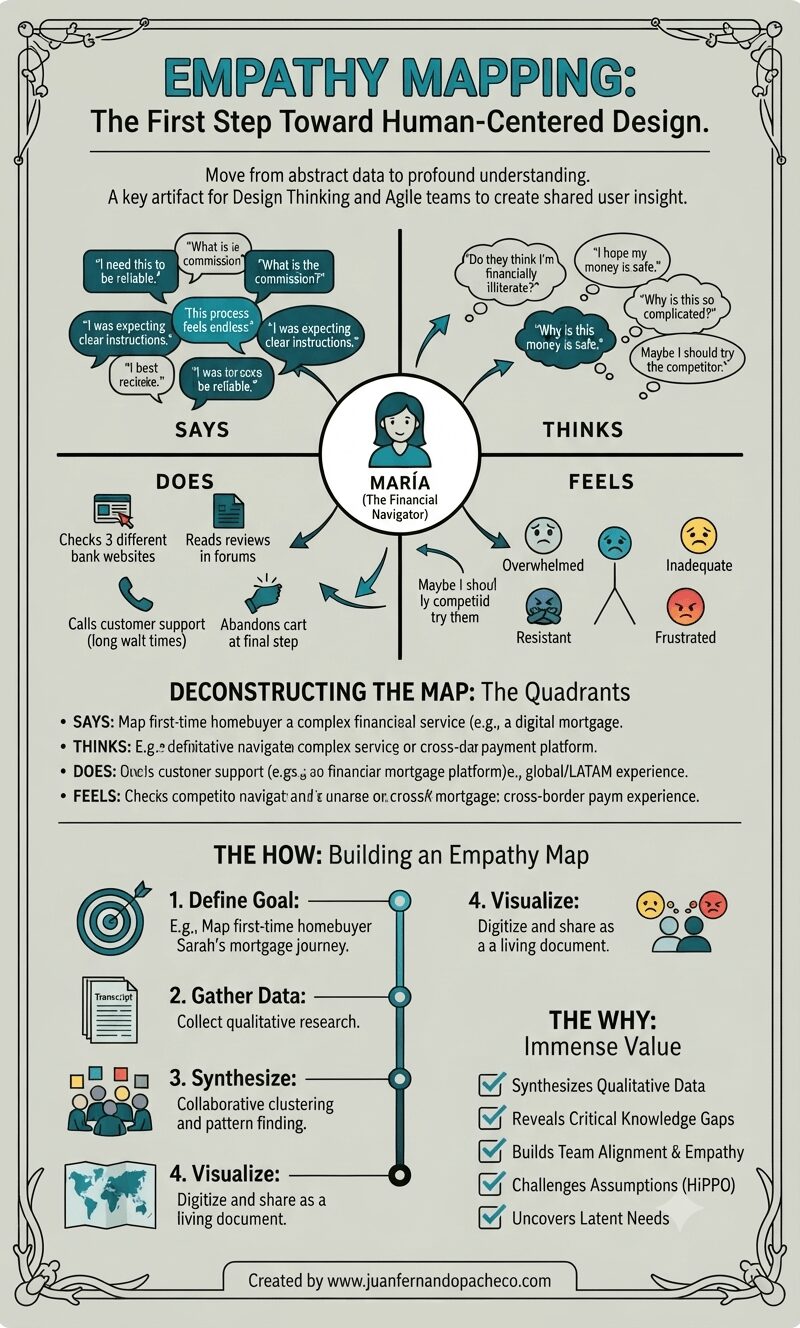
A vertically-oriented infographic titled "EMPATHY MAPPING: The First Step Toward Human-Centered Design," set against a light sage-green background with a decorative border. The center features a complete empathy map for a persona named "MARÍA (The Financial Navigator)," with radiating arrows connecting her icon to four detailed quadrants: "SAYS" (with quotes like "I need this to be reliable," "What is the commission?"), "THINKS" (internal thoughts like "Do they think I'm financially illiterate?"), "DOES" (actions like "Checks 3 different bank websites"), and "FEELS" (emotions with emojis like "Overwhelmed," "Inadequate"). Below the map, sections deconstruct the quadrants and outline "THE HOW: Building an Empathy Map" (Define, Gather, Synthesize, Visualize steps) and "THE WHY: Immense Value" (a checklist of benefits). The bottom includes the attribution: "Created by www.juanfernandopacheco.com."

An empathy map is more than just a diagram on a wall. It is a practice, a mindset, and a commitment to seeing the world through someone else’s eyes. It transforms the abstract “user” into a human with hopes, frustrations, and a complex inner world.

By systematically capturing what our users Say, Think, Do, and Feel, we move beyond building mere features.
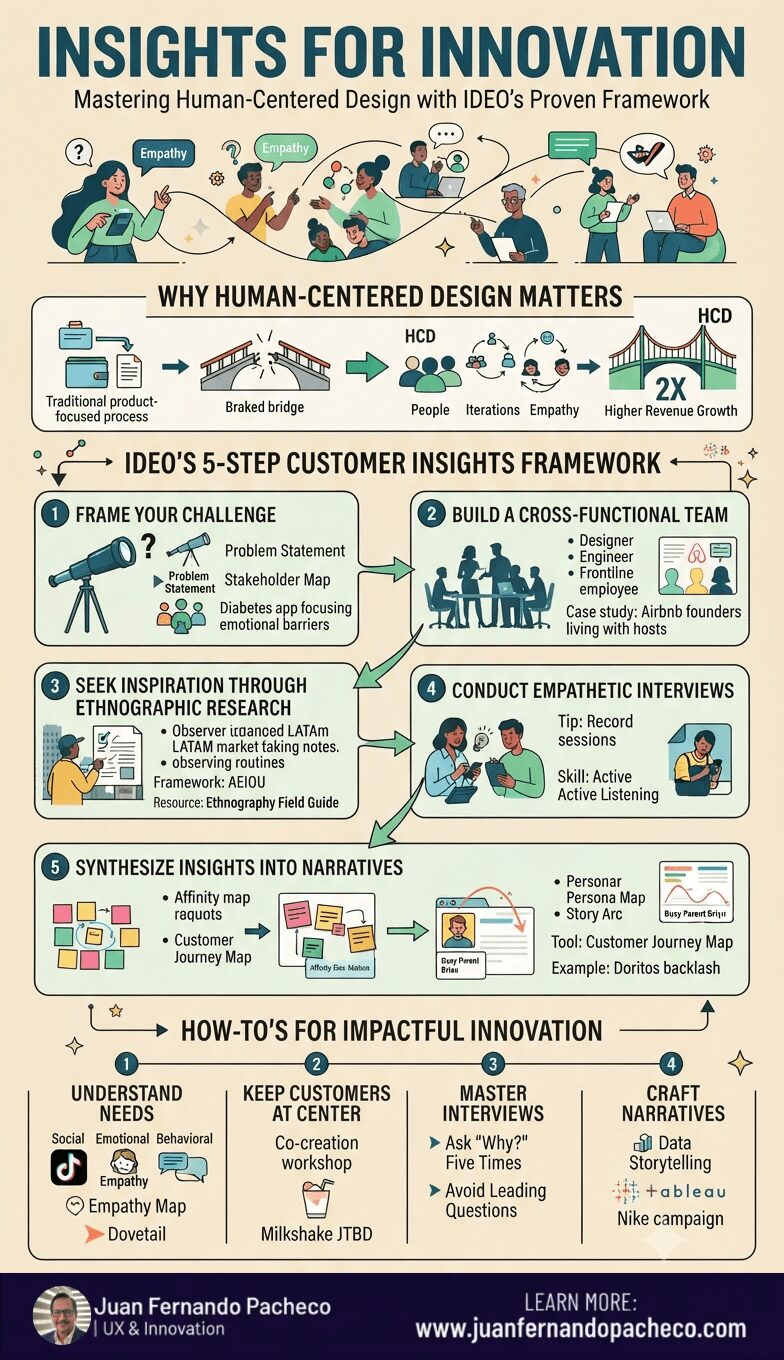
An infographic titled "Insights for Innovation: Mastering Human-Centered Design with IDEO’s Proven Framework" in a vertical format. It features a five-step visual guide on a light beige background, using illustrations and icons to explain the design thinking process. The steps include: 1. Frame Your Challenge, 2. Build a Cross-Functional Team, 3. Seek Inspiration Through Ethnographic Research, 4. Conduct Empathetic Interviews, and 5. Synthesize Insights into Narratives. Below the framework, a "How-To's for Impactful Innovation" section outlines four additional pillars. The bottom of the image displays the URL "www.juanfernandopacheco.com".

Insights for Innovation isn’t a checklist—it’s a mindset. By grounding every decision in empathy, curiosity, and storytelling, you’ll build products that don’t just solve problems, but enrich lives. Ready to start? Dive deeper with IDEO’s Design Thinking Resources and remember: The next breakthrough lies in the stories your customers haven’t told you yet.

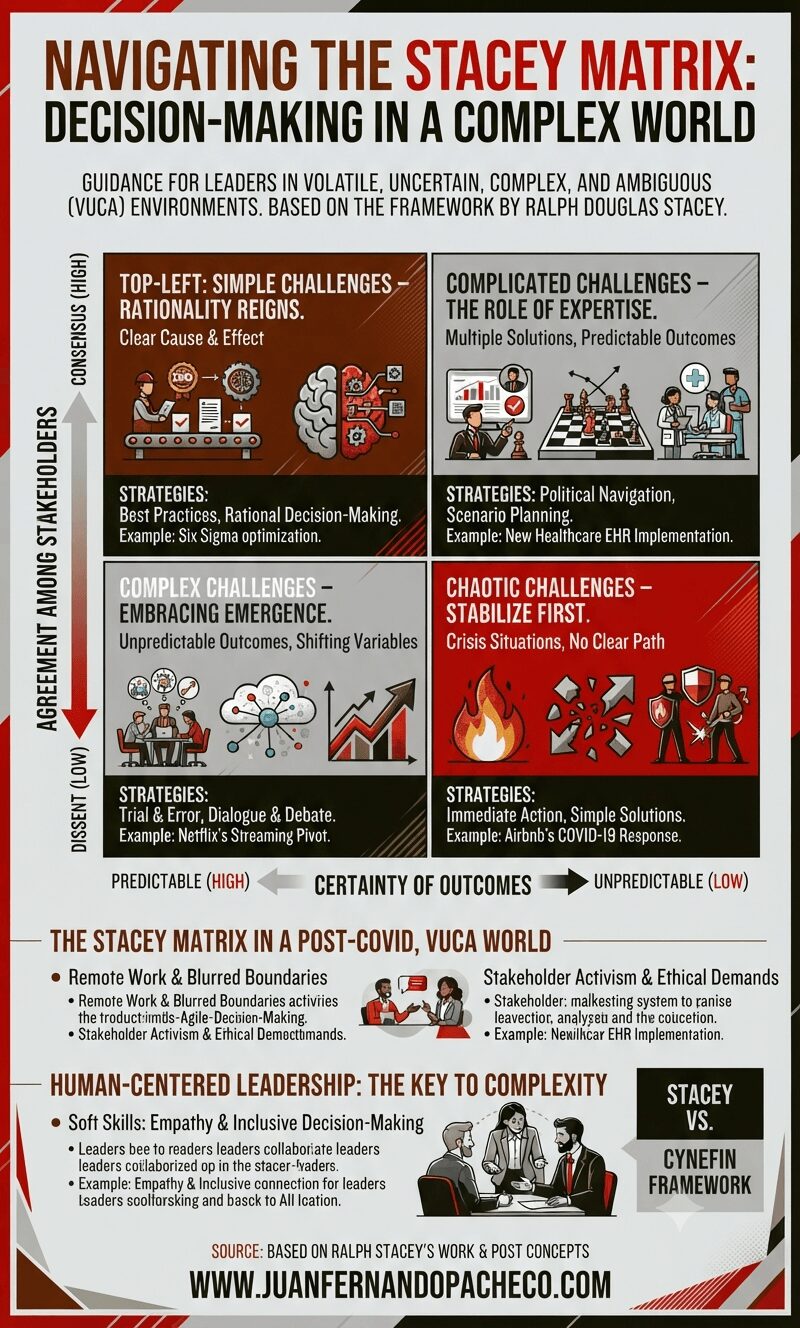
An infographic titled 'Navigating the Stacey Matrix: Decision-Making in a Complex World' set against a light grey background with a dark red, grey, and olive color scheme. It features a large matrix with two axes: 'Agreement Among Stakeholders' (vertical) and 'Certainty of Outcomes' (horizontal). The matrix is divided into four quadrants with icons, characteristics, strategies, and examples: Top-Left 'Simple Challenges' (rationality), Top-Right 'Complicated Challenges' (expertise), Bottom-Left 'Complex Challenges' (emergence), and Bottom-Right 'Chaotic Challenges' (stabilize first). Below the matrix are sections on 'The Stacey Matrix in a Post-COVID, VUCA World' and 'Human-Centered Leadership: The Key to Complexity' with small illustrations of people. The footer includes the URL 'WWW.JUANFERNANDOPACHECO.COM'.

The Stacey Matrix is not just a tool—it’s a mindset shift. In a world where 73% of leaders cite complexity as their top challenge (per Gartner), mastering this framework requires courage to embrace ambiguity and humility to learn from failure.