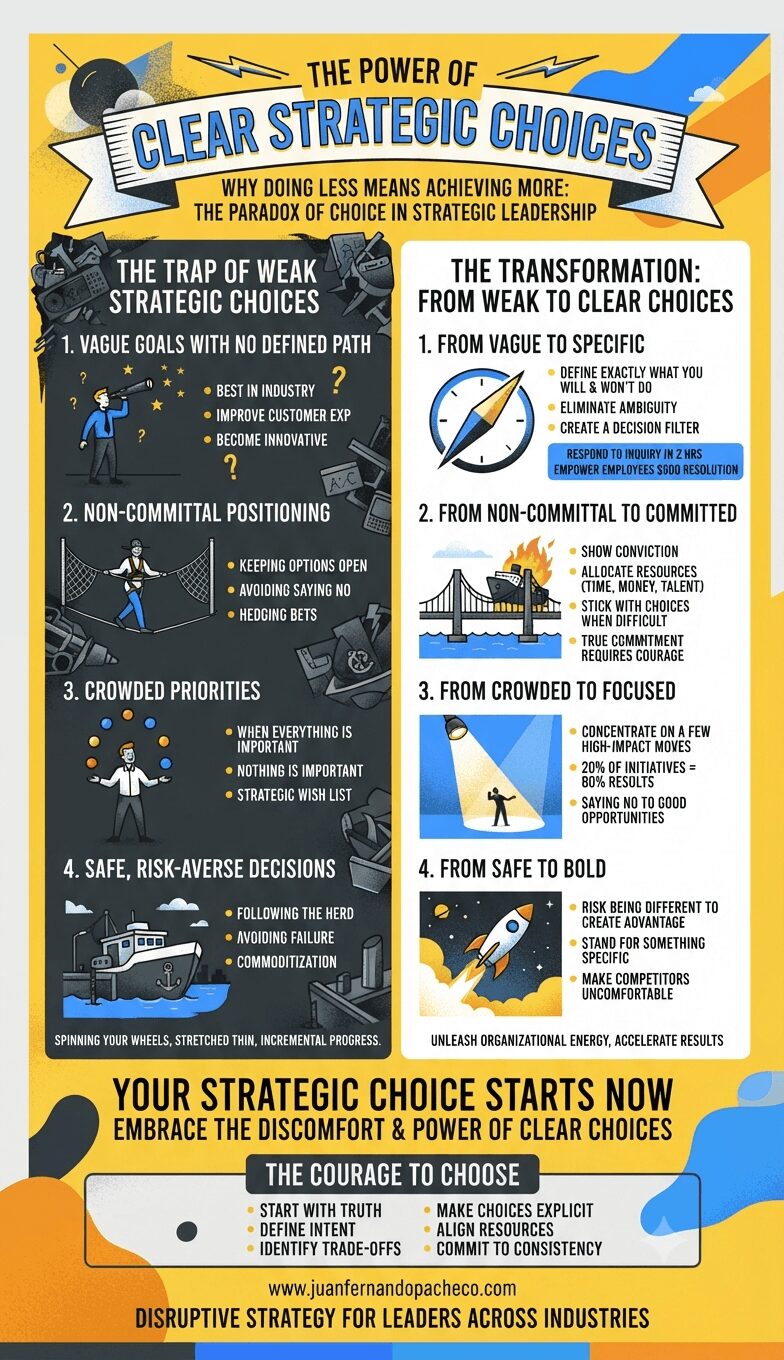
The journey from strategic confusion to clarity requires four essential steps: defining your vision, setting clear priorities, making necessary trade-offs, and committing fully to your choices.
Tag: Innovation
Innovation is the practical implementation of ideas that result in the introduction of new goods or services or improvement in offering goods or services.
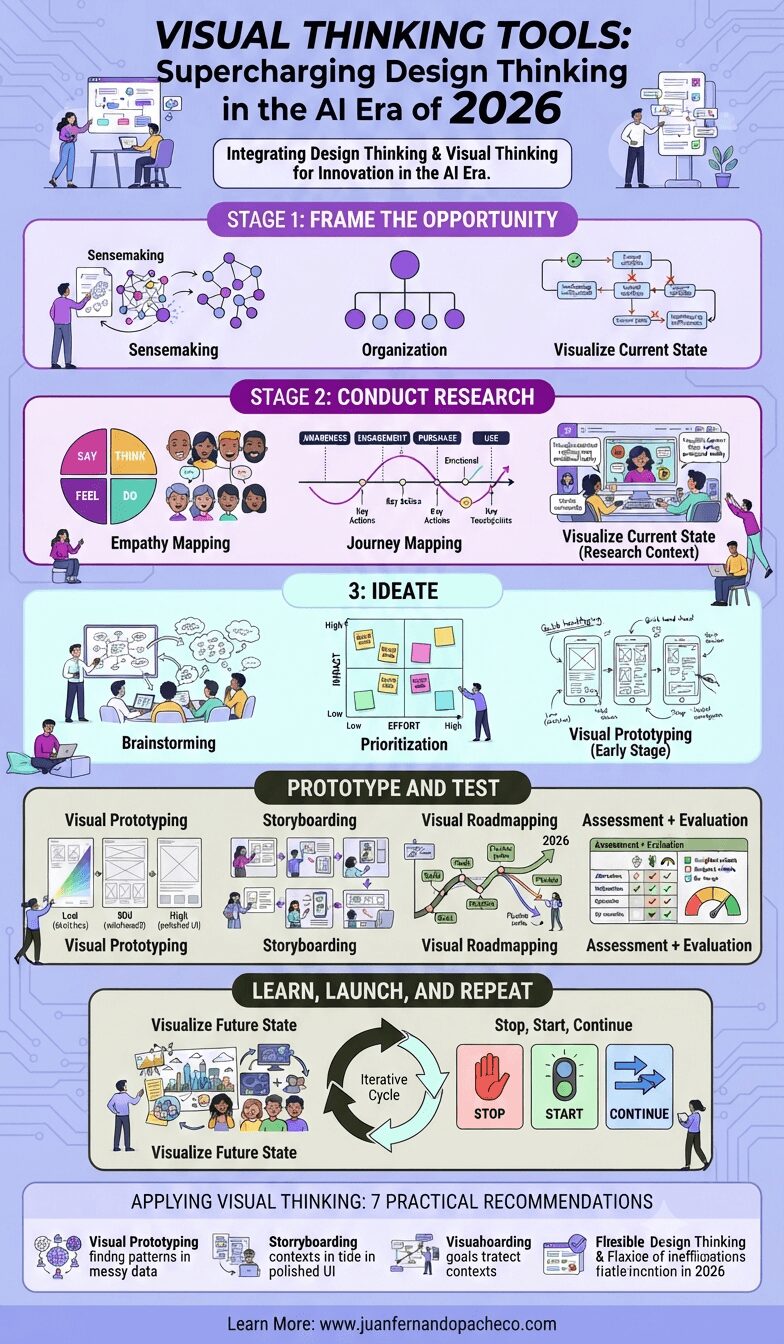
The design thinking methodology with visual thinking tools I’ve outlined here represents more than just a process—it’s a mindset shift toward collaborative, iterative, human-centered innovation. In 2026, where complexity is the norm and user expectations continue to rise, this approach isn’t optional; it’s essential.
Whether you’re a seasoned designer, a business leader driving digital transformation, or an entrepreneur launching your first product, these visual thinking tools can elevate your work. They’ll help you see problems more clearly, generate better solutions, and create experiences that truly resonate with users.
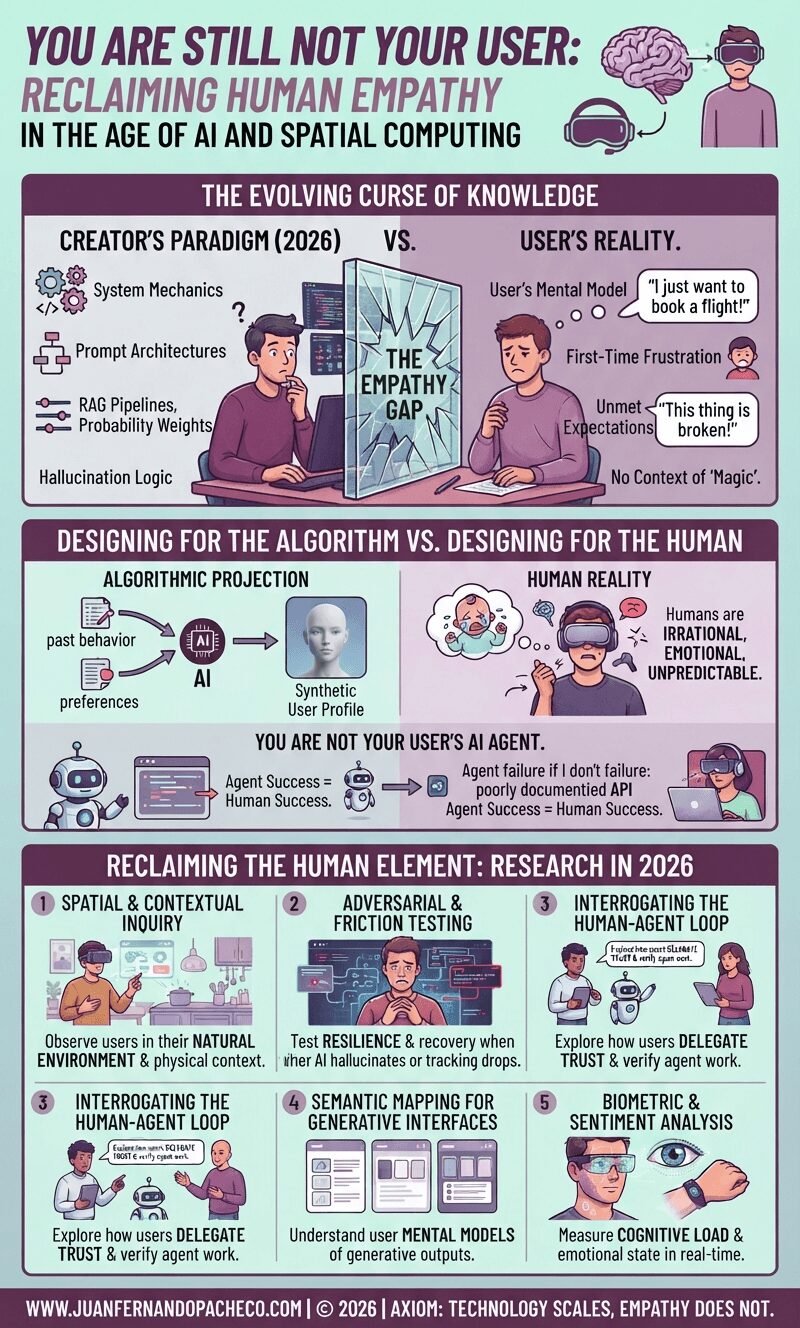
Fifteen years after the classic UX axiom was coined, the tools of our trade have evolved from static screens to generative interfaces and spatial computing. Yet, the fundamental rule remains: you are not your user. In 2026, as we navigate the complexities of AI agents and synthetic data, remembering this has never been more critical—or more challenging
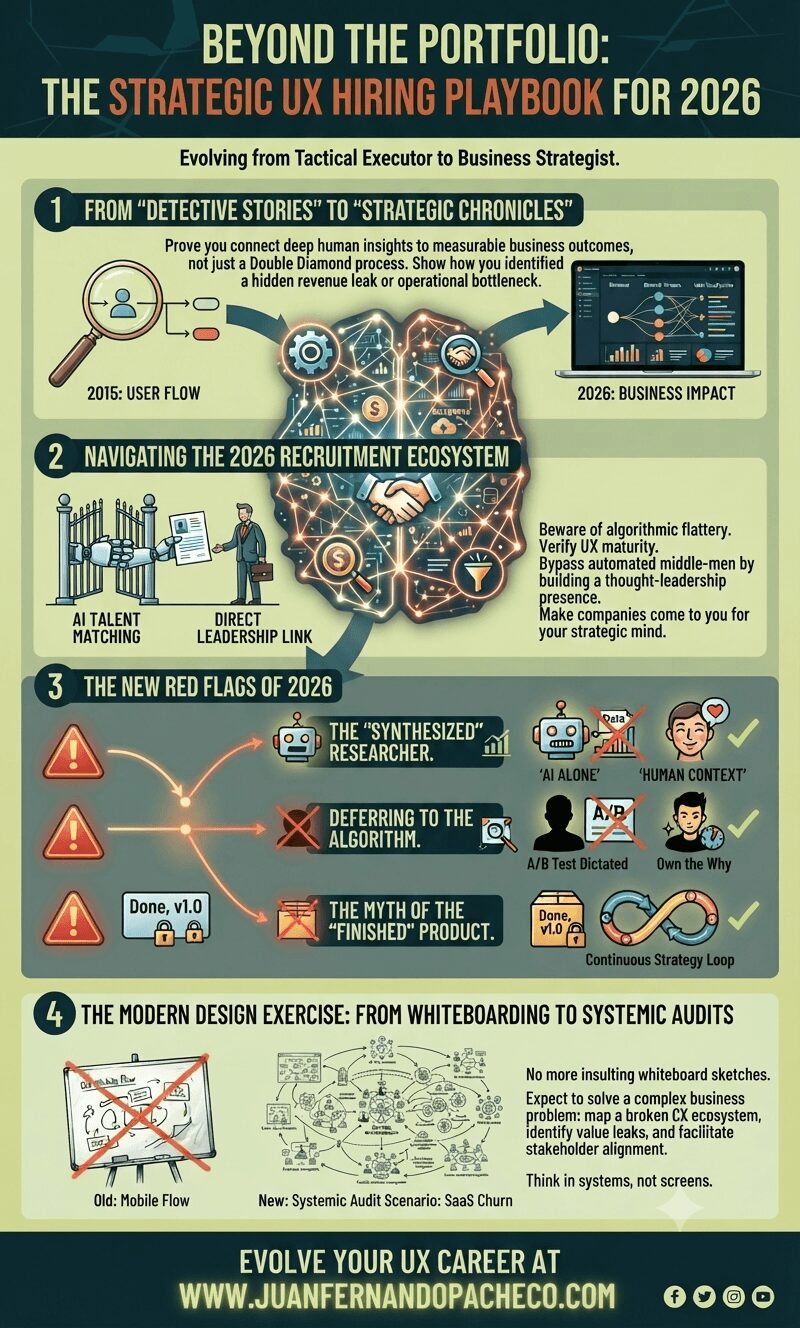
UX is about understanding humans, navigating complexity, and aligning those human needs with business viability.
In 2026, the bar for entry is higher because the tactical work is automated. But the ceiling for strategic impact is limitless.
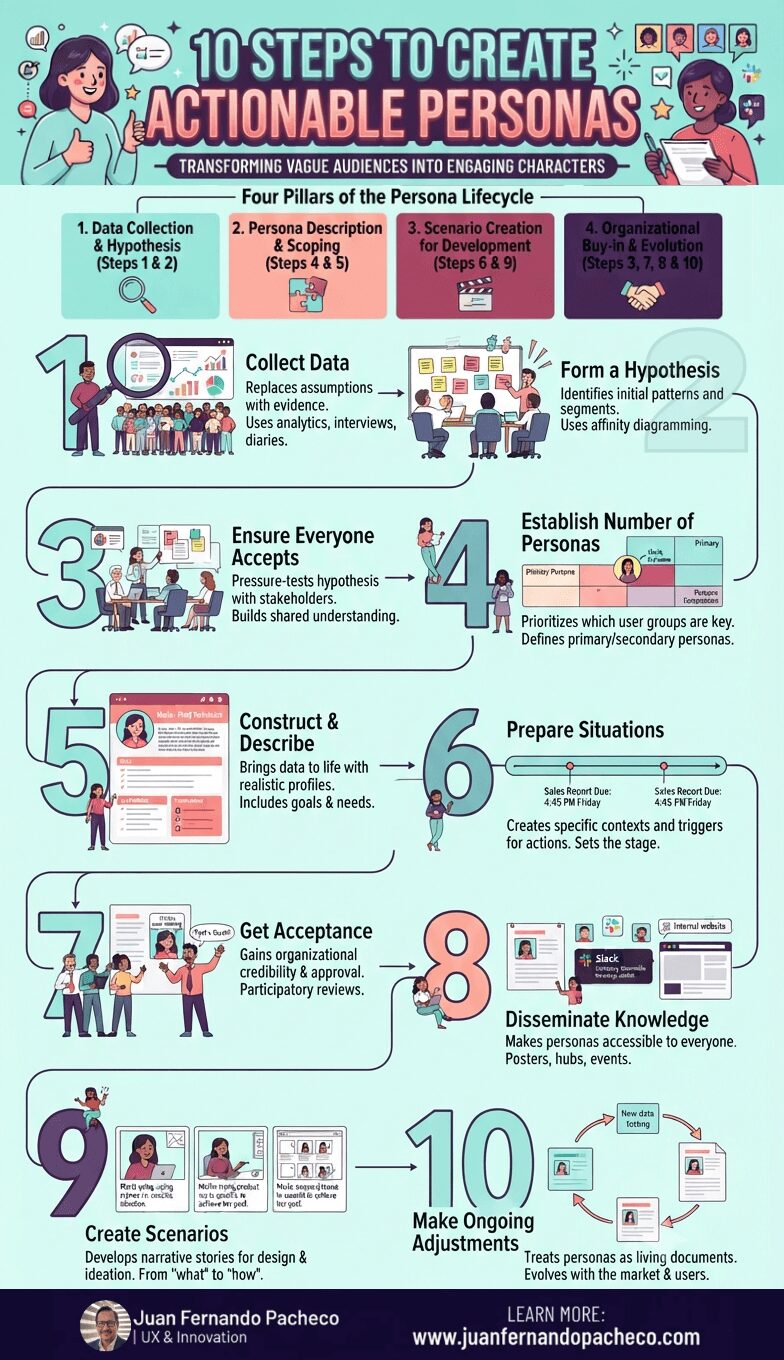
Creating engaging personas is not a one-week exercise to be filed away and forgotten. It is a strategic commitment to human-centered design. This 10-step process provides a robust framework, but its success hinges on a cultural shift within your organization—a shift from building for “the user” to designing for “Maria,” “John,” and “Akira.”
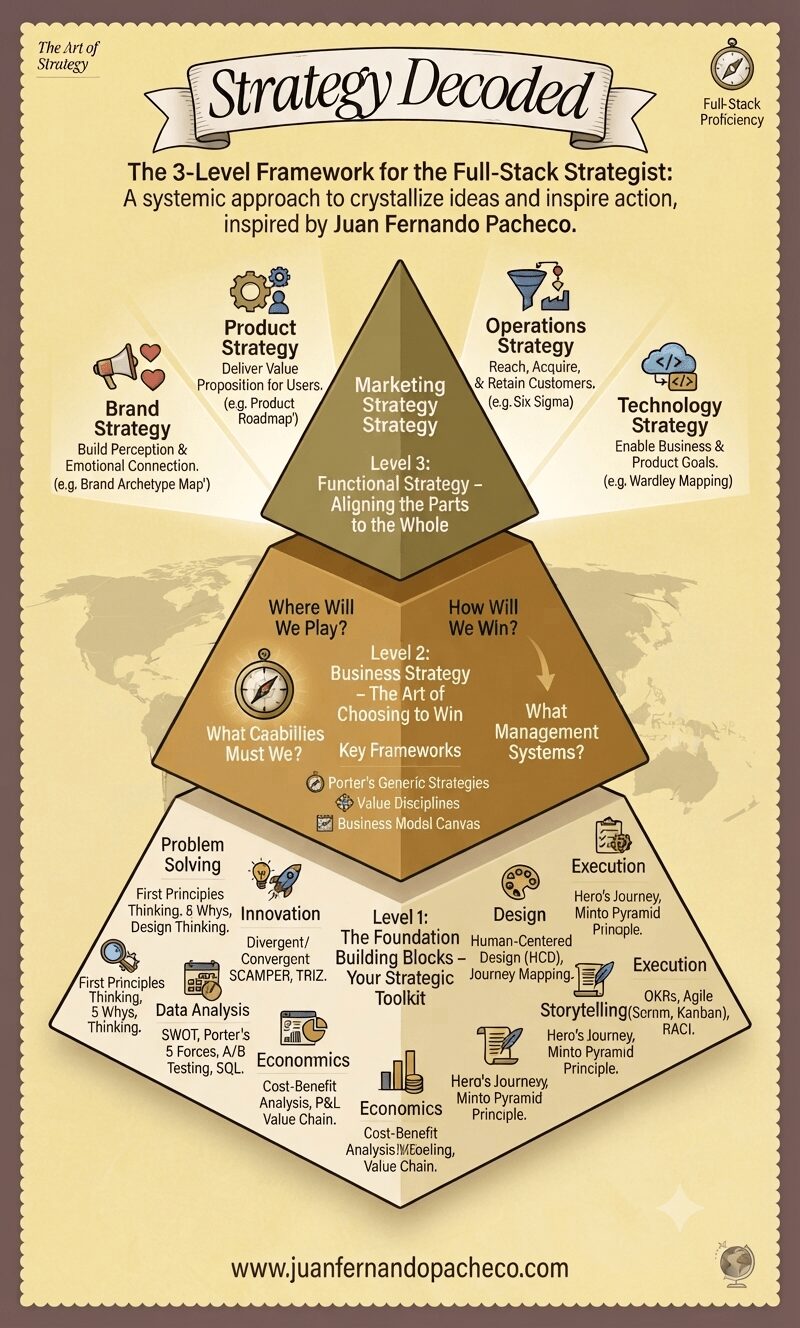
Becoming a full-stack strategist is a journey.
Start by auditing your proficiency in the seven building blocks. Where are you strong? Where do you need improvement?
Then, practice articulating the business strategy for your team or company—even if it’s not your official job.
Finally, constantly scrutinize your functional work (whether in design, tech, product, or marketing) and ask: “Does this truly ladder up to how we’ve chosen to win?”
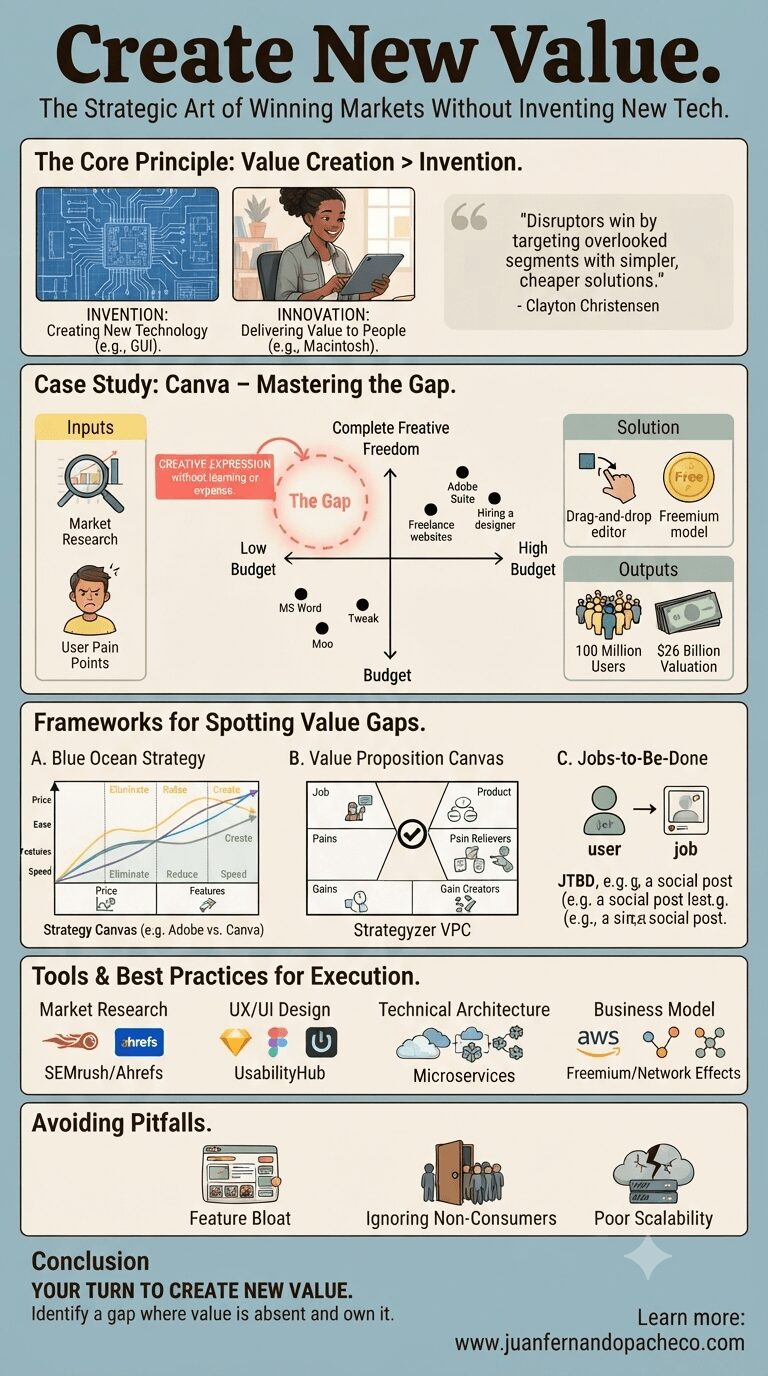
Visionaries spot gaps in the market—unmet needs others overlook—and craft solutions so elegantly aligned with those gaps that they carve out entirely new categories.
Let’s dissect this with surgical precision, using real-world examples, battle-tested frameworks, and actionable tools. By the end, you’ll see how to identify and own your “white space” in any market.
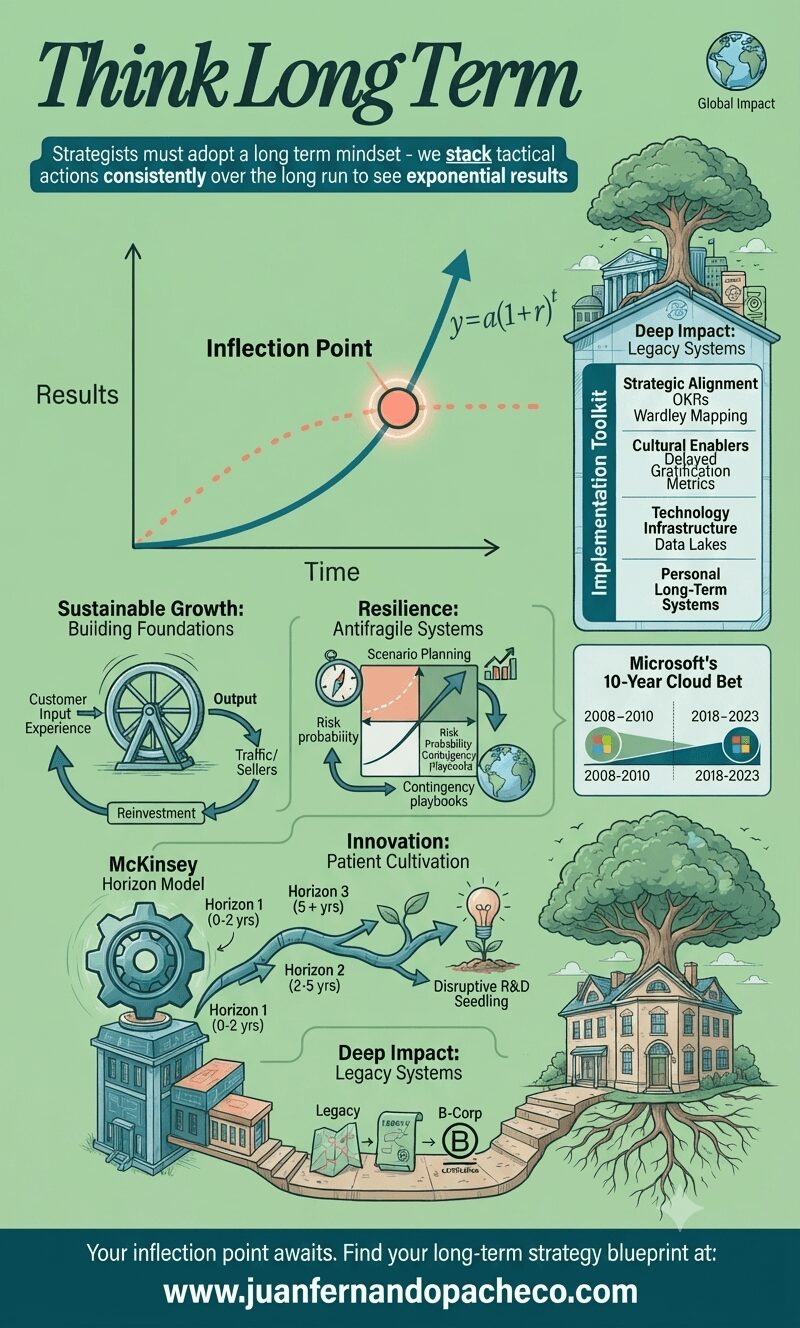
In the 1980s, IBM dominated mainframe computers while Microsoft focused on the embryonic PC market—a classic long-term gamble. Bill Gates famously said,
“We always overestimate the change that will occur in two years and underestimate the change that will occur in ten.”
This encapsulates the power of long-term thinking: the deliberate prioritization of future exponential gains over immediate rewards.
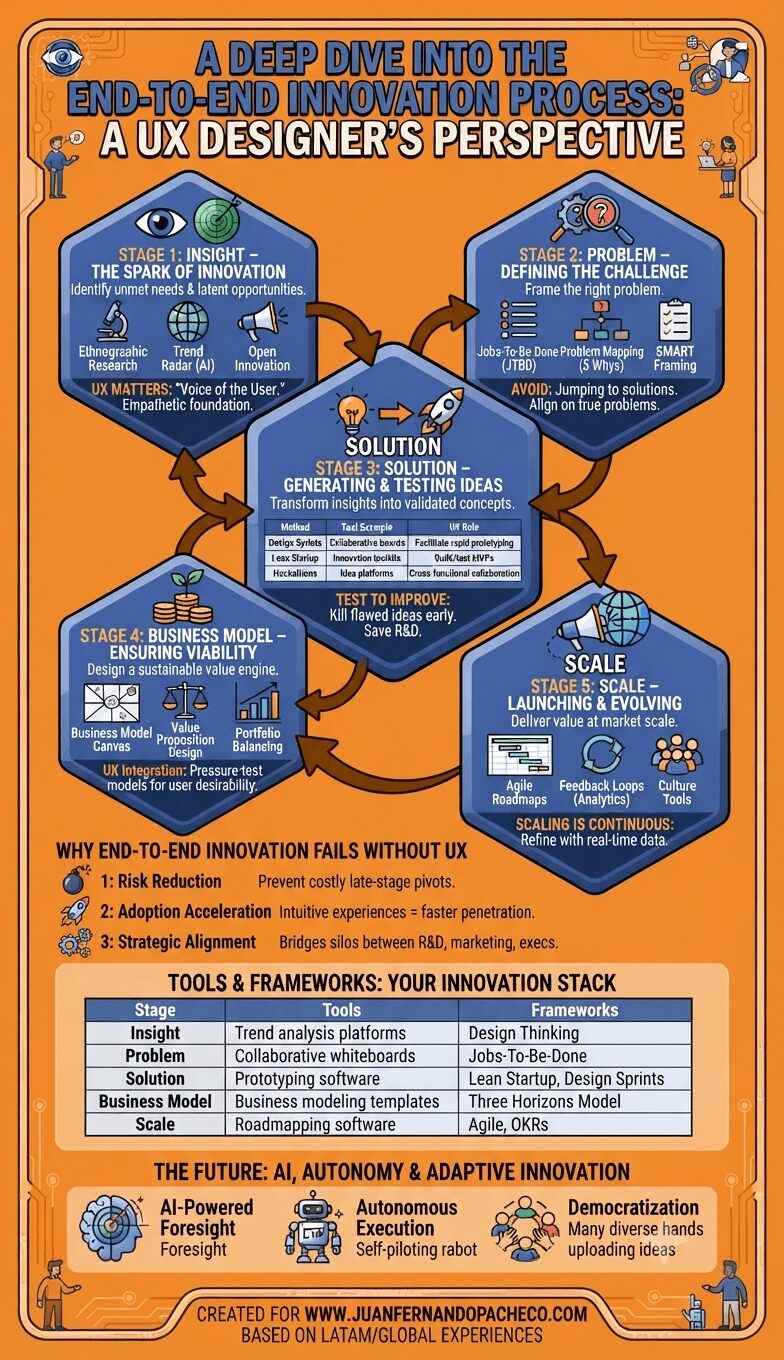
As a UX professional, I’ve witnessed how human-centered design transforms scattered ideas into market-shaping solutions. This process isn’t linear; it’s a dynamic ecosystem where strategy, creativity, and execution intertwine.
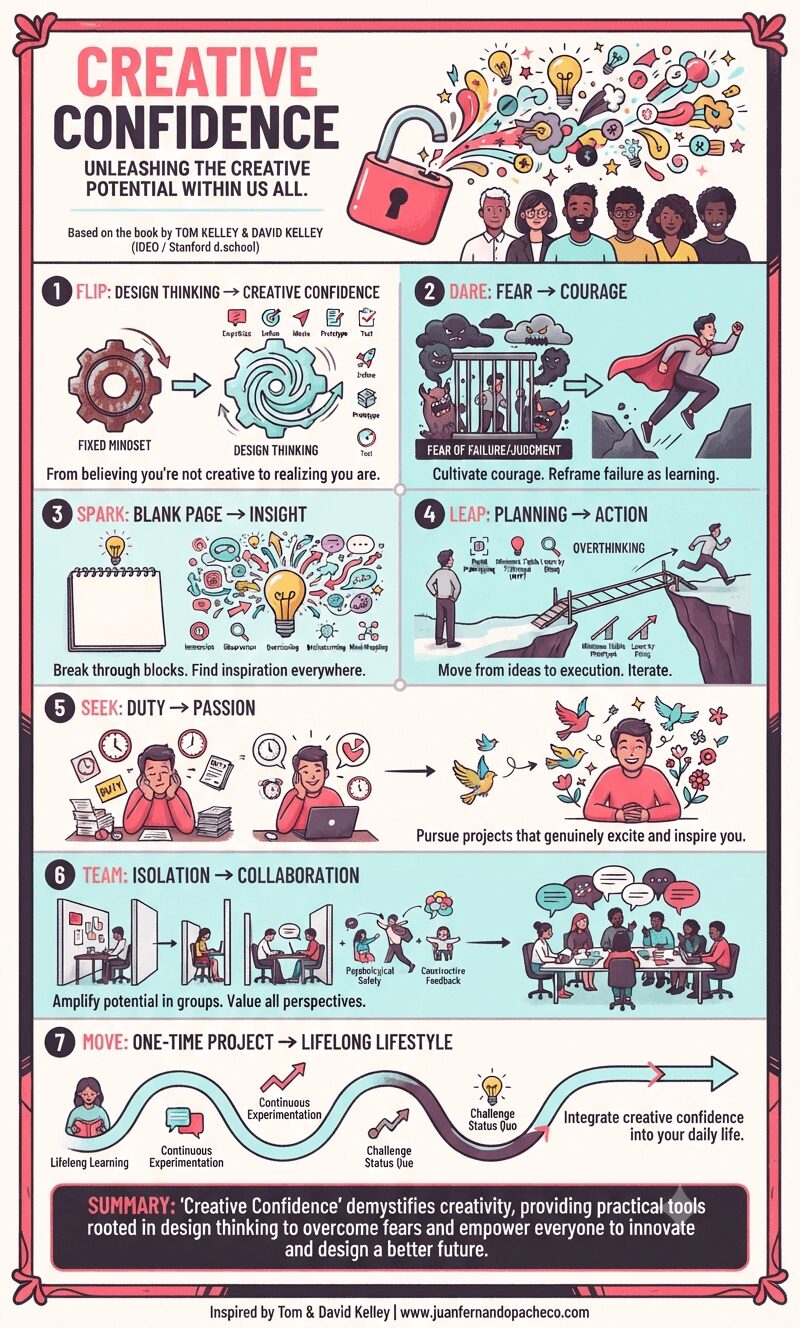
Creative Confidence is a profoundly inspiring and practical book that demystifies creativity and makes it accessible to everyone. Tom and David Kelley skillfully blend personal anecdotes, insightful observations, and concrete methodologies (rooted in design thinking) to illustrate how creative potential can be unlocked and harnessed.