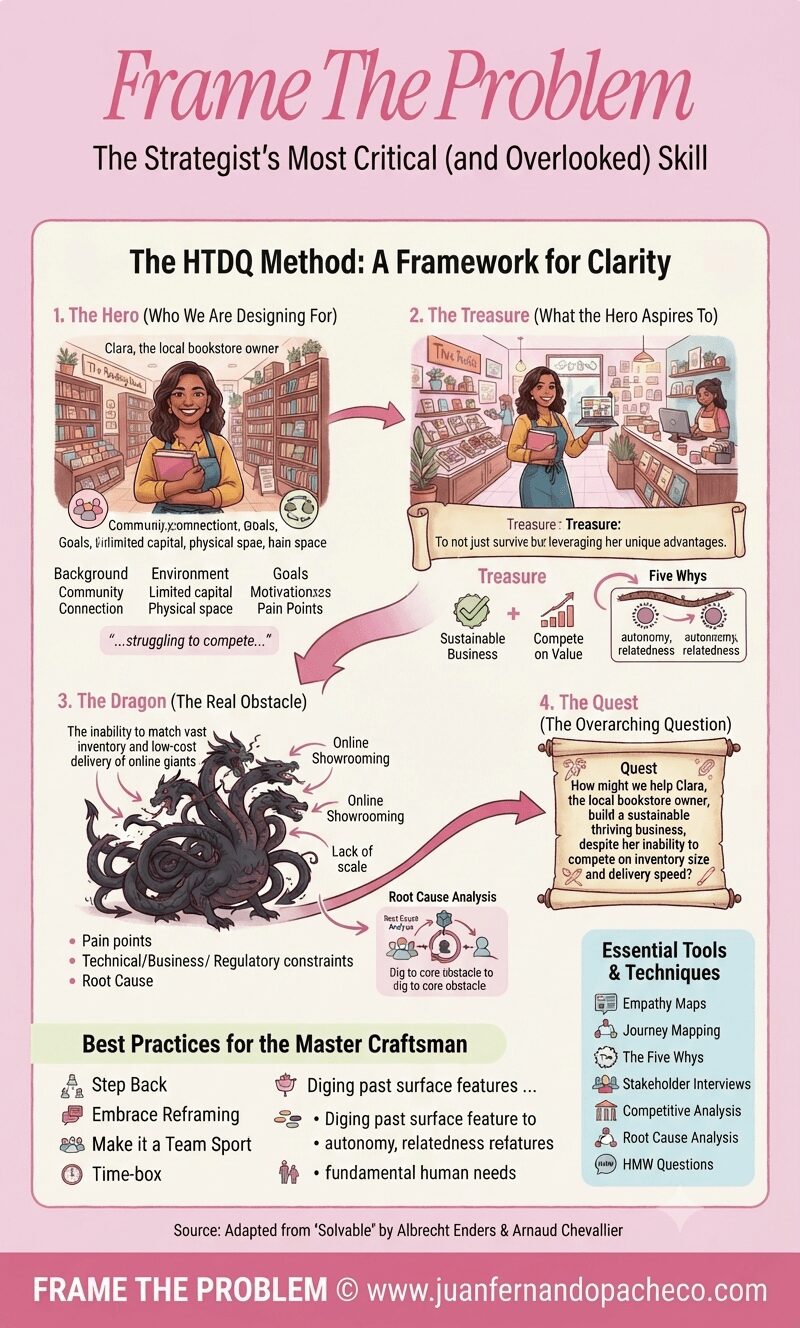
An infographic titled "Frame The Problem" illustrating the HTDQ storytelling method for strategic clarity. It uses the example of Clara, a local bookstore owner (Hero), who needs a sustainable business (Treasure) despite competition from online giants (Dragon), leading to the Quest question: "How might we help Clara...build a sustainable thriving business, despite her inability to compete on inventory size and delivery speed?" The infographic includes sections for best practices and essential tools, with attribution to www.juanfernandopacheco.com.

Framing the problem is the highest-leverage activity in any strategic endeavor. It is the art of asking the right question before desperately searching for answers. The HTDQ method provides a memorable, robust, and human-centered framework to master this art.

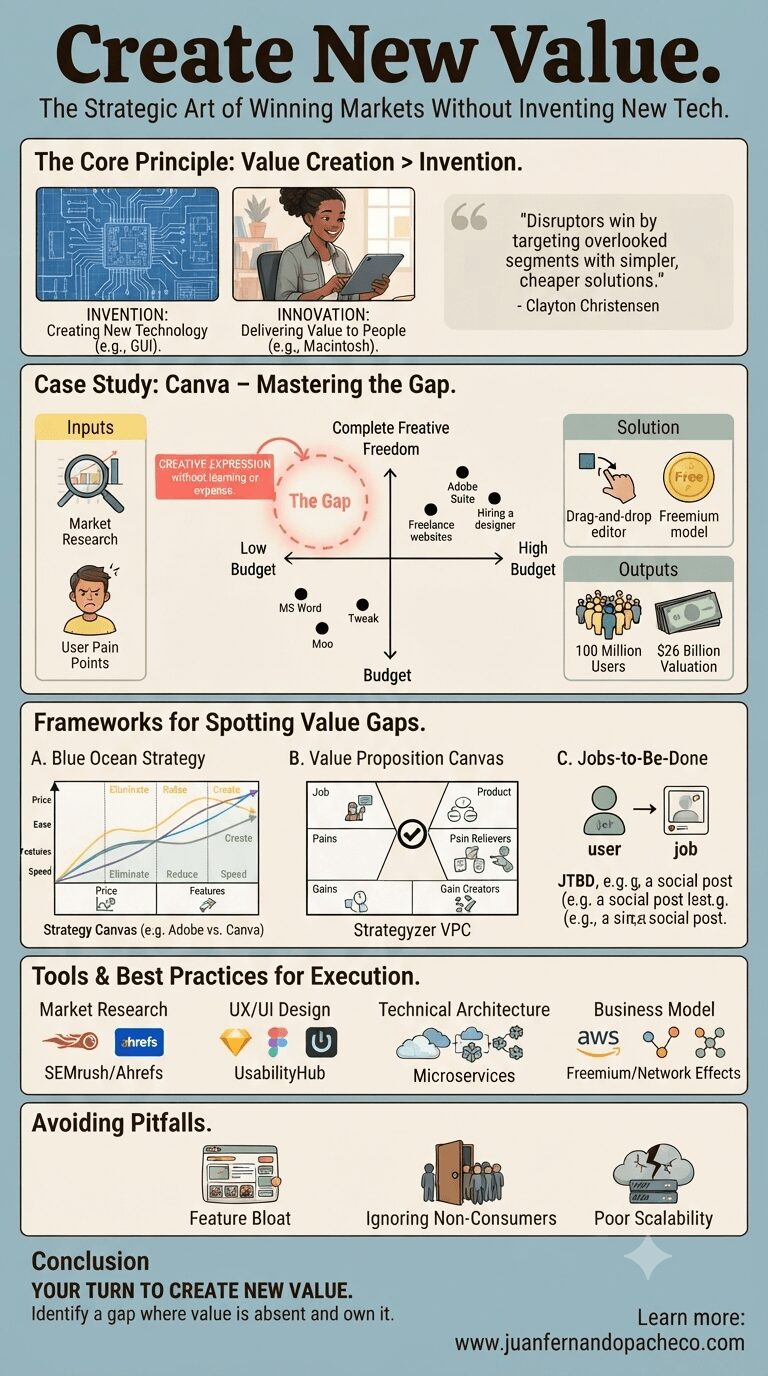
A comprehensive business infographic titled "Create New Value. The Strategic Art of Winning Markets Without Inventing New Tech." The image is divided into stacked sections: "The Core Principle: Value Creation > Invention," a detailed "Case Study: Canva – Mastering the Gap" (including a 2x2 positioning map, inputs, outputs, and UX insights), "Frameworks for Spotting Value Gaps" (Blue Ocean Strategy, Value Proposition Canvas, Jobs-to-Be-Done), "Tools & Best Practices for Execution" (Market Research, UX/UI Design, Technical Architecture, Business Model), and "Avoiding Pitfalls" (Feature Bloat, Ignoring Non-Consumers, Poor Scalability). The infographic uses diagrams, charts, and icons, concluding with a call to action and the URL "www.juanfernandopacheco.com."

Visionaries spot gaps in the market—unmet needs others overlook—and craft solutions so elegantly aligned with those gaps that they carve out entirely new categories.

Let’s dissect this with surgical precision, using real-world examples, battle-tested frameworks, and actionable tools. By the end, you’ll see how to identify and own your “white space” in any market.
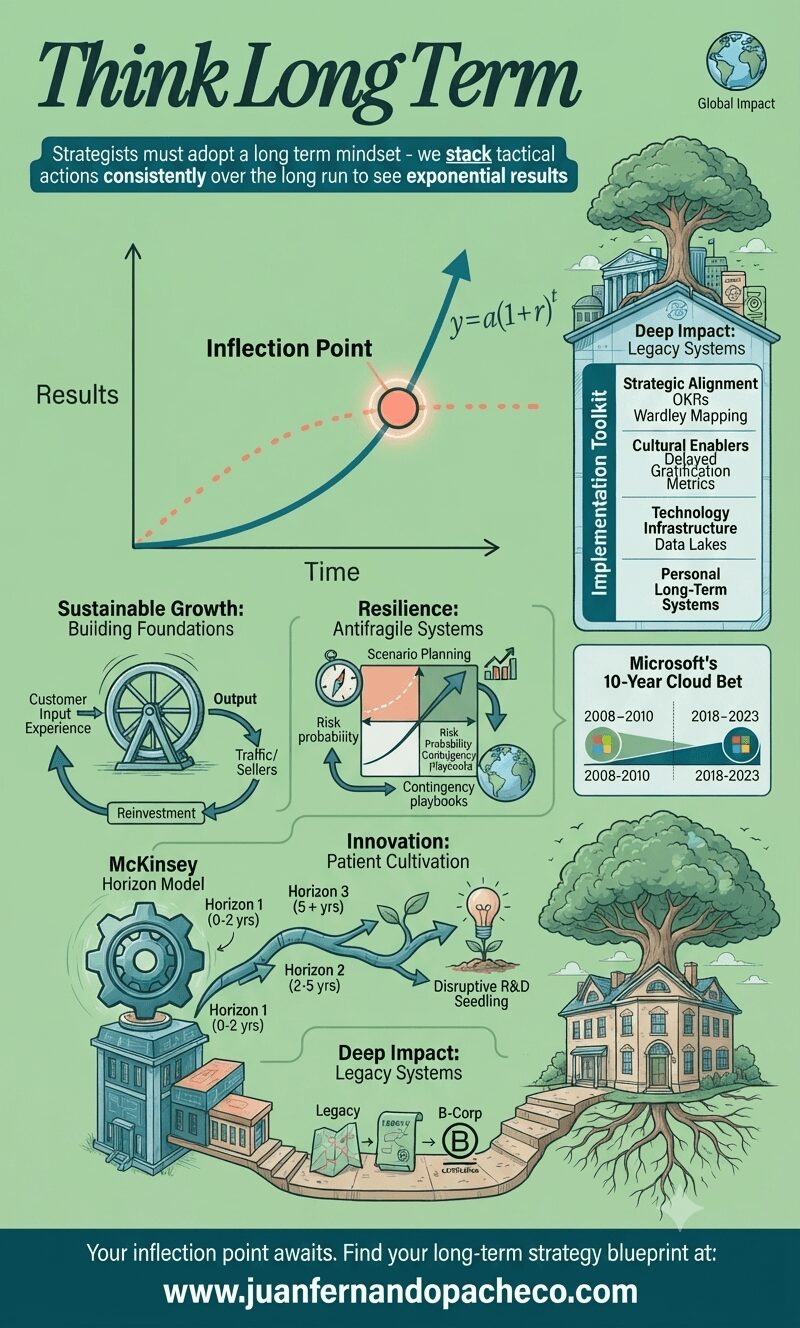
An intricate infographic titled 'Think Long Term,' illustrating a strategic blueprint for exponential growth based on the provided post. The central element is a graph showing an exponential teal curve labeled 'Long Term' overtaking a plateauing coral dotted line ('Short Term') at a glowing 'Inflection Point' (y=a(1+r)t). Below the graph, the strategy is broken into four detailed pillars: Sustainable Growth: Building Foundations, with a flywheel model (Customer Input → Output → Reinvestment). Resilience: Antifragile Systems, featuring a scenario planning matrix and contingency playbooks. Innovation: Patient Cultivation, depicted as a branching path (Horizon Model) leading to a 'Disruptive R&D Seedling.' Deep Impact: Legacy Systems, shown as a pathway from an initial structure to a mature B-Corp house with deep roots. A sidebar lists an 'Implementation Toolkit' (OKRs, Wardley Mapping, Data Lakes). A case study highlights 'Microsoft's 10-Year Cloud Bet.' The infographic ends with the footer text: 'Your inflection point awaits. Find your long-term strategy blueprint at: www.juanfernandopacheco.com.' The overall color scheme is a blend of soft green (#9ece9a), teal, and warm coral.

In the 1980s, IBM dominated mainframe computers while Microsoft focused on the embryonic PC market—a classic long-term gamble. Bill Gates famously said, 

“We always overestimate the change that will occur in two years and underestimate the change that will occur in ten.” 

This encapsulates the power of long-term thinking: the deliberate prioritization of future exponential gains over immediate rewards.
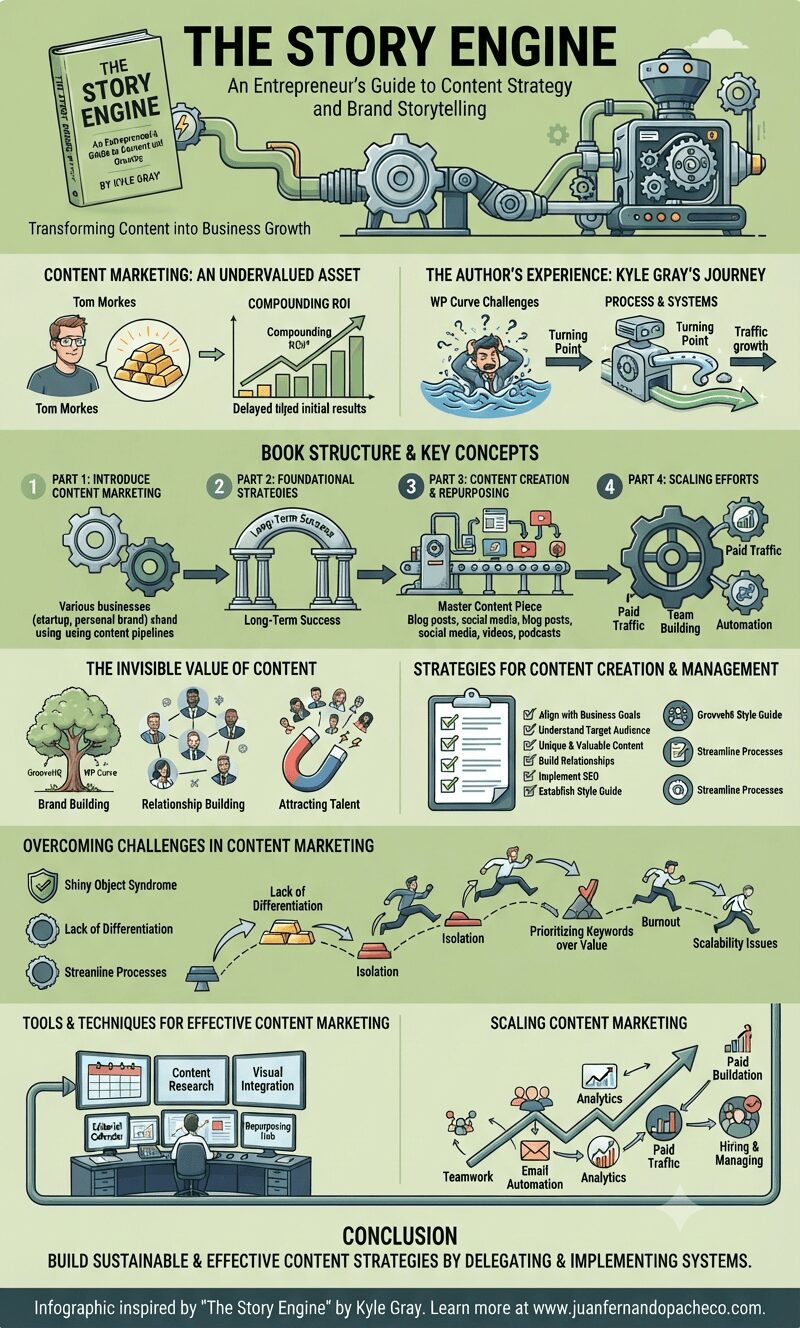
A comprehensive infographic illustrating the concepts of "The Story Engine" by Kyle Gray. It uses a visual metaphor of a machine and gears to show the journey from content challenges to a scalable marketing system, covering strategy, creation, invisible value, and overcoming common pitfalls.

“The Story Engine” provides a comprehensive guide to content marketing, focusing on strategy, efficiency, and scalability. It combines practical advice with insights on the broader value of content marketing, aiming to help entrepreneurs build sustainable and effective content strategies.
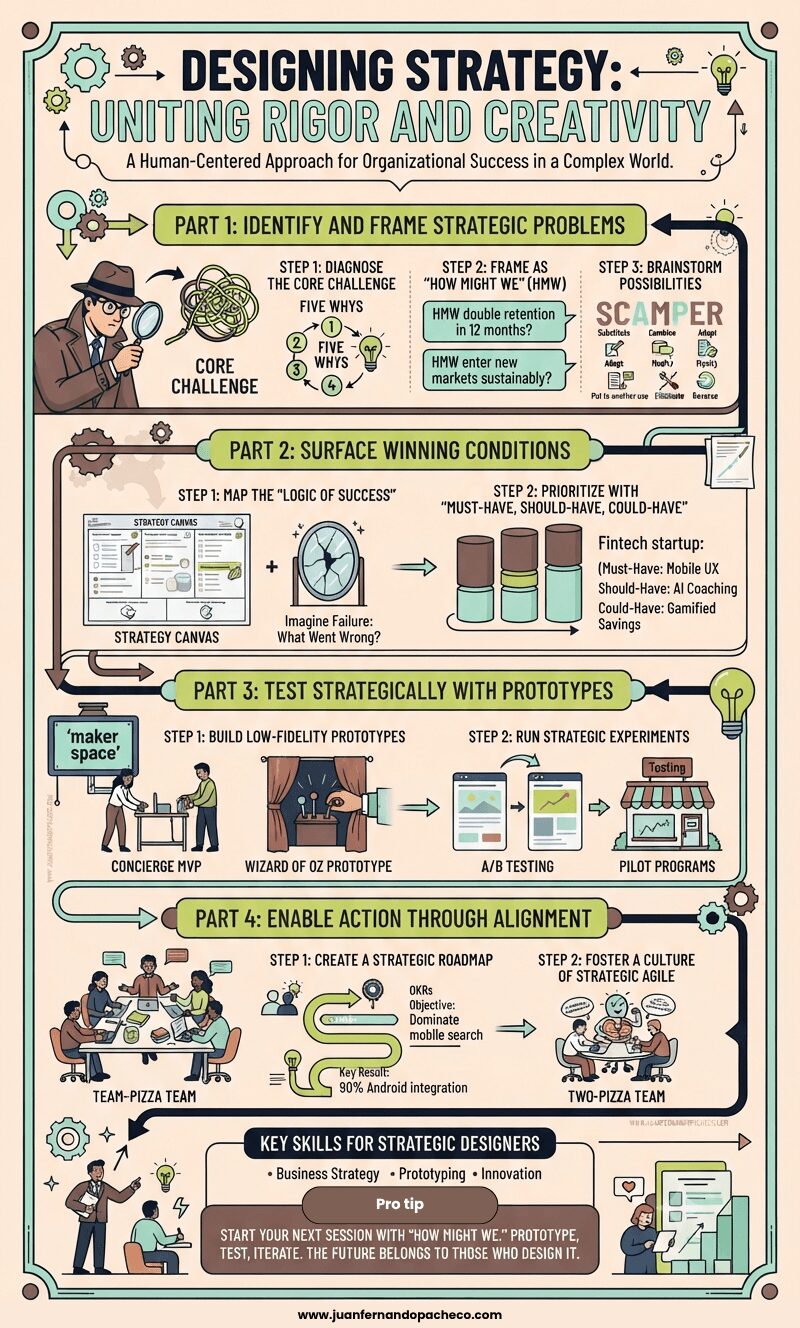
A comprehensive vertical infographic titled "Designing Strategy: Uniting Rigor and Creativity" set against a light peach background with a dark green border. It presents a four-part framework for organizational success using illustrations, icons, and text. Part 1 shows identifying problems with a detective and the Five Whys. Part 2 covers winning conditions using a Strategy Canvas and prioritization matrix. Part 3 illustrates low-fidelity prototypes and experiments like A/B testing. Part 4 details alignment through roadmaps and agile teams. The bottom section lists key skills and a call to action, with references to www.juanfernandopacheco.com.

Designing strategy isn’t a one-time event—it’s a cycle of learning, adapting, and evolving. By blending analytical tools with creative methods, leaders can build strategies resilient enough for today’s volatility and visionary enough for tomorrow’s opportunities.

Start your next strategic session with a “How Might We” question. Then prototype, test, and iterate. The future belongs to those who design it.
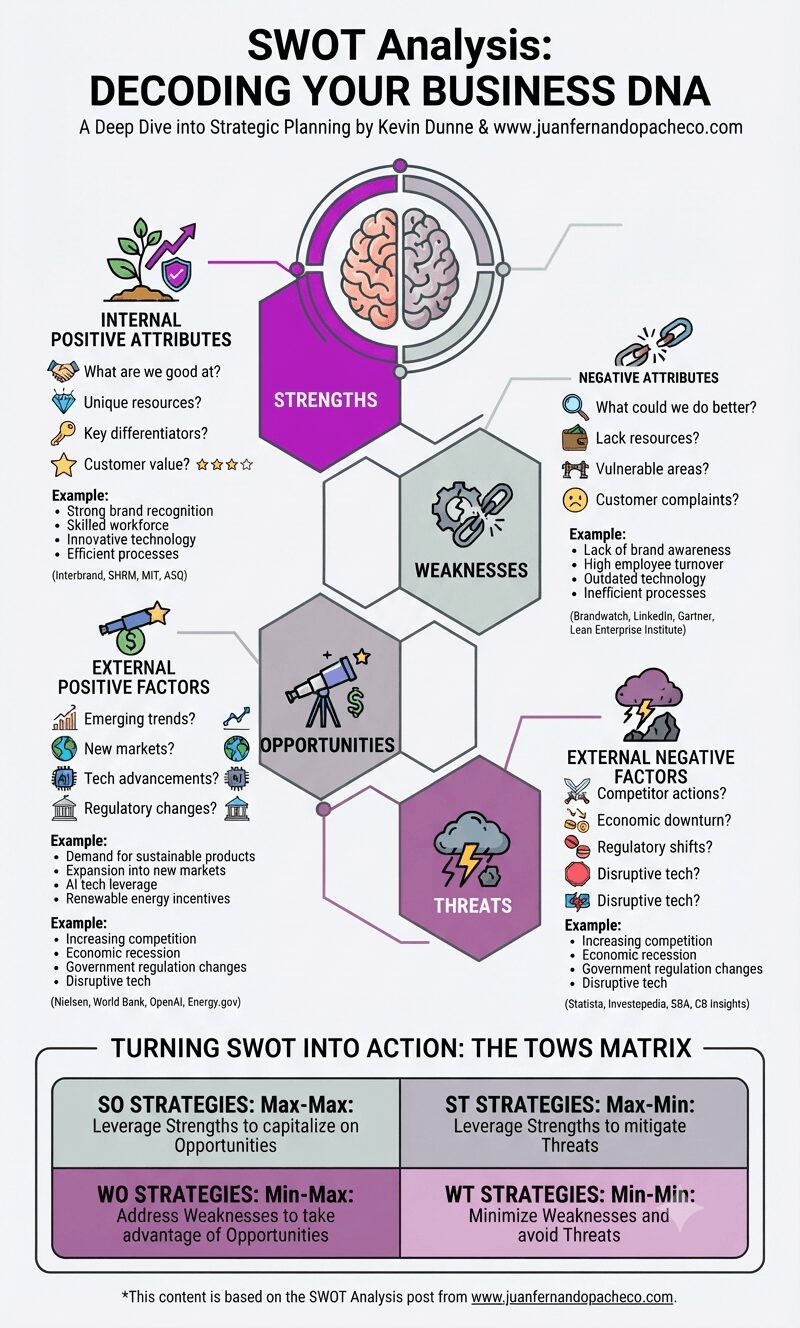
A vertical infographic titled "SWOT Analysis: Decoding Your Business DNA" featuring a central diagram of a brain split into internal (Strengths, Weaknesses) and external (Opportunities, Threats) factors. The top left shows 'Strengths' (plant, shield, gear) with examples like strong brand and skilled workforce. The top right shows 'Weaknesses' (broken gear, chain) with examples like high turnover and outdated tech. The bottom left shows 'Opportunities' (telescope, rising star) with examples like new markets and AI. The bottom right shows 'Threats' (storm cloud, lightning) with examples like recession and competition. A large bottom section outlines "The TOWS Matrix" with SO, ST, WO, and WT strategies. The design uses a modern palette of teals, lavender, and magentas on a light gray background.

A SWOT analysis is a powerful tool for understanding your organization’s current position and charting a course for future success. By systematically analyzing your strengths, weaknesses, opportunities, and threats, you can develop targeted strategies that leverage your competitive advantages and mitigate potential risks.
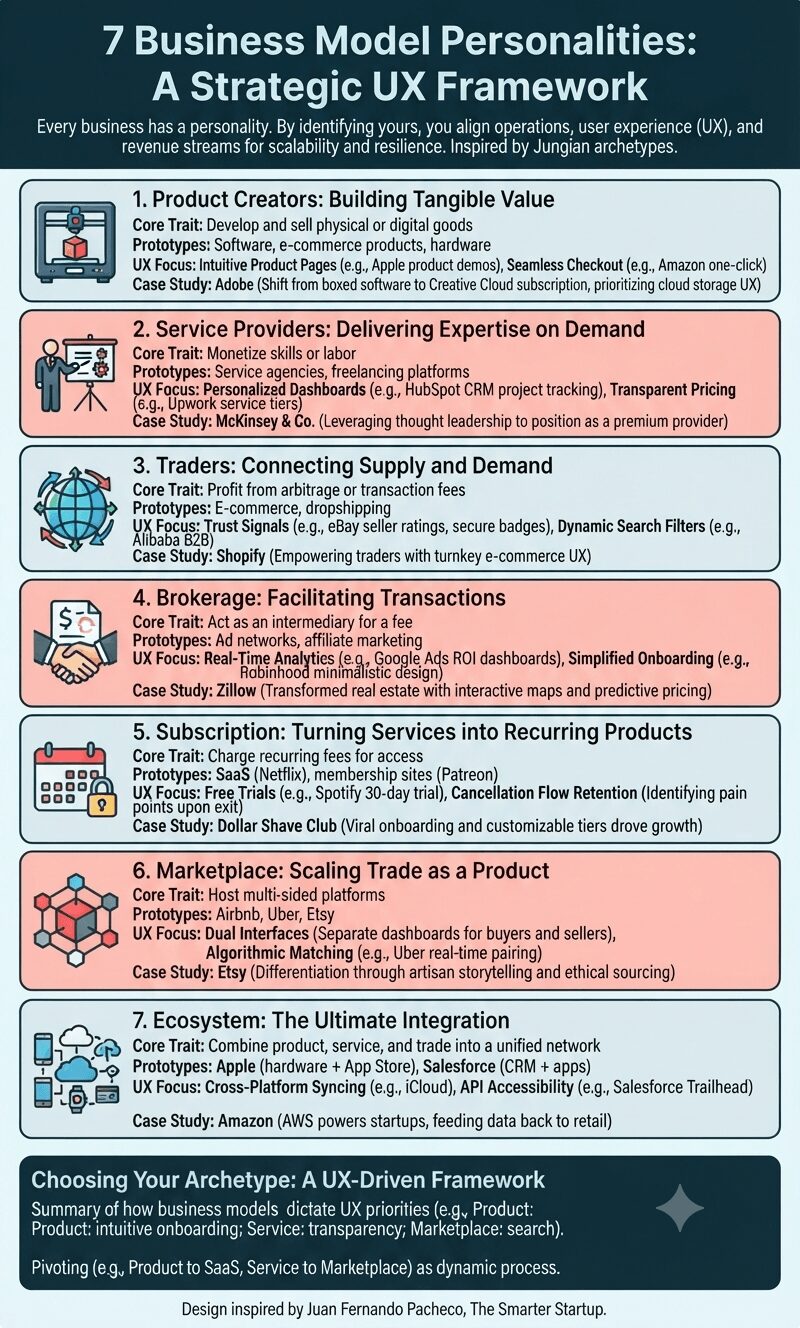
"Infographic titled '7 Business Model Personalities: A Strategic UX Framework' on a light background, detailing seven archetypes—Product Creators, Service Providers, Traders, Brokerage, Subscription, Marketplace, and Ecosystem—each with an icon, core traits, prototypes, UX focus, and a real-world case study."

Every business operates like a machine—input resources, process value, and output profits. But without a clear “instruction manual,” even brilliant ideas risk failure.

Inspired by Carl Jung’s personality archetypes, the 7 Business Model Personalities framework offers a strategic lens to align your operations, user experience (UX), and revenue streams.
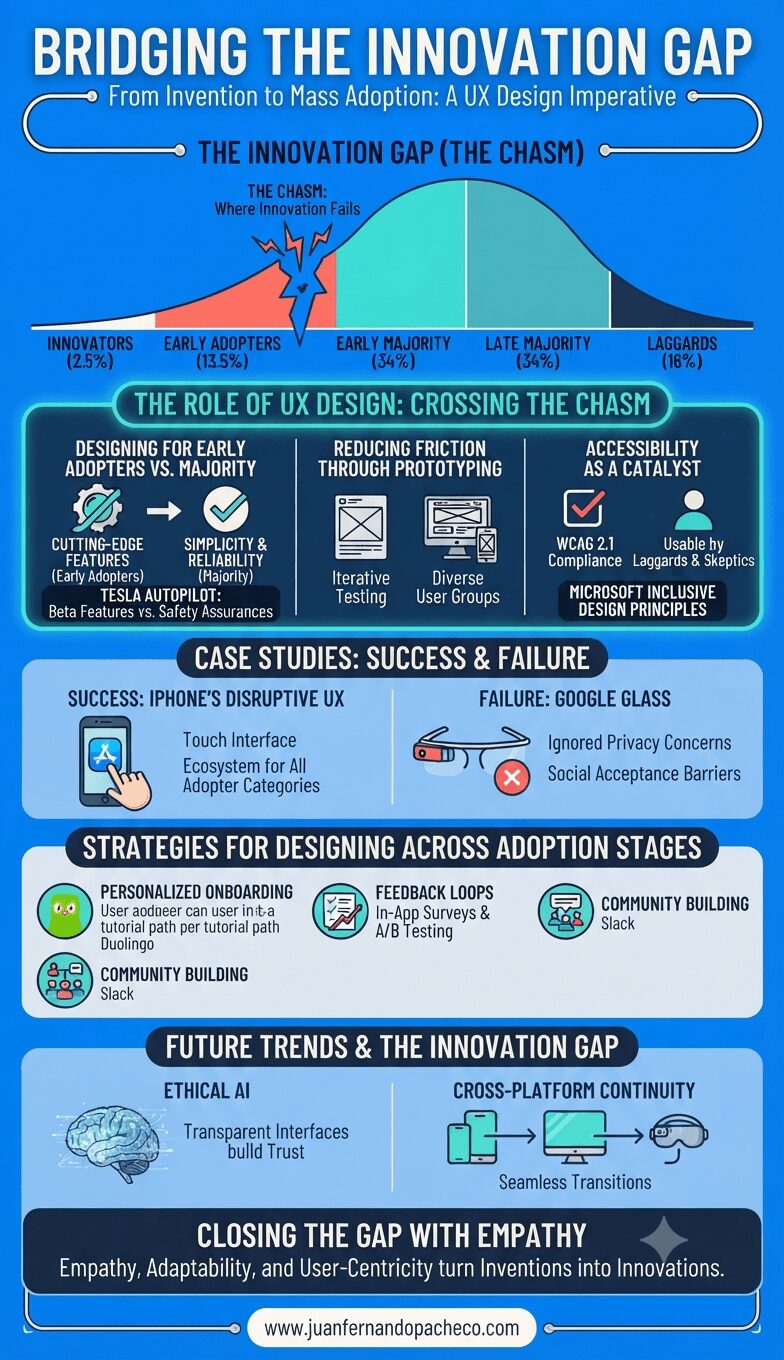
An infographic titled "Bridging the Innovation Gap: From Invention to Mass Adoption" with a central bell curve graph showing adopter categories and a "Chasm" between Early Adopters and Early Majority. Below, sections detail "The Role of UX Design," "Case Studies: Success & Failure" (iPhone vs. Google Glass), "Strategies," "Future Trends," and "Conclusion." The design uses blue, navy, coral, and teal colors.

Bridging the innovation gap requires more than technical prowess—it demands empathy, adaptability, and relentless user-centricity. By leveraging UX research, inclusive design, and iterative testing, designers can turn groundbreaking inventions into indispensable innovations.