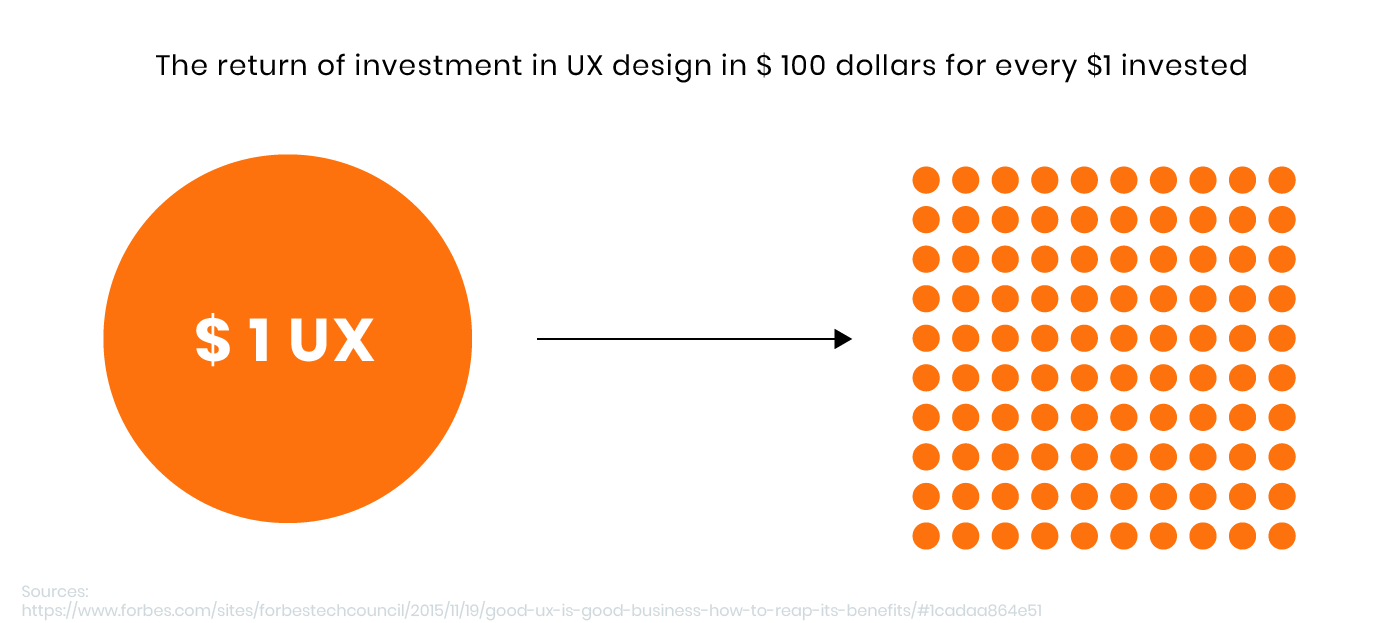
Understanding the return on investment (ROI) of a UX team is critical for organizations aiming to justify and optimize their investment in user-centered design practices.
While calculating ROI in a UX context can be challenging due to the difficulty of quantifying qualitative benefits, a systematic approach can reveal the value a UX team provides to an organization.
Below, we explore a comprehensive process for calculating the ROI of a UX team, complete with detailed examples, best practices, and tools to use.
Step 1: Define Your Goals
The foundation of ROI calculation is to clearly define the goals you want the UX team to achieve. These goals should align with business objectives and follow the SMART criteria: Specific, Measurable, Achievable, Relevant, and Time-bound.
Examples of UX Goals:
- Improve customer satisfaction: Increase customer satisfaction scores by X% within 6 months.
- Increase conversion rates: Boost the percentage of website visitors who complete a specific action (e.g., purchases or sign-ups).
- Reduce support costs: Decrease the number of support tickets related to usability issues by Y% over the next quarter.
By clearly identifying these goals, stakeholders can measure the direct and indirect contributions of UX initiatives.
Step 2: Determine Your Metrics
Metrics are crucial for tracking progress and evaluating success. The key is to choose objective, quantifiable, and actionable metrics that directly relate to the defined goals.
Examples of Metrics:
- Customer Satisfaction Scores: Use tools like Net Promoter Score (NPS) or Customer Satisfaction (CSAT) surveys.
- Conversion Rates: Measure the percentage of users completing desired actions, such as purchasing a product or signing up for a service.
- Support Request Volume: Track the number of customer service inquiries related to UX issues.
- Task Completion Rates: Evaluate how many users can successfully complete key tasks.
- Time on Task: Measure how long users take to complete specific tasks on your platform.
The choice of metrics should align directly with your goals to ensure a meaningful ROI analysis.
Step 3: Collect Data
Once goals and metrics are defined, collect relevant data to evaluate the UX team’s impact.
Collecting Cost Data:
Gather information about the expenses associated with the UX team, such as:
- Salaries and benefits
- Software and tools
- Research and usability testing costs
- Training and development expenses
Collecting Metric Data:
Track the selected metrics before and after implementing UX improvements. For example:
- Customer satisfaction scores from surveys
- Website analytics for conversion rates
- Customer service logs for support requests
Data Collection Tips:
- Consistency: Collect data regularly over time for reliable comparisons.
- Visualization: Use graphs and charts to understand trends more clearly.
- Collaboration: Work with HR, finance, and analytics teams to gather comprehensive data.
Step 4: Calculate the ROI
With data in hand, calculate the ROI using a systematic approach. Two common methods are the Net Present Value (NPV) approach and a simplified ROI formula.
Method 1: Net Present Value (NPV)
This method involves estimating future benefits and discounting them to the present value.
Formula:
NPV = (Benefits / (1 + r)^t) – Costs
Where:
- Benefits = Revenue or savings generated by UX improvements
- r = Discount rate (e.g., 10%)
- t = Time period in years
- Costs = Total investment in the UX team
Example:
- Pre-UX conversion rate: 2%
- Post-UX conversion rate: 3%
- Additional annual orders: 1,000
- Average order value: $100
- Annual support savings: $5,000
- Annual team cost: $200,000
- Discount rate: 10%
Plugging these values into the formula, we get:
NPV = ($105,000 / (1 + 10%)^1) – $200,000
= -$104,545.45
This means that, according to this calculation, the UX team has generated benefits worth $104,545.45 less than the costs of the team for one year.
In this scenario, the UX team’s benefits are less than its costs, indicating a negative ROI for the first year.
Method 2: Simplified ROI Formula
This method calculates the ROI as a percentage.
Formula:
RoI = (Benefits – Costs) / Costs
Example:
- Monthly reduction in support requests: 250
- Cost per request: $10
- Annual support savings: $30,000
- Annual team cost: $200,000
Plugging these values into the formula, we get:
RoI = ($30,000 – $200,000) / $200,000
= -85%
This result shows an 85% negative ROI, suggesting that benefits do not yet outweigh costs.
Challenges in Calculating UX ROI
Quantifying the value of UX work is not always straightforward. Challenges include:
- Intangible Benefits: Metrics like brand loyalty, improved user trust, or customer lifetime value are harder to quantify.
- Time Lag: UX improvements may take months or years to reflect in metrics.
- Attribution: Determining whether benefits are due to UX changes or other factors.
Best Practices for Measuring UX ROI
- Align with Business Goals: Ensure UX objectives tie directly to measurable business outcomes.
- Use Benchmarks: Compare metrics against industry standards or past performance.
- Communicate Clearly: Share ROI calculations and their implications with stakeholders.
- Iterate and Improve: Use insights from ROI analysis to refine UX processes.
- Combine Qualitative and Quantitative Data: Pair metrics with user feedback to tell a complete story.
Tools for UX ROI Analysis
- Google Analytics: For tracking conversion rates and user behavior.
- Hotjar: For heatmaps and user feedback.
- UsabilityHub: For remote usability testing.
- SurveyMonkey: For collecting customer satisfaction data.
- Excel/Google Sheets: For ROI calculations and data visualization.
Conclusion
Calculating the ROI of a UX team requires a structured approach—from defining goals to analyzing data and applying financial models. While challenges exist, using the right metrics, tools, and communication strategies can demonstrate the tangible and intangible value of UX work.
By aligning UX efforts with organizational objectives, teams can make a compelling case for continued investment in user experience.
If you want to know more about this topic, you should check the below URLs:


