The Architect’s Blueprint for Strategic Execution
For over two decades as a UX designer and solutions architect, I’ve witnessed organizations drown in well-intentioned strategies that never materialize. The chasm between ambition and execution isn’t due to lack of effort—it’s a systems design problem. Objectives and Key Results (OKRs) bridge this gap, but only when tracked with surgical precision. Let’s deconstruct how elite teams instrument their goal-tracking systems.
Why Tracking Isn’t Optional: The Data Imperative
Goals without metrics are hallucinations. OKR tracking transforms abstract aspirations into engineered outcomes:
Psychological Ownership: When teams see real-time progress dashboards, engagement spikes by 30-50%. Transparency creates accountability.
Agile Resource Allocation: Tracking exposes misaligned efforts early. One tech client reallocated $500K in engineering resources mid-quarter when KR data revealed pipeline imbalances.
Cultural Feedback Loop: Regular scoring rituals build a “growth mindset” muscle. Google’s 0.7=success paradigm rewards ambition, not just completion.
📈 Architect’s Insight: Treat OKR tracking as a real-time control system. Like application performance monitoring (APM) tools, it surfaces bottlenecks before they cascade into failures.
The Scoring Engine: Decoding the 0–1 Scale
Scoring isn’t bookkeeping—it’s a behavioral calibration tool. The mechanics matter:
Grading Methodologies Compared
| Method | Mechanics | Best For | Pitfalls | |
|---|---|---|---|---|
| Google Scale | 0.0–1.0 (0.7=success) | Stretch goals | Misinterpreted as failure | |
| Binary (Grove) | Yes/No (100% or 0%) | Compliance-critical | Demotivating near-misses | |
| Confidence | Subjective % likelihood | Early-stage projects | Over-optimism bias | |
| Hybrid | Mix of quantitative + qualitative | Complex portfolios | Inconsistent scoring |
The 0.7 Sweet Spot:
Why it works: Achieving 70% of an audacious goal delivers 10x more value than 100% of a safe target. Example: A 0.7 score on “Reduce cloud infra costs by 40%” might still yield $1.2M savings.
Design Tip: Color-code dashboards—green (0.7–1.0), yellow (0.4–0.6), red (0–0.3)—to enable glanceable diagnostics.
Scoring in Practice: The Math Behind the Magic
Objective: Launch a market-disrupting AI feature
KR1: Acquire 10,000 beta users (Achieved: 8,500 → Score: 0.85)
KR2: Achieve 4.5/5 user satisfaction (Achieved: 4.2 → Score: 0.93)
KR3: Reduce latency to <200ms (Achieved: 230ms → Score: 0.3)
Composite Score: (0.85 + 0.93 + 0.3)/3 = 0.69 → Yellow zone
🔍 Analysis: KR3’s failure demands architectural intervention (e.g., query optimization/CDN expansion). Without scoring, teams might celebrate KR1/KR2 while ignoring systemic risks.
Best Practices: The Tracking Stack
From Fortune 500 deployments to startup scaling, these patterns drive success:
Cadence Design
Weekly Check-Ins: 20-minute syncs reviewing confidence levels and blockers. Teams doing this achieve 2.1x more committed OKRs.
EOW Updates: Mandatory KR progress logging. Use automation to pull data from Jira/Salesforce to avoid “update fatigue”.
Toolchain Architecture
Quantive/WorkBoard: For enterprises needing BI integrations and cascading OKR visualization.
Tability: AI-driven health scoring and auto-generated retrospective insights.
Leapsome: Combines OKRs with 360° feedback for culture-focused teams.
Critical UX: Tools must render goal hierarchies as dependency graphs—not spreadsheets. One client reduced misalignment by 60% after switching to an OKR platform with drag-and-drop parent/child linking.
Anti-Pattern Mitigation
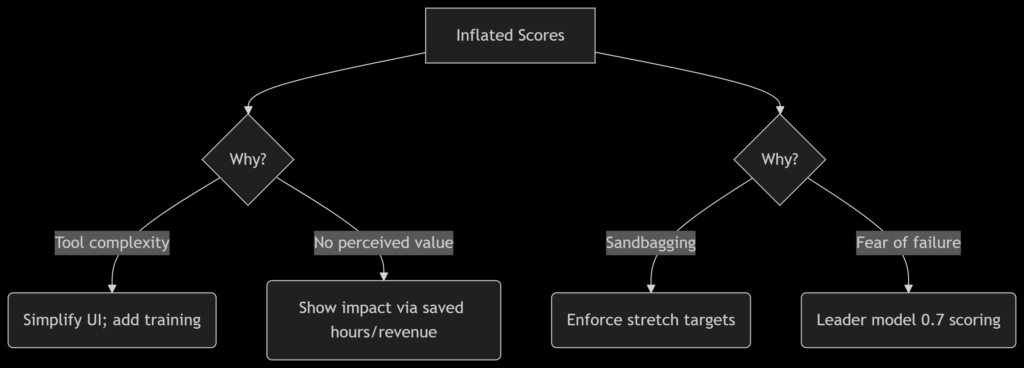
Sandbagging: Consistently scoring 1.0? Enforce “stretch targets” where 0.7 requires 2x historical growth.
Watermelon OKRs (green outside, red inside): Ban vanity metrics. Every KR must pass the “Proxy Test”: “If this improves, does it directly advance the objective?”.
Check-in Theater: Automate data collection. Sync tools like Profit.co with operational systems (CRM, GitHub) to auto-update 70% of KRs.
The Human Factor: UX Design for Adoption
Tools fail when they ignore user psychology. Architect for engagement:
Progressive Disclosure: New users see only their OKRs; managers view team summaries; executives access portfolio heatmaps.
Feedback Channels: Embed comment threads in every KR. Teams with high feedback activity have 34% faster course correction.
Gamification Done Right: Spotlight “Most Improved KR” weekly—not “Highest Score.” Reinforces a growth mindset.
⚠️ Implementation Landmine: Rolling out OKR tracking to all teams simultaneously has an 83% failure rate 8. Phase it:
Leadership team only (Q1)
Leadership + departments (Q2)
Company-wide (Q3)
When Tracking Fails: Diagnostic Flowchart
Encountering resistance? Isolate the root cause:

The Future: AI-Powered Forecasting
Forward-looking teams augment tracking with predictive analytics:
Confidence Scoring 2.0: Tools like Tability ingest Slack sentiment, project progress, and market data to forecast KR success probability 8.
Anomaly Detection: ML algorithms flag KRs deviating from historical patterns (e.g., “User growth KR pacing 22% below target despite marketing spend”).
Conclusion: Tracking as Strategic Compass
In complex systems, you get what you measure—not what you intend. OKR tracking transforms strategy from theater to engineering discipline. Remember:
Perfection kills ambition: A 0.7 composite score is the hallmark of a high-performing team.
Tools must serve humans: Without UX rigor, platforms become digital ghost towns.
Data without dialogue is noise: Pair dashboards with candid retrospectives.
“The only progress you can achieve is the progress you measure.” 1 Start measuring right—and watch execution eclipse ambition.
Further Exploration:


