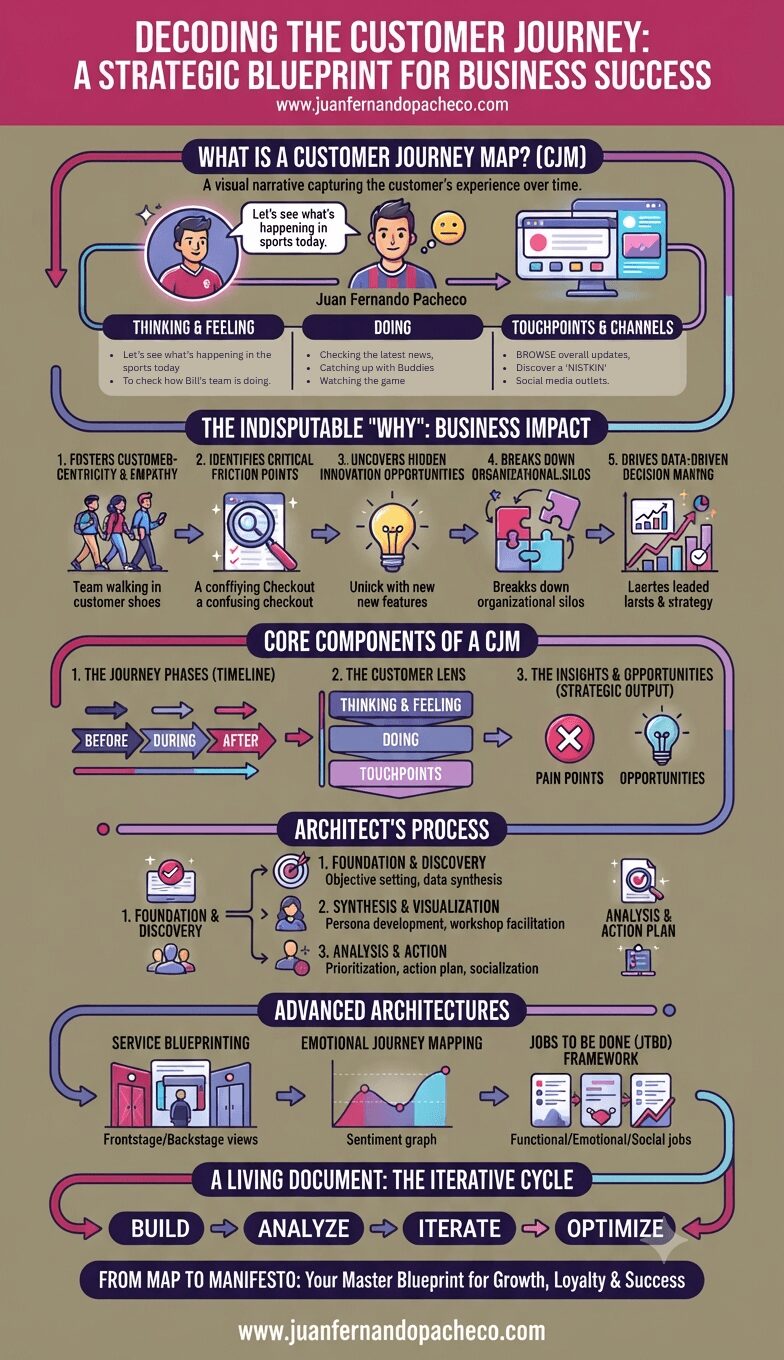
An infographic titled "Decoding the Customer Journey" that serves as a strategic blueprint for business success. The vertical graphic, set against a muted olive background, uses a color palette of pink, purple, and blue. It outlines the definition of a Customer Journey Map (CJM), its business impact, core components (phases, lens, insights), the architectural process (foundation, synthesis, action), advanced frameworks (blueprinting, emotional mapping, JTBD), and the iterative cycle of review. The URL www.juanfernandopacheco.com is included at the top and bottom.

Decoding the customer journey is the first, most critical step in building a truly customer-centric organization. The map of Juan Fernando Pacheco is more than a diagram; it’s a manifesto. It declares that the company’s success is inextricably linked to his success in achieving his goals—be they finding community, proving his knowledge to his buddies, or simply enjoying the thrill of the game.

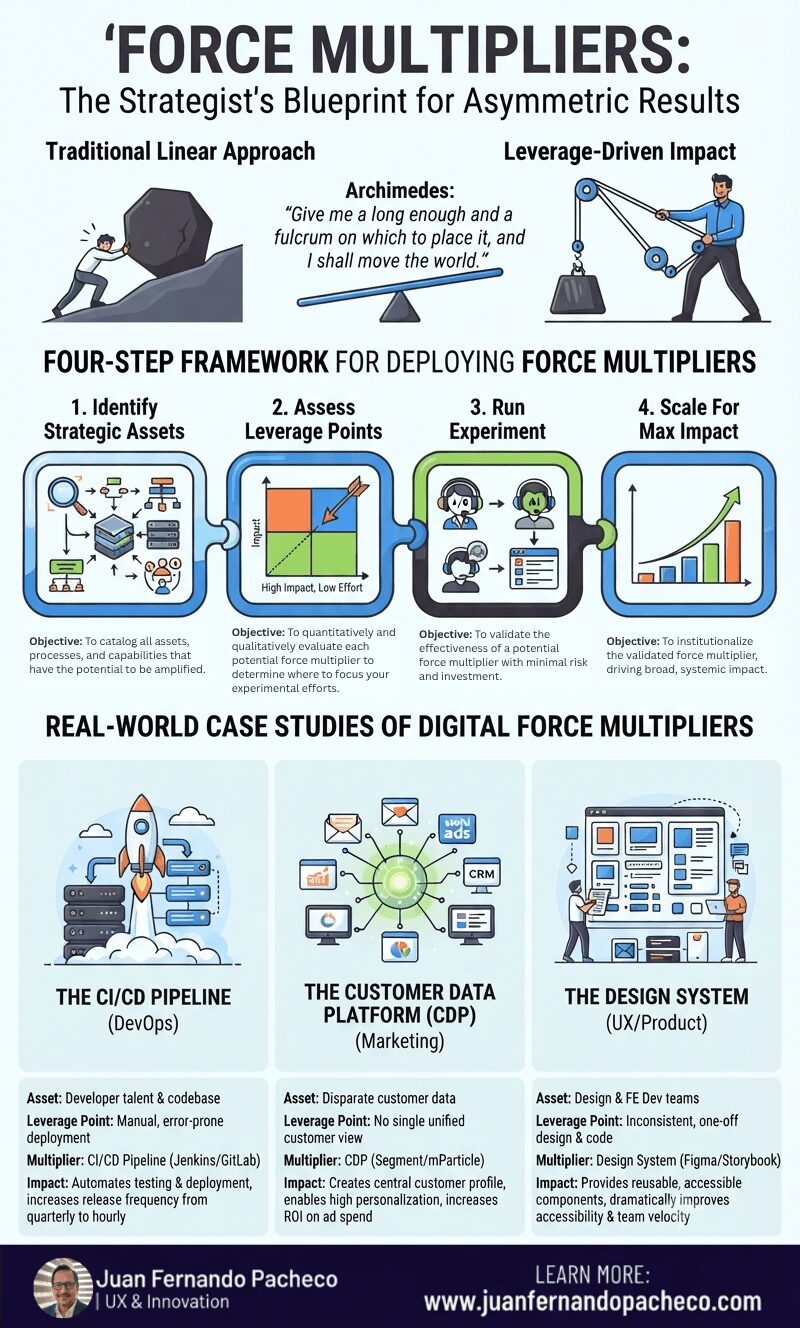
A vertical infographic titled "FORCE MULTIPLIERS: The Strategist's Blueprint for Asymmetric Results." It contrasts traditional effort with leverage-driven impact, outlines a four-step framework, and presents three real-world case studies with brand new illustrative icons.

Stop asking, “How can we do this task faster?” Start asking, “How can we make this task irrelevant?” or “How can we automate this outcome?” By systematically identifying your strategic assets, rigorously assessing their leverage points, courageously running experiments, and deliberately scaling successes, you embed a culture of amplification into your organization’s DNA.
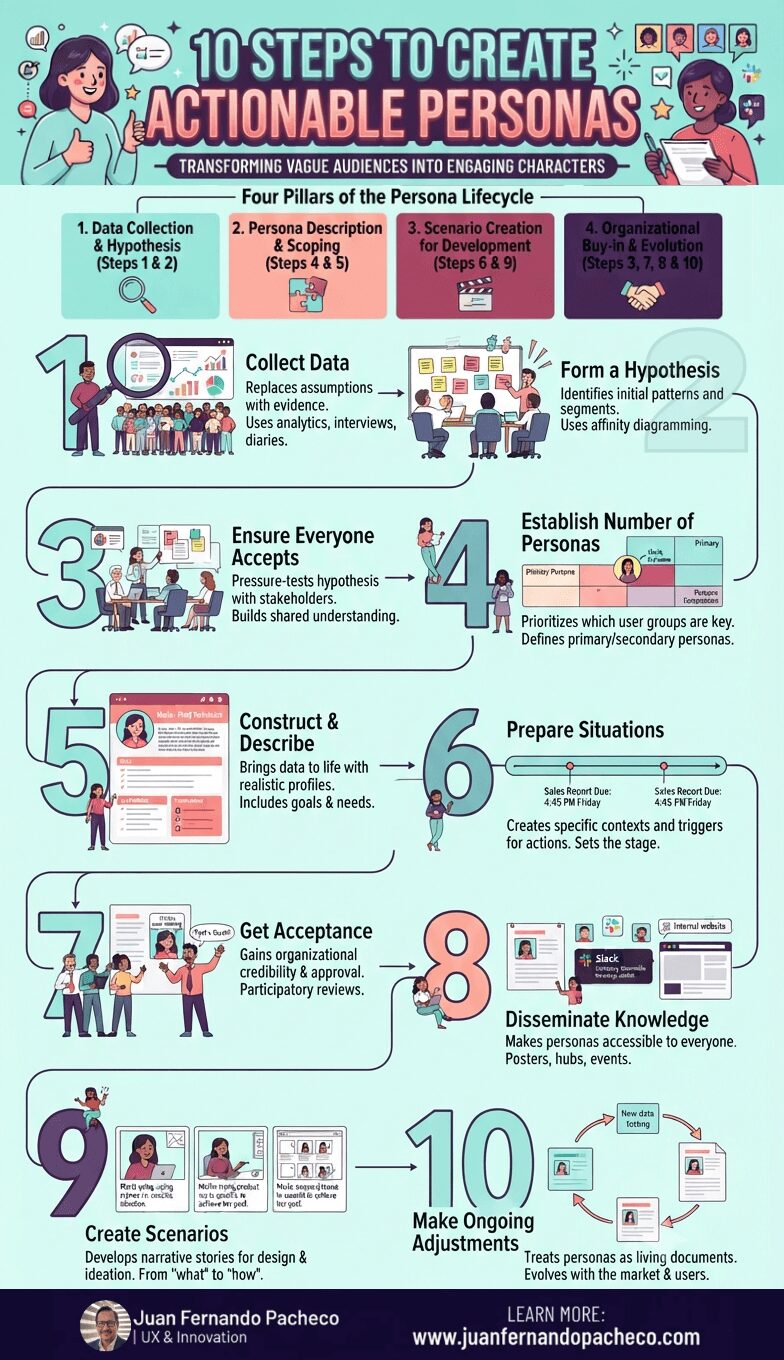
An infographic titled "10 Steps to Create Actionable Personas," laid out in a winding, numbered path from 1 to 10 against a light teal background. It illustrates the four pillars of the persona lifecycle: Data Collection & Hypothesis (1-2), Persona Description & Scoping (4-5), Scenario Creation for Development (6 & 9), and Organizational Buy-in & Evolution (3, 7, 8 & 10). Each step features icons, brief descriptions of goals and methods, and illustrations of diverse teams collaborating on research, workshops, and digital tools.

Creating engaging personas is not a one-week exercise to be filed away and forgotten. It is a strategic commitment to human-centered design. This 10-step process provides a robust framework, but its success hinges on a cultural shift within your organization—a shift from building for “the user” to designing for “Maria,” “John,” and “Akira.”
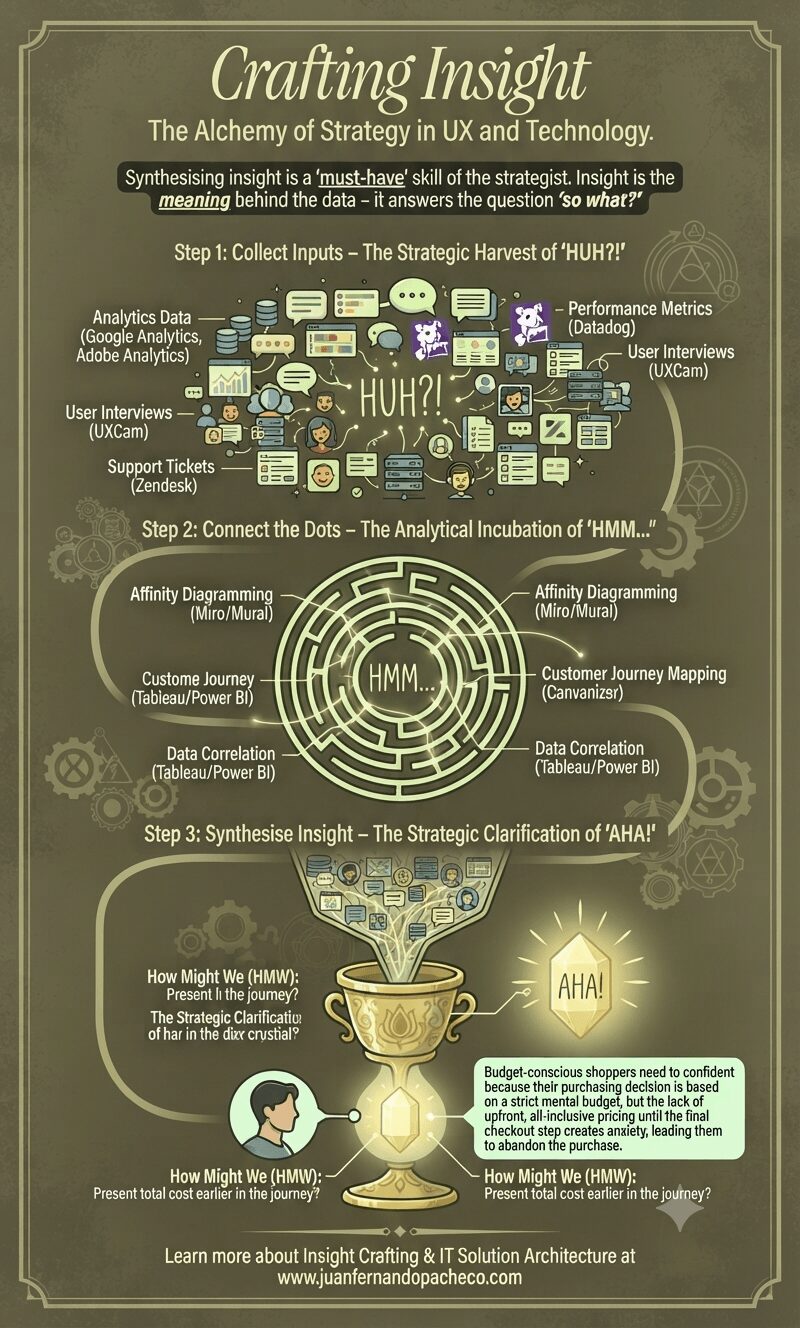
An infographic illustrating the three-step framework of crafting insight—Collect Inputs (HUH?!), Connect Dots (HMM...), and Synthesise Insight (AHA!)—featuring a glowing crystal alchemy design against a muted olive-tan background with references to www.juanfernandopacheco.com.

Crafting insight is not a linear, one-time event. It’s a continuous, iterative cycle. As you build and test solutions based on your insights, you generate new data, leading to new “HUH?!” moments, and the cycle begins anew.

Remember: quality insights will lead to quality strategy.
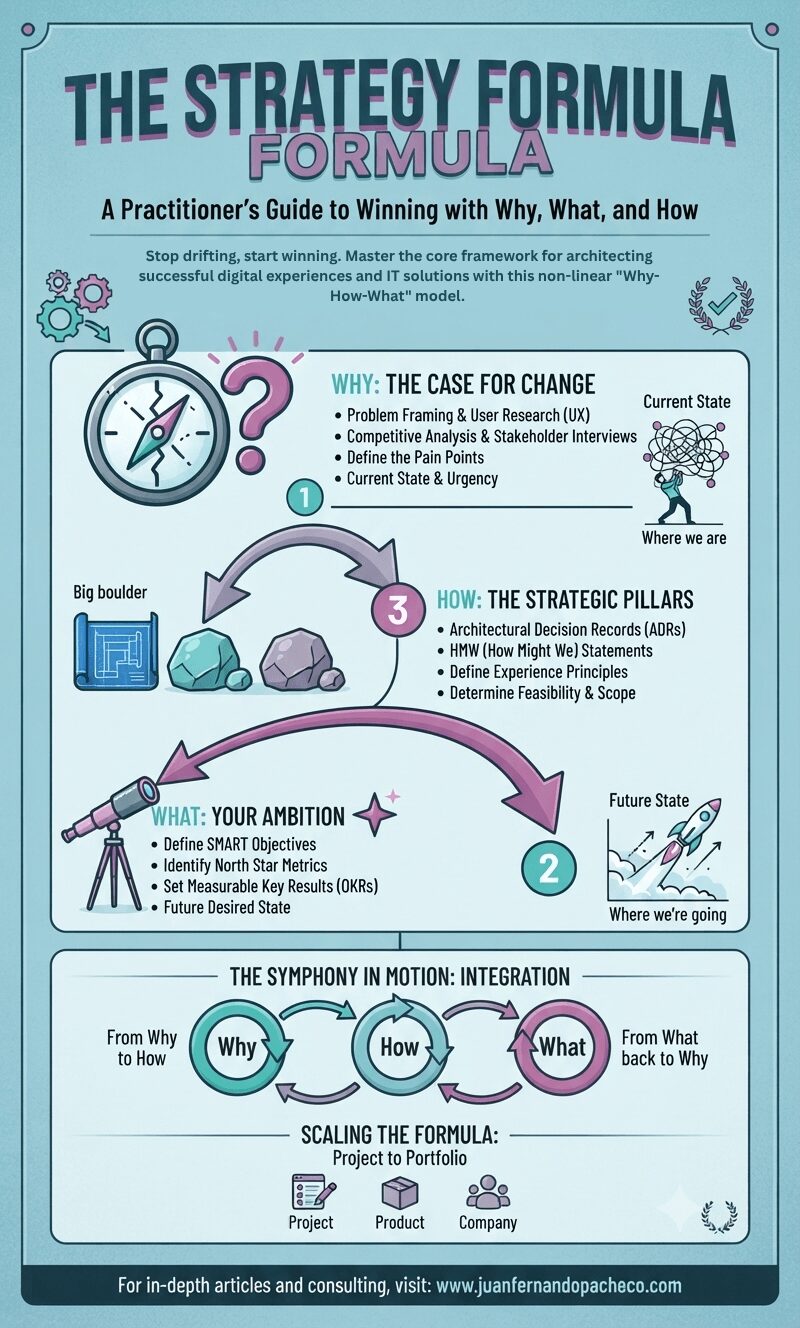
A tall vertical infographic in teal and purple tones, with the title "THE STRATEGY FORMULA". The image is divided into a three-part, non-sequential flow, clearly numbered 1, 3, and 2, with curved arrows showing the progression. Section 1, "WHY: THE CASE FOR CHANGE," features a cracked compass and a question mark. Section 3, "HOW: THE STRATEGIC PILLARS," shows three large boulders and a blueprint. Section 2, "WHAT: YOUR AMBITION," features a telescope. Below this, a section titled "THE SYMPHONY IN MOTION: INTEGRATION" shows the three components in a cycle. Finally, "SCALING THE FORMULA: Project to Portfolio" displays icons for a project, product, and company. The footer includes the URL "www.juanfernandopacheco.com".

In a world of infinite distractions and limited resources, clarity is your most significant competitive advantage. The Strategy Formula—Why, How, What—is the ultimate tool for achieving that clarity. It forces rigor, fosters alignment, and grounds your ambition in reality.

It prevents the all-too-common pitfalls: the solution in search of a problem, the activity mistaken for progress, and the vague goal that inspires no one.
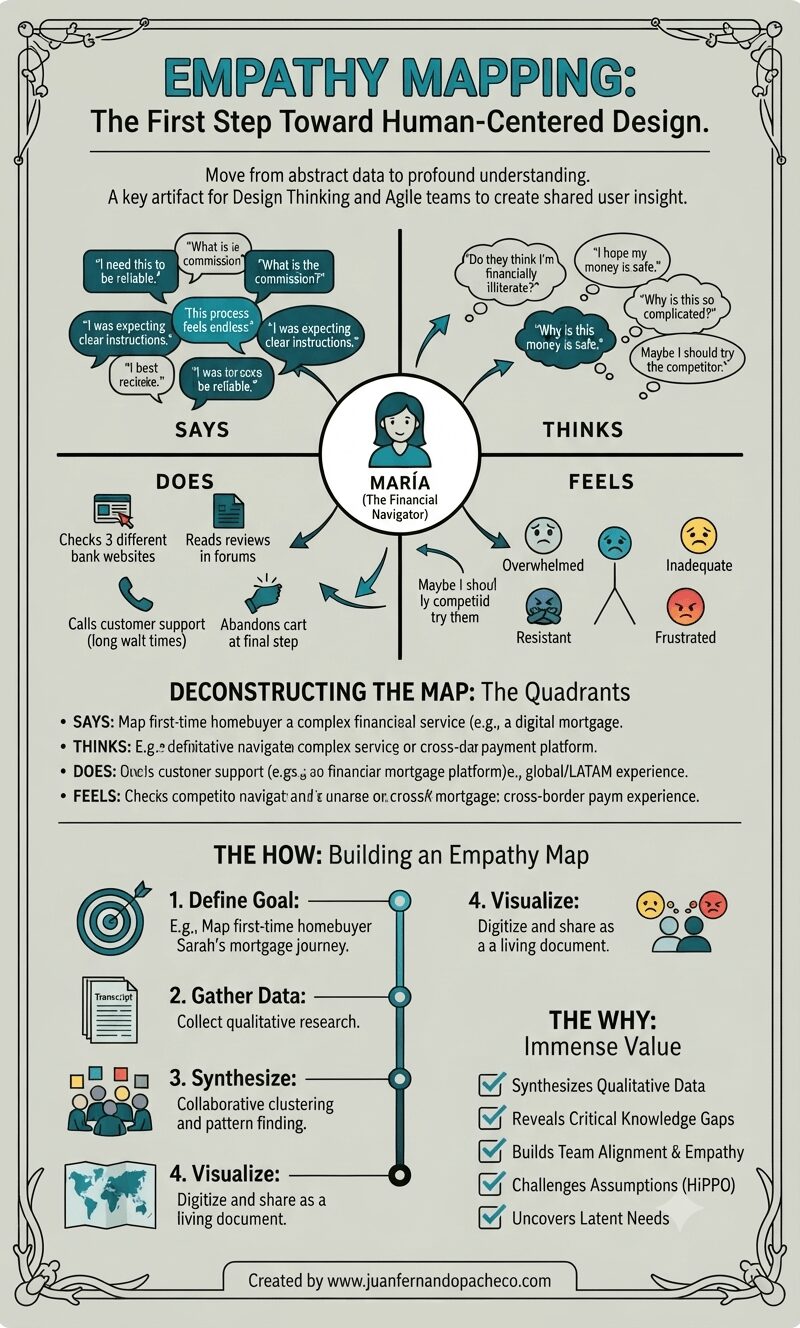
A vertically-oriented infographic titled "EMPATHY MAPPING: The First Step Toward Human-Centered Design," set against a light sage-green background with a decorative border. The center features a complete empathy map for a persona named "MARÍA (The Financial Navigator)," with radiating arrows connecting her icon to four detailed quadrants: "SAYS" (with quotes like "I need this to be reliable," "What is the commission?"), "THINKS" (internal thoughts like "Do they think I'm financially illiterate?"), "DOES" (actions like "Checks 3 different bank websites"), and "FEELS" (emotions with emojis like "Overwhelmed," "Inadequate"). Below the map, sections deconstruct the quadrants and outline "THE HOW: Building an Empathy Map" (Define, Gather, Synthesize, Visualize steps) and "THE WHY: Immense Value" (a checklist of benefits). The bottom includes the attribution: "Created by www.juanfernandopacheco.com."

An empathy map is more than just a diagram on a wall. It is a practice, a mindset, and a commitment to seeing the world through someone else’s eyes. It transforms the abstract “user” into a human with hopes, frustrations, and a complex inner world.

By systematically capturing what our users Say, Think, Do, and Feel, we move beyond building mere features.
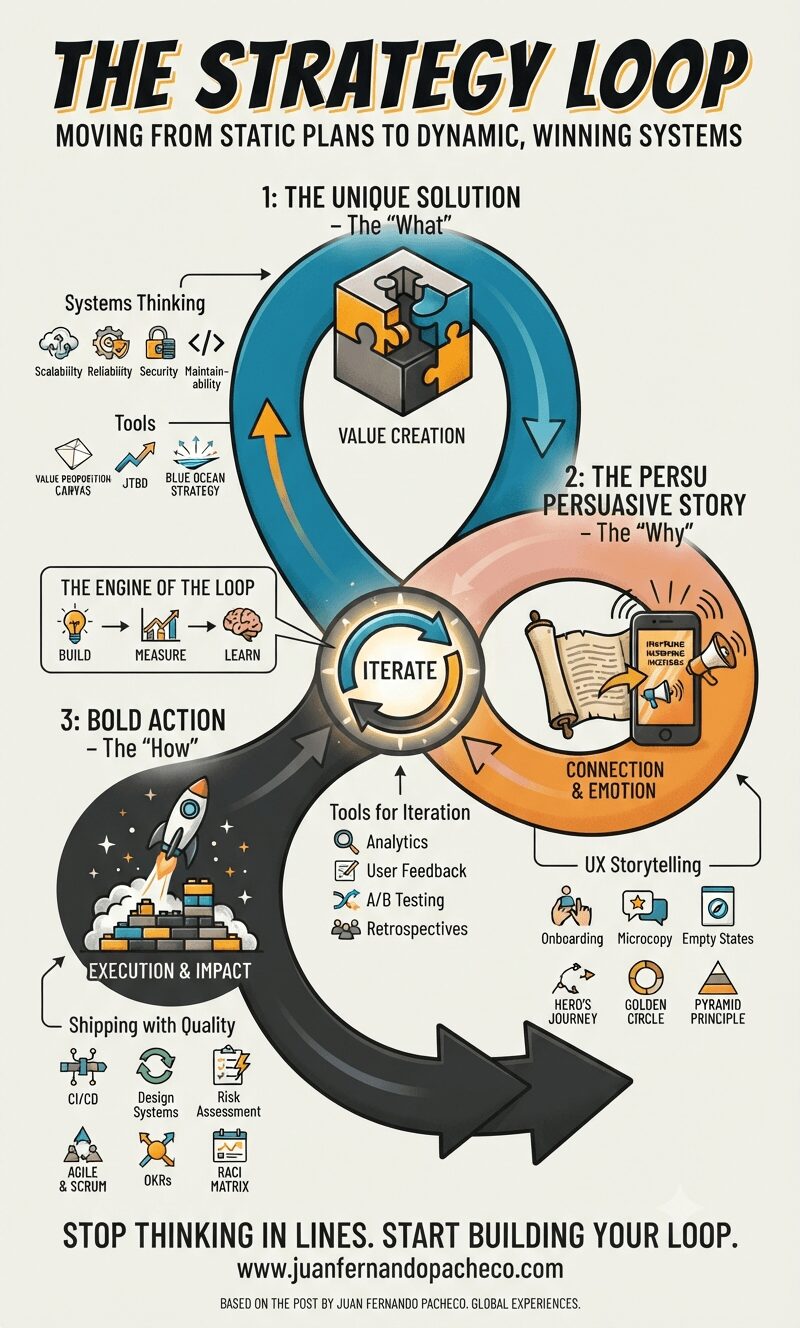
An infographic titled "The Strategy Loop" illustrating a dynamic, three-part cycle for business strategy. The teal loop at the top is "1: The Unique Solution - The What," showing puzzle pieces and value creation. The orange loop on the right is "2: The Persu Persuasive Story - The Why," showing a scroll, smartphone, and megaphone. The dark gray loop at the bottom is "3: Bold Action - The How," showing a rocket launching. In the center, a central hub labeled "Iterate" connects the cycle, supported by "The Engine of the Loop" (Build-Measure-Learn) and specific tools for each phase. The bottom text reads: "Stop thinking in lines. Start building your loop. www.juanfernandopacheco.com."

The Strategy Loop transforms strategy from a static document owned by a few executives into a dynamic, living system that empowers the entire organization. It aligns the logical rigor of the solutions architect with the empathetic, human-centered focus of the UX designer.
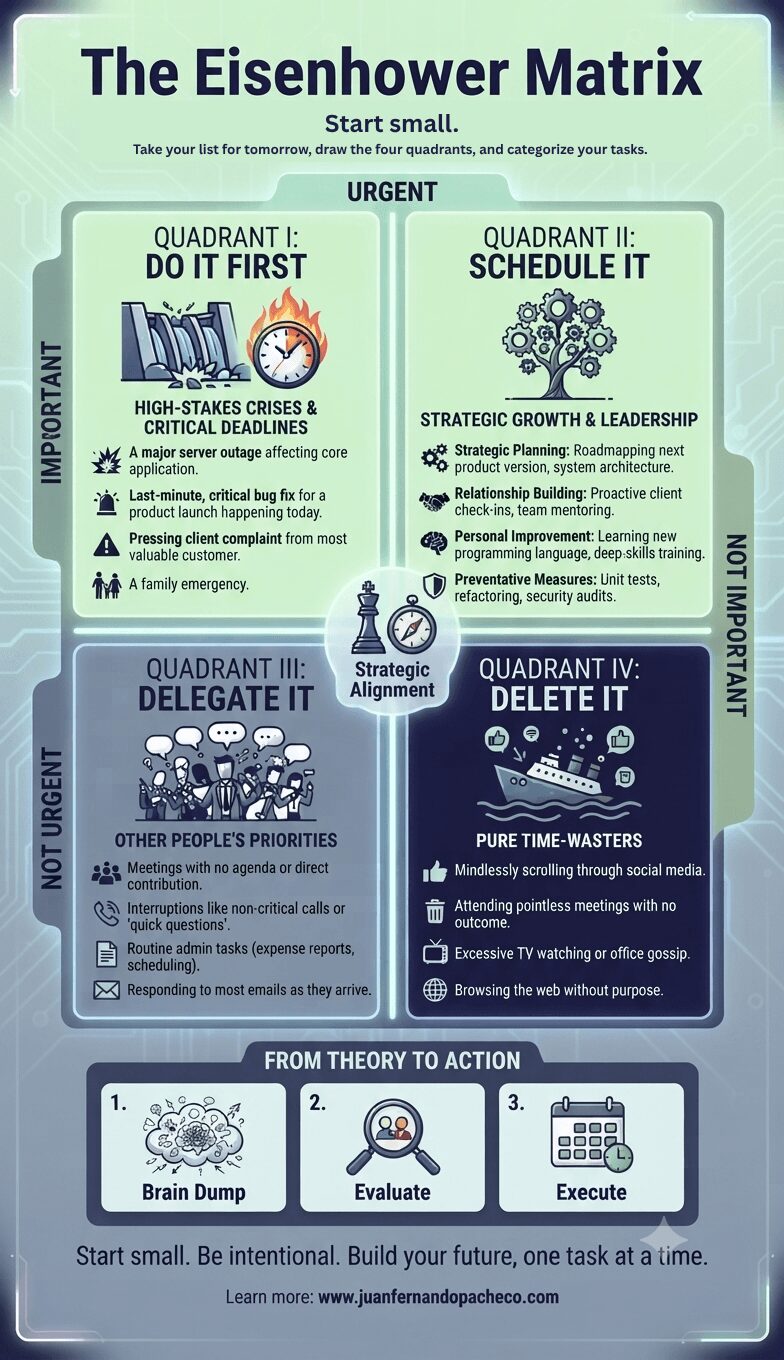
An infographic titled 'The Eisenhower Matrix' deconstructing a productivity framework. A large 2x2 grid is divided by axes labeled 'Urgent', 'Not Urgent', 'Important', and 'Not Important'. Quadrant I (Urgent/Important, top-left) is 'Do It First' with icons of a breaking dam and fire. Quadrant II (Not Urgent/Important, top-right) is 'Schedule It' with a growing tree and gears. Quadrant III (Urgent/Not Important, bottom-left) is 'Delegate It' with a group of people. Quadrant IV (Not Urgent/Not Important, bottom-right) is 'Delete It' with a sinking ship. Below the matrix, a three-step process ('Brain Dump', 'Evaluate', 'Execute') shows how to apply the method. The bottom of the image includes the URL www.juanfernandopacheco.com.

The Eisenhower Matrix is more than a productivity hack; it is a philosophy of intentional living. It teaches us to be the architects of our time rather than the tenants of other people’s urgency. By consistently asking, “Is this important?” we align our daily actions with our long-term vision.

The goal is not to achieve a perfect, static state where no emergencies exist. The goal is to cultivate the habit of discernment—to spend more of our precious time in Quadrant II, building a meaningful future, one scheduled, important task at a time.
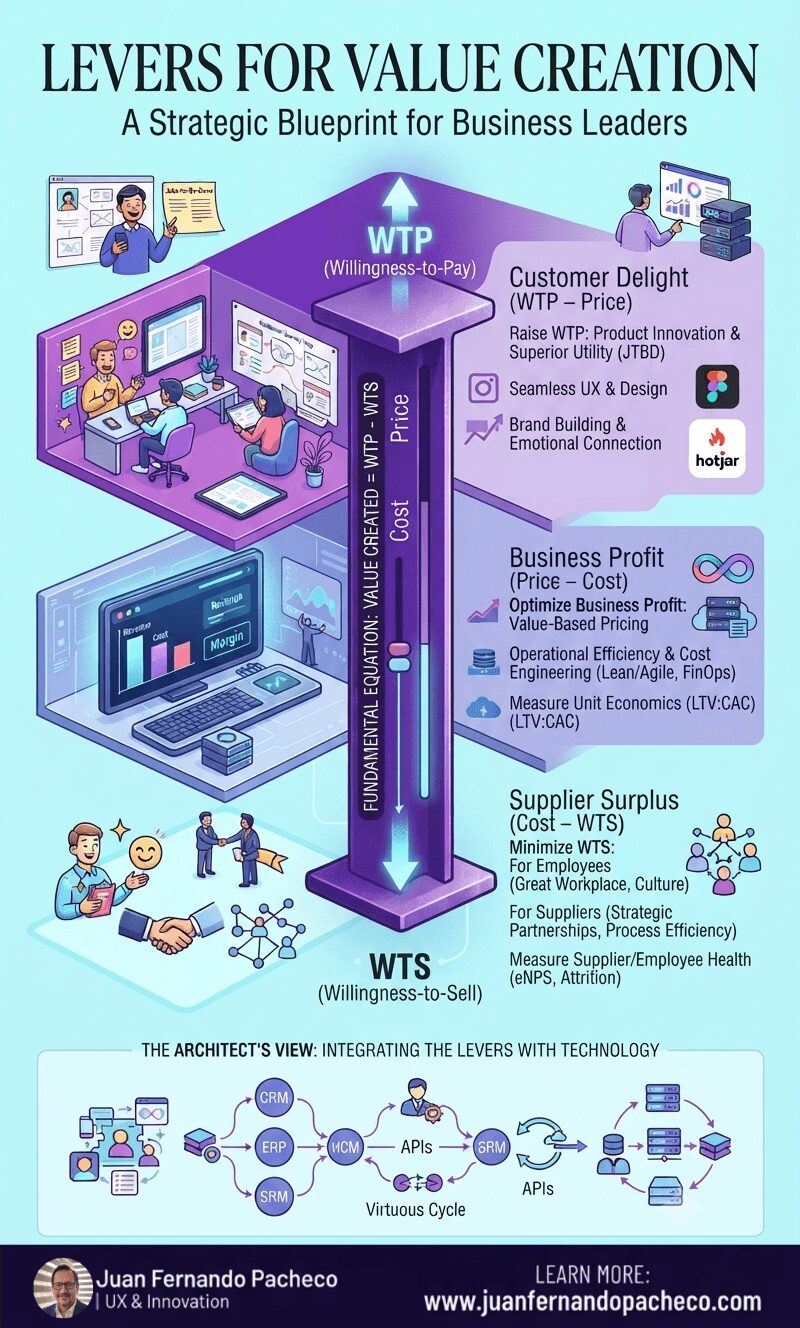
Infographic illustrating the "Levers for Value Creation" framework by Juan Fernando Pacheco, using a central "Value Stick" with WTP and WTS, surrounded by interconnected illustrated sections on Customer Delight, Business Profit, and Supplier Surplus, and an architectural view of technology integration.

The Value Stick is more than a diagram; it is a mindset. It forces a holistic view of your business ecosystem. You cannot win by delighting customers while exploiting employees. You cannot sustain profit by cutting costs without regard for the value you destroy.

Infographic titled "Embrace the Journey" contrasting a "Waterfall Model (Brittle)"—shown as a straight, fragile glass ladder—with an "Agile Model (Resilient)"—shown as a flexible, woven rope ladder. Below, a five-phase "Personal Development Lifecycle (P.D.L.)" is outlined with illustrations and text: 1. Plan (Empathize & Define), 2. Do (Prototype & Build), 3. Check (Test & Measure), 4. Adapt (Refactor & Pivot), 5. Grow (Sprint Retrospective & Launch), culminating in "Success v1.0." The bottom section, "Your Journey-Centric Toolkit," details Design Thinking, Build-Measure-Learn Loop, Personal Retrospective, and Balanced Scorecard. The background is a light cream color, and the footer contains the URL "www.juanfernandopacheco.com."

In technology, a product is never truly “finished.” It is continuously improved upon in a live environment based on user interaction and changing conditions. Your life and goals are the same.

The wall decal that inspired this article isn’t a picture of failure; it’s an accurate map of the Agile development cycle for a human being. Starting, Learning, Practicing, Doubting, Failing, Feeling Lost, Struggling—these are not signs that you are off course. They are the necessary phases of a well-architected, resilient, and meaningful life.

An infographic titled "Think Strategic" featuring an olive green background, illustrating the transition from messy, reactive thinking to structured strategic clarity using the Double Diamond framework and best practices for global digital products.

The journey from messy to clear thinking is a discipline. It’s a commitment to moving beyond the comfortable chaos of reaction and into the disciplined clarity of purpose. It’s the difference between juggling blindly and walking purposefully toward a known destination.