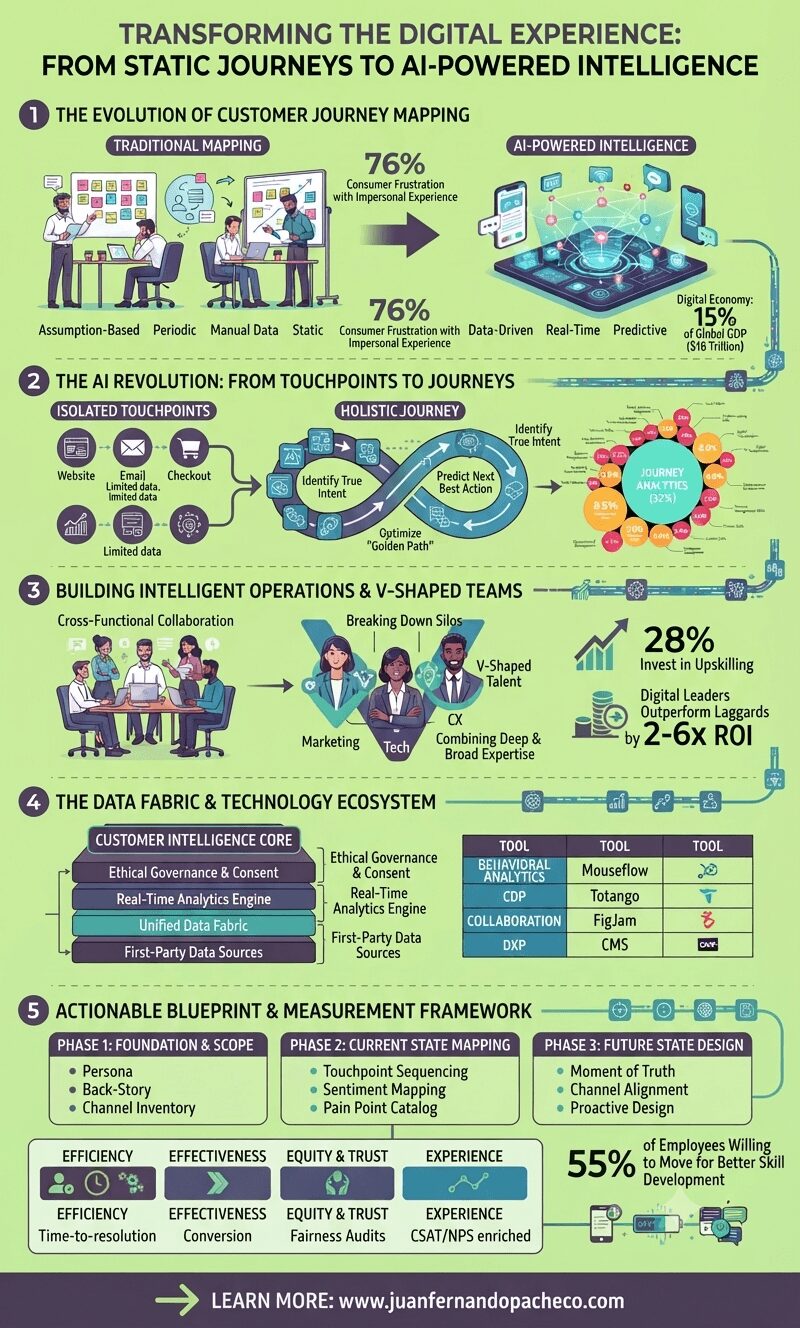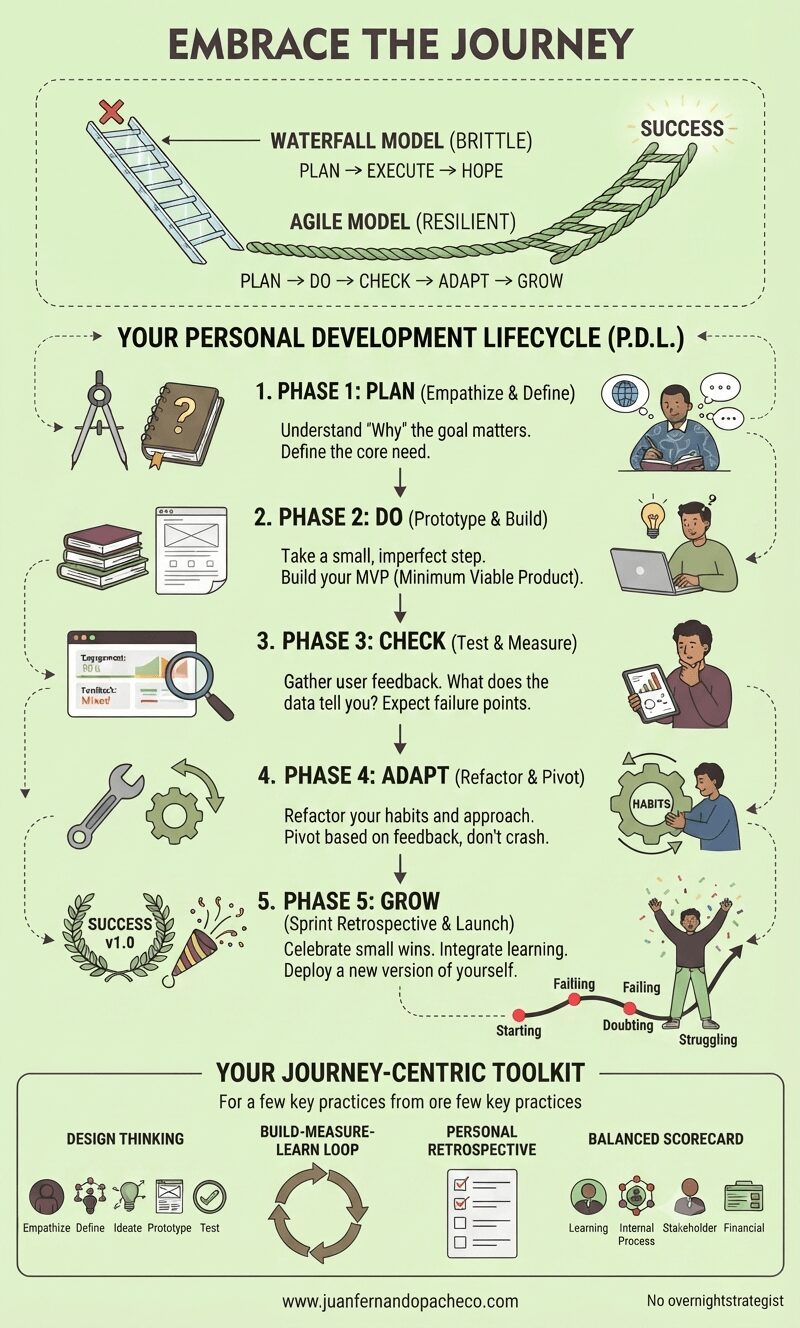
A vertical infographic featuring a light green background, styled with dark purple and teal accents, illustrating the evolution of customer journey mapping from traditional sticky notes to AI-driven predictive intelligence. It highlights V-shaped cross-functional teams, a data fabric architecture, and an actionable three-phase implementation blueprint, complete with a reference to www.juanfernandopacheco.com.

The future of customer journey mapping lies in creating dynamic, self-updating systems that not only reflect current customer behaviors but also predict future needs and preferences. This requires investment in both technology and talent—particularly in developing V-shaped employees who can bridge functional silos and translate data insights into human-centered experiences.

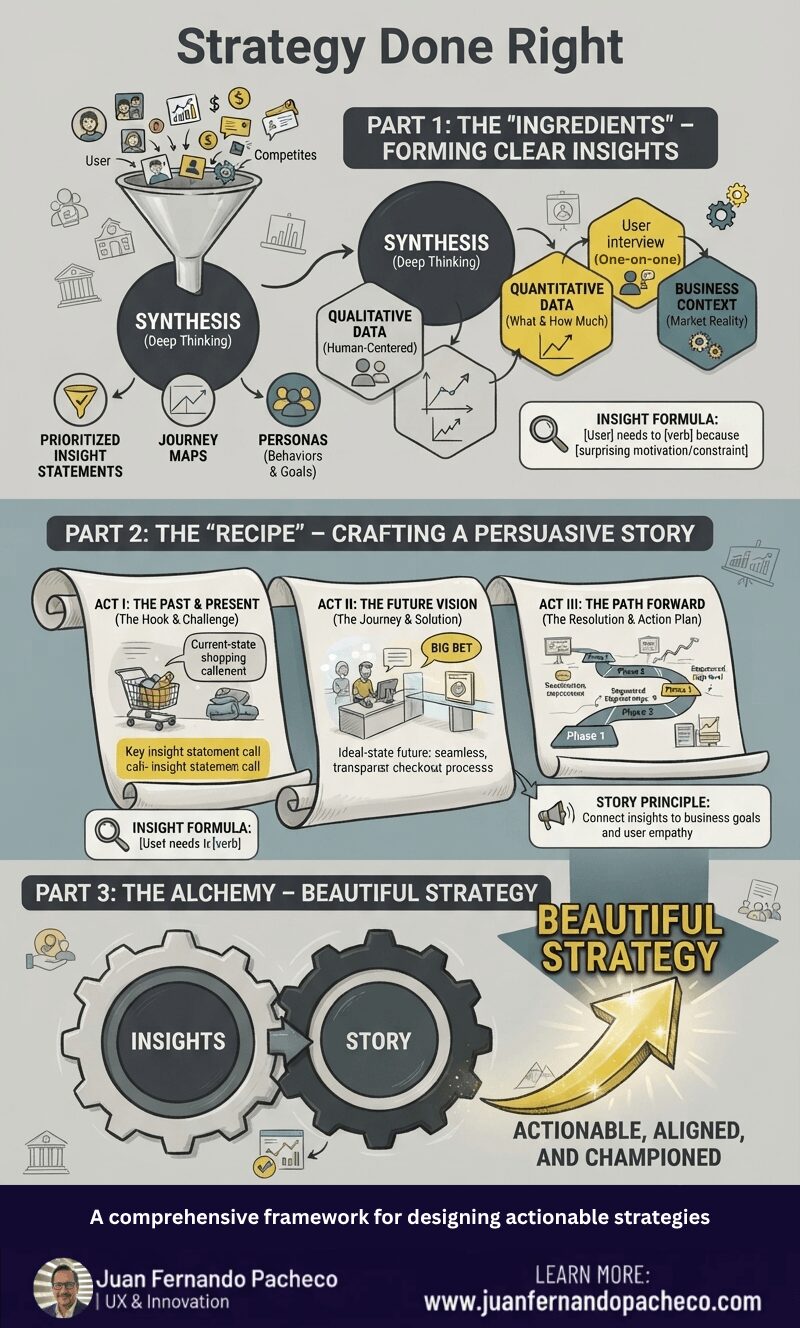
An infographic titled "Strategy Done Right," presented in three main sections on a grey background. Part 1: "The Ingredients" shows a funnel collecting data (user, competitors, analytics) leading to "Synthesis," resulting in insights, journey maps, and personas. Part 2: "The Recipe" displays three scroll icons representing Act I: The Past & Present, Act II: The Future Vision, and Act III: The Path Forward, detailing the narrative flow. Part 3: "The Alchemy" features interlocking gears labeled "Insights" and "Story," with an arrow pointing to "Beautiful Strategy" and the description "Actionable, Aligned, and Championed." The bottom banner reads "Strategy as a Craft" and "www.juanfernandopacheco.com."

Strategy is the compelling story that explains why those steps are necessary and how they lead to victory. It is the bridge between the current reality and a desired future.

The framework in this post encapsulates this perfectly:

Beautiful Strategy emerges from the alchemy of Clear Insights and a Persuasive Story.

Think of insights as your raw “ingredients” and the story as your “strategy recipe.”

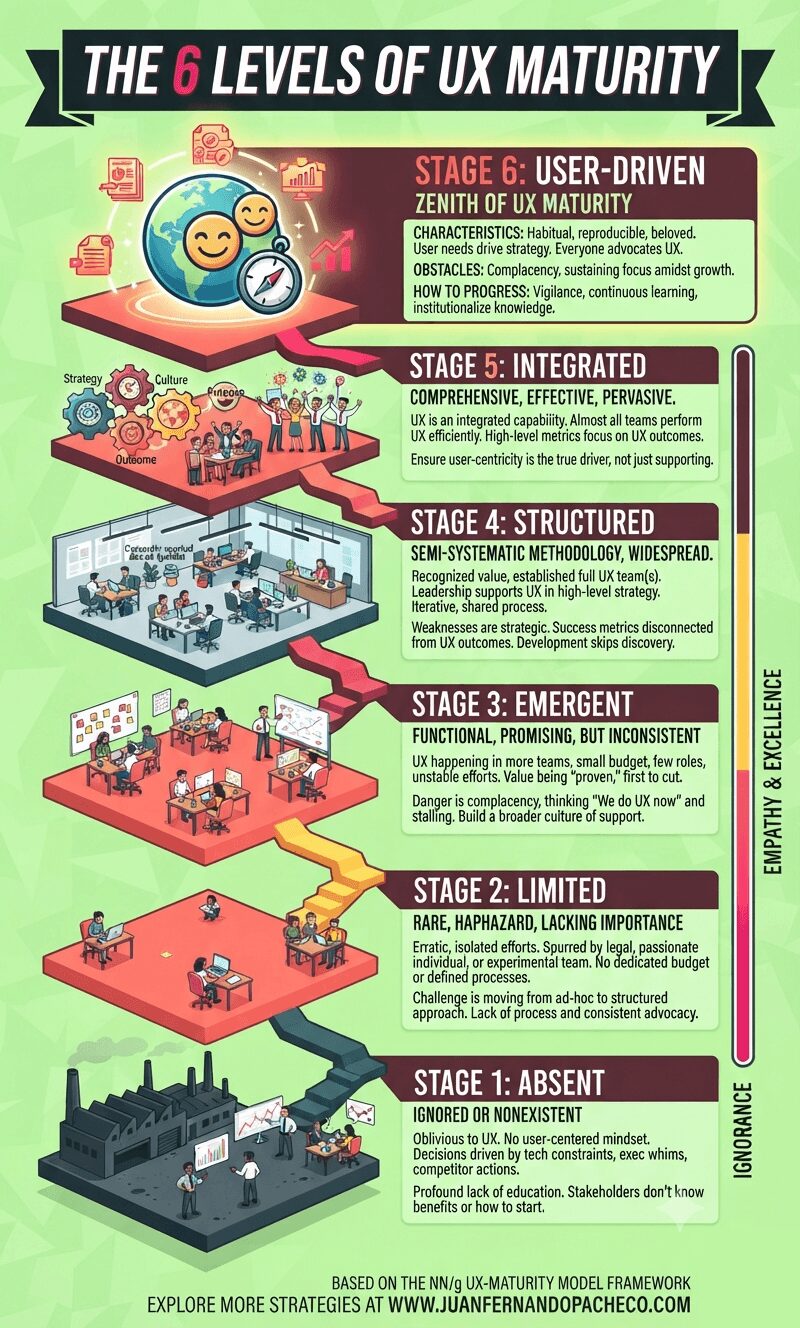
An infographic visualizes a six-stage staircase ascending from "Ignorance" to "Empathy & Excellence." Each level, from Stage 1: Absent to Stage 6: User-Driven, is detailed with an isometric illustration of an office environment, key characteristics, obstacles, and progress steps. The overall theme uses a bright, modern color palette of teals, yellows, and maroons against a lime-green background.

Understanding your organization’s UX maturity is not an exercise in vanity. It is a vital diagnostic tool that allows you to identify strengths to celebrate and weaknesses to address. It provides a realistic, shared language for improvement.

The path forward is incremental. You cannot leapfrog stages. The practices and cultural shifts of each stage create the necessary foundation for the next. Progressing even one stage can take years of dedicated effort. Don’t be discouraged. Start with an honest assessment, build a coalition of champions, celebrate small victories, and always, always tie your work back to both user value and business impact.

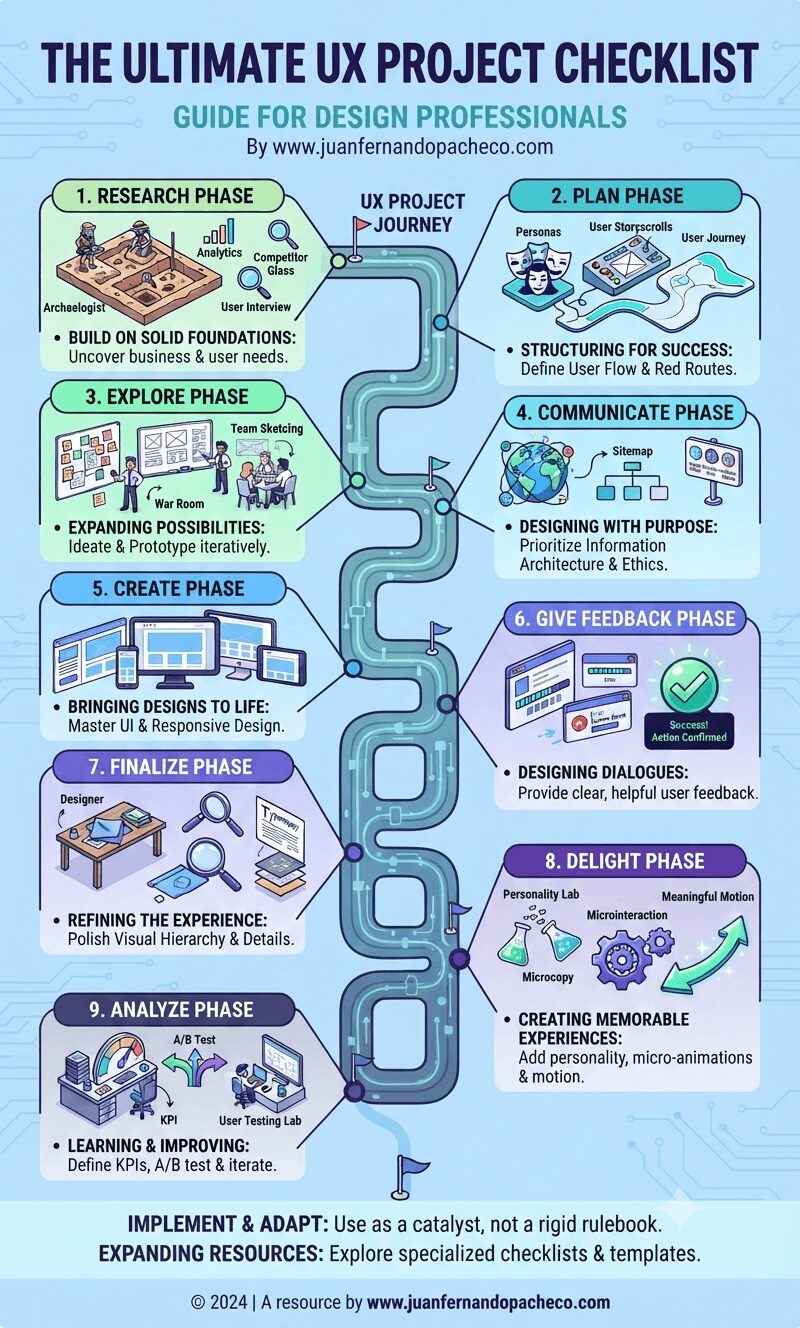
An infographic titled "The Ultimate UX Project Checklist" featuring a winding central milestone path connecting nine distinct UX phases—Research, Plan, Explore, Communicate, Create, Give Feedback, Finalize, Delight, and Analyze—against a light blue background, with brand reference www.juanfernandopacheco.com.

The UX Project Checklist represents more than just a list of tasks—it embodies a comprehensive approach to designing exceptional user experiences. As the field continues to evolve with new technologies, interaction patterns, and user expectations, this checklist should serve as a foundation rather than a final word.

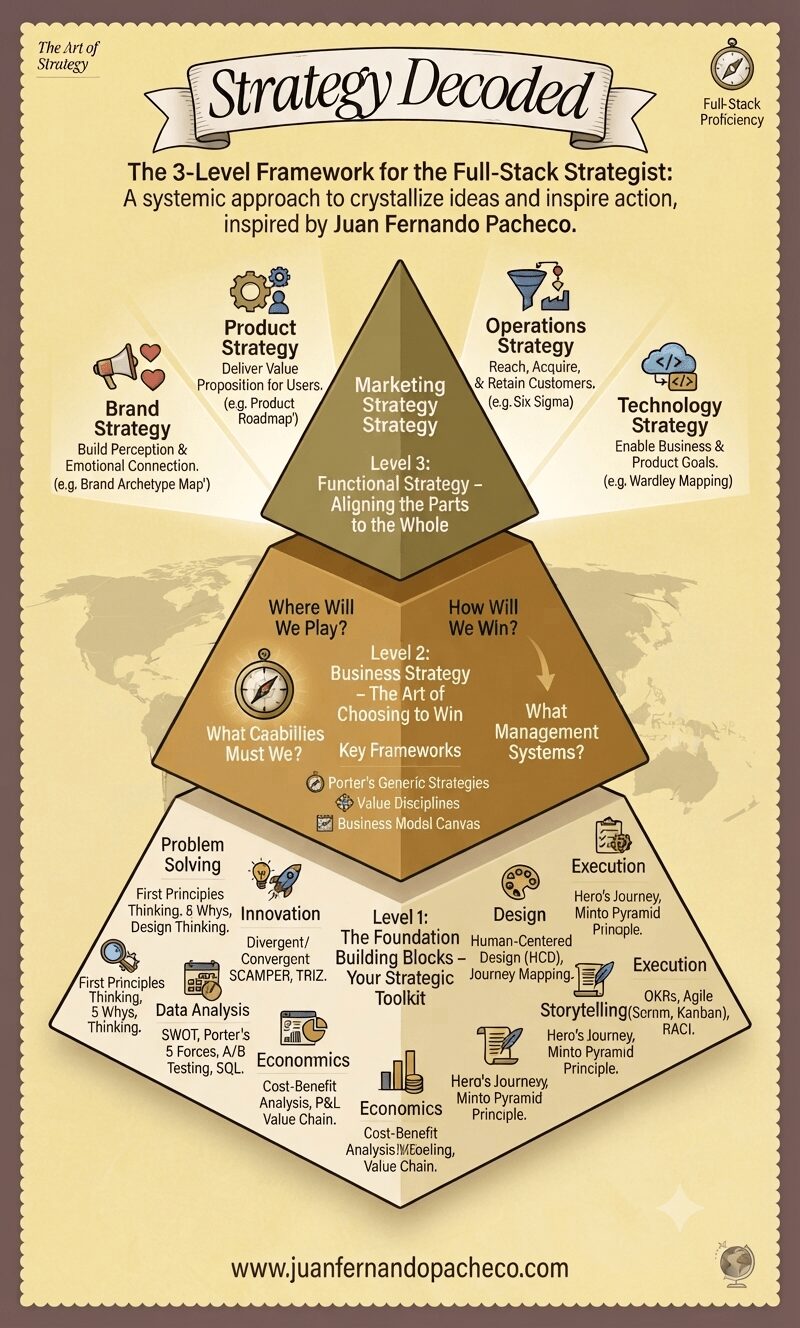
An infographic titled "Strategy Decoded" illustrating a 3-level framework for full-stack strategists, featuring Level 1 (Foundation Building Blocks), Level 2 (Business Strategy), and Level 3 (Functional Strategy) against a cream and warm earth-tone background with the URL www.juanfernandopacheco.com at the bottom.

Becoming a full-stack strategist is a journey.

Start by auditing your proficiency in the seven building blocks. Where are you strong? Where do you need improvement?
Then, practice articulating the business strategy for your team or company—even if it’s not your official job.
Finally, constantly scrutinize your functional work (whether in design, tech, product, or marketing) and ask: “Does this truly ladder up to how we’ve chosen to win?”

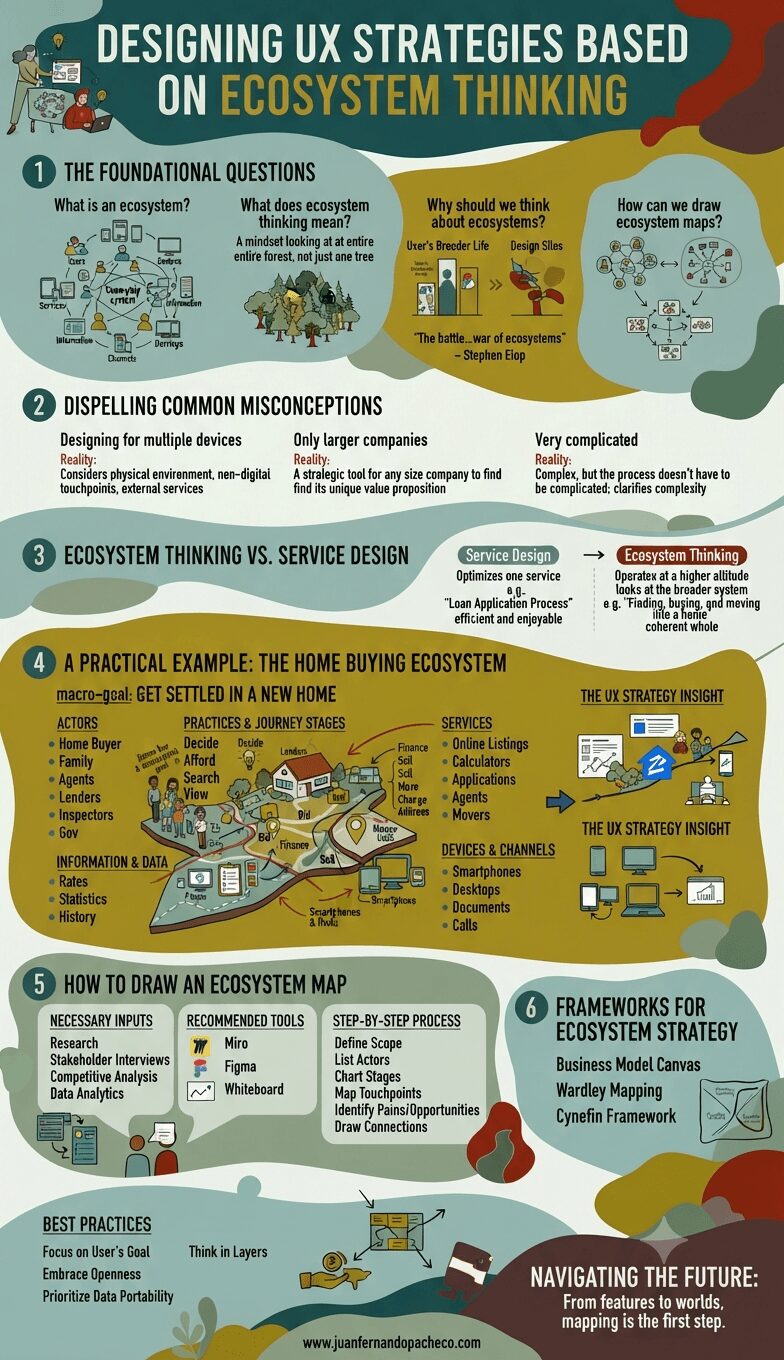
An educational infographic with a modern, illustrated aesthetic, structured into six sections with a teal and earth-tone color palette. It defines ecosystem thinking in UX design, dispels misconceptions, compares it to service design, provides a detailed home-buying example, outlines how to draw maps, lists strategic frameworks, and includes best practices and the website www.juanfernandopacheco.com.

The future of UX design is not in crafting perfect, isolated interactions. It is in designing intelligent, adaptive, and respectful nodes within a vast and complex human ecosystem. It requires us to be not just designers, but strategists, systems thinkers, and diplomats who can navigate the relationships between services, businesses, and most importantly, people.

By adopting ecosystem thinking, we move from creating products that people use to crafting environments that people live in. We stop building features and start building worlds. The map is the first step. It’s time to start charting.

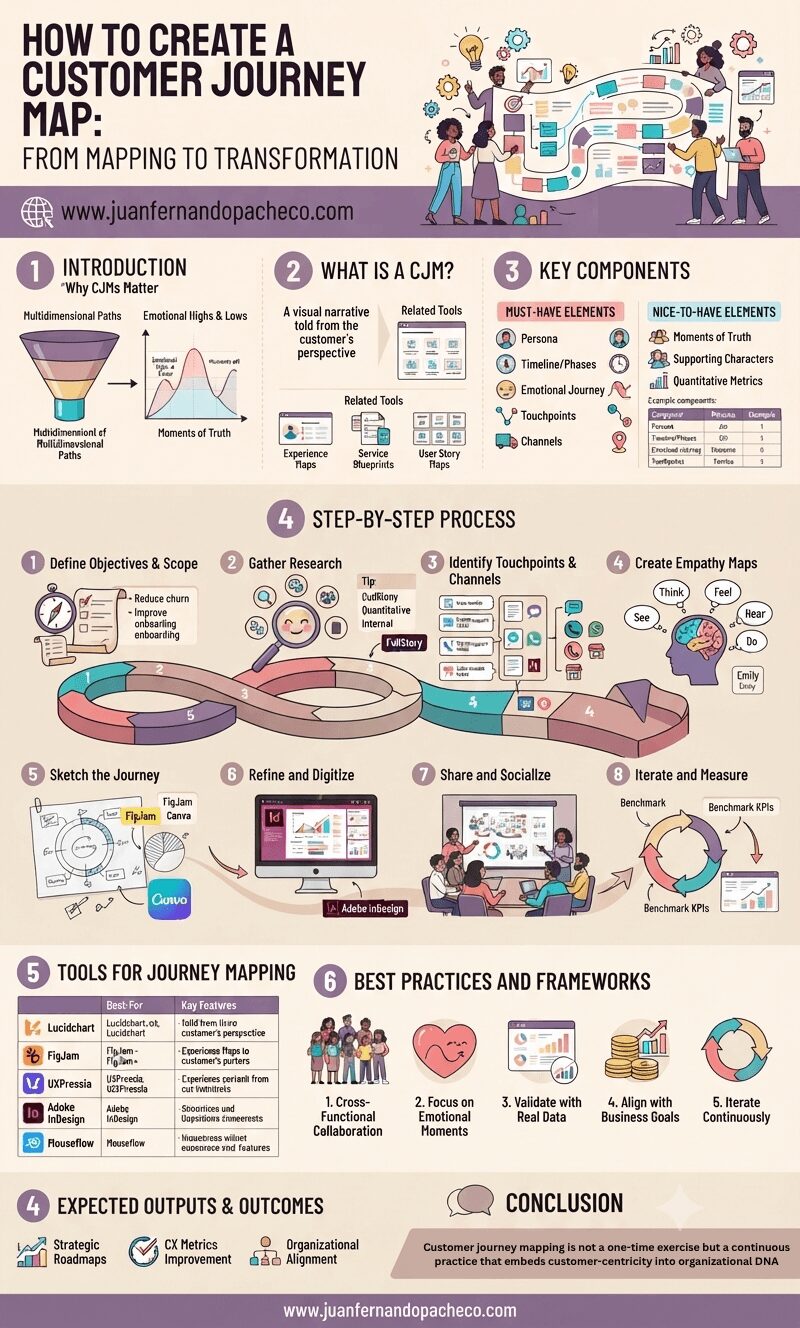
An intricate, vertically-oriented infographic detailing the eight-step process of creating a Customer Journey Map (CJM). The image includes sections on "Why CJMs Matter," "What Is a CJM," "Key Components," "Tools for Journey Mapping," and "Best Practices," using a color palette of lavenders, rose, and beige. It features illustrations of diverse CX teams, charts, a helical journey timeline, and the website www.juanfernandopacheco.com.

Customer journey mapping is not a one-time exercise but a continuous practice that embeds customer-centricity into organizational DNA.

By visualizing the intersection of human emotions and business processes, UX professionals can drive transformative change—turning fragmented interactions into cohesive, respectful experiences that build long-term loyalty.

As CX expectations escalate, the brands that thrive will be those who listen, adapt, and design journeys that resonate deeply with the people they serve.

An infographic titled "A Deep Dive into the 5 Strategy Archetypes" visualizing five strategic approaches—Classical, Visionary, Adaptive, Shaping, and Renewal—mapped against the axes of Predictability and Malleability. The graphic uses a pink and blue color scheme with illustrations like a chessboard, a rocket ship, a surfer, a conductor, and a phoenix.

The greatest risk in strategy is complacency—the unconscious application of a default approach. The framework of the five archetypes empowers us to move from a reactive stance to a proactive one. It provides a language to debate not just what we are doing, but why we are doing it and how it matches the world we operate in.

An infographic titled "CRAFT CLEAR INSIGHTS: THE STRATEGIST’S GUIDE TO FINDING MEANING IN DATA" presenting a four-stage framework for problem-solving. The flow moves from "Fuzzy Data" at the top through "Stage 1: Define," "Stage 2: Analyse," and "Stage 3: Synthesise" to "Stage 4: Solve" and "Impact" at the bottom. Visual elements include teams of UX designers and IT architects, data charts, affinity diagrams, a magnifying glass, a glowing key representing "Clear POV," and interlocking gears. The website "www.juanfernandopacheco.com" is featured throughout.

In a world saturated with data, the ability to craft clear insights is a superpower. It is the bridge between raw information and human understanding, between execution and strategy. It is what separates a feature factory from a truly impactful product team.

An infographic titled "Deconstructing the Customer Journey: A Strategic Layered Framework for Digital Success." It presents a four-layer model showing how different departments (Marketing, E-Shop, Customer Management, Logistics) and their respective touchpoints (Ads, Website, Hotline, Delivery) interact across the five customer journey stages (Awareness, Consideration, Acquisition, Service, Loyalty). The bottom section details how these interactions generate specific topics, KPIs (like Cart Abandonment Rate and First Contact Resolution), and emotions, leading to concrete ROI. References to "www.juanfernandopacheco.com" and "Bright Vessel" are visible at the bottom.

Customer Journey Layers is more than a diagram; it’s a philosophical shift from a customer-centric mindset to a customer-centric operating model. It acknowledges that every digital experience is a manifestation of your internal architecture—your technology, your processes, and your organizational alignment.

An infographic titled "Frame The Problem" illustrating the HTDQ storytelling method for strategic clarity. It uses the example of Clara, a local bookstore owner (Hero), who needs a sustainable business (Treasure) despite competition from online giants (Dragon), leading to the Quest question: "How might we help Clara...build a sustainable thriving business, despite her inability to compete on inventory size and delivery speed?" The infographic includes sections for best practices and essential tools, with attribution to www.juanfernandopacheco.com.

Framing the problem is the highest-leverage activity in any strategic endeavor. It is the art of asking the right question before desperately searching for answers. The HTDQ method provides a memorable, robust, and human-centered framework to master this art.