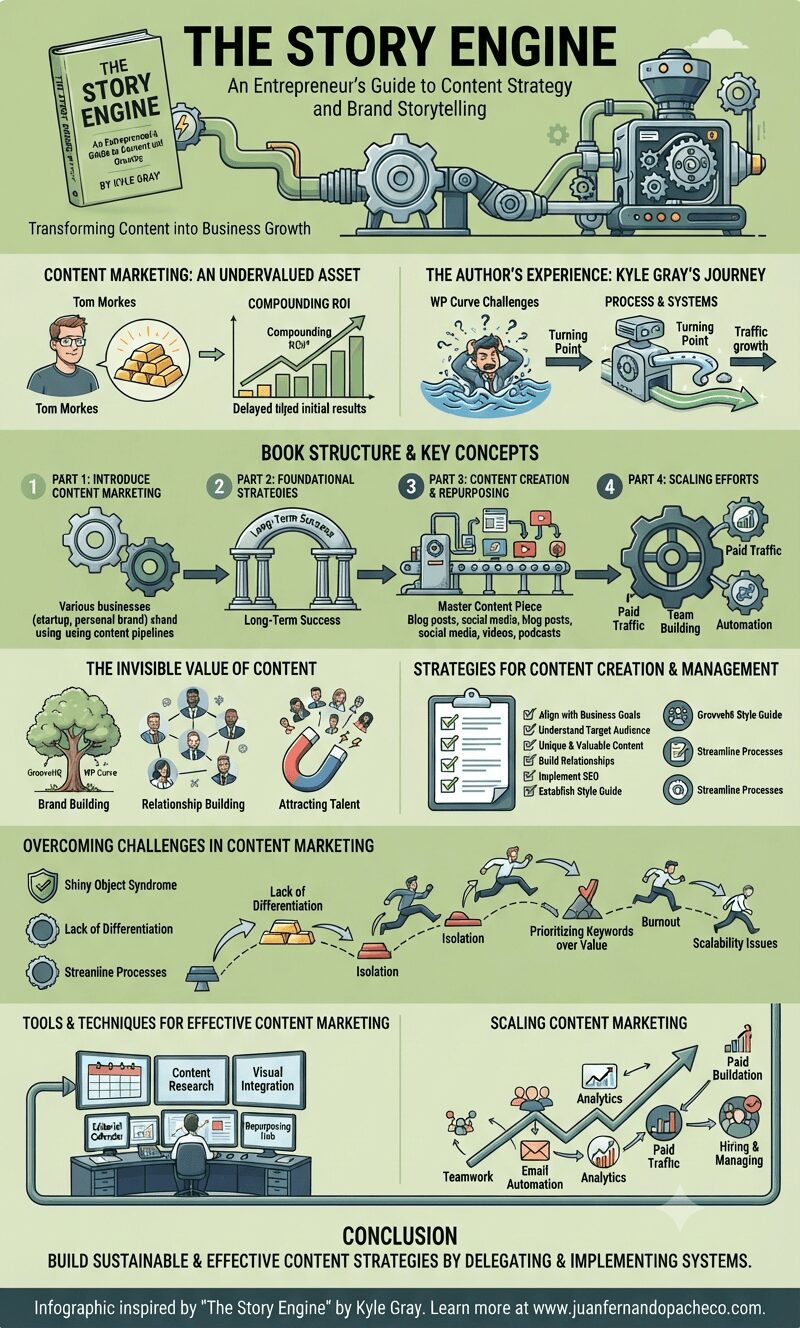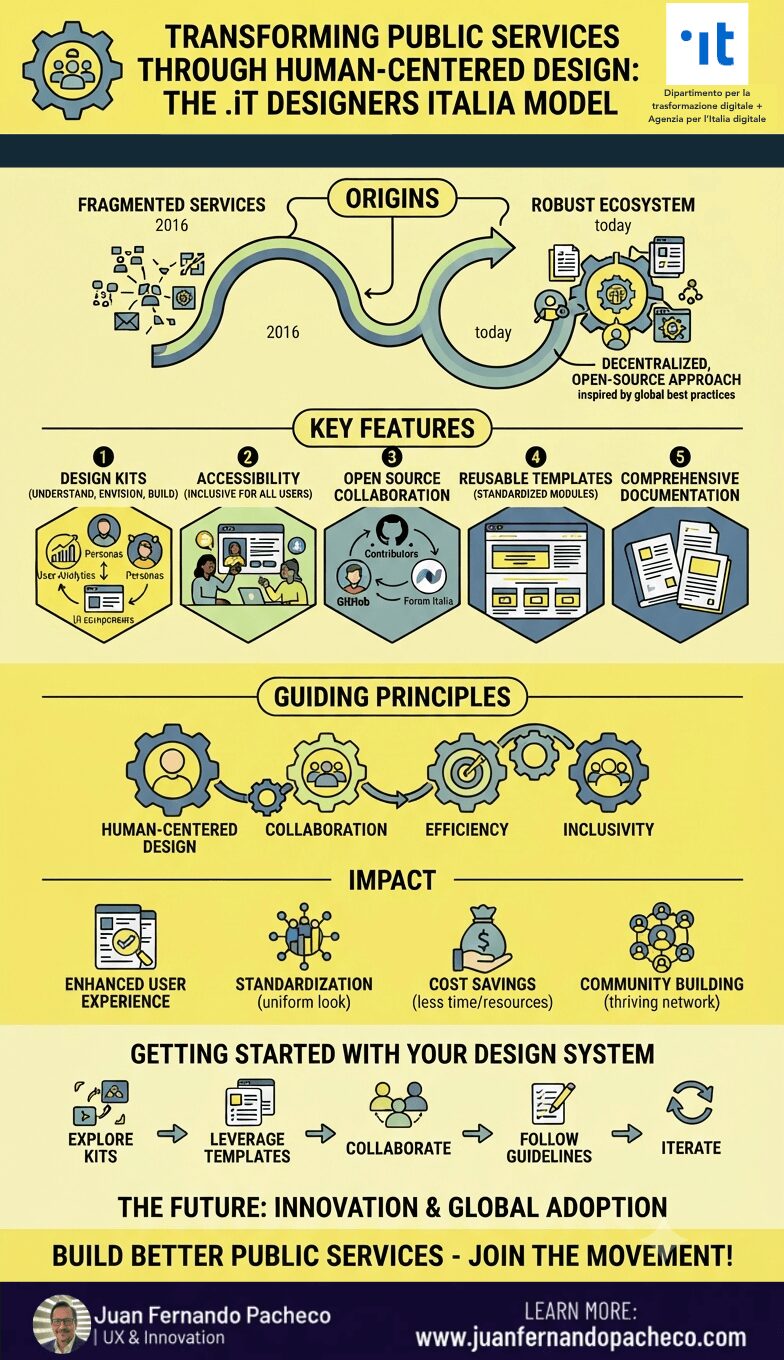
A comprehensive vertical infographic illustrating the four stages of Human-Centered Systems Thinking, using complex diagrams, charts, and illustrations to explain mapping, reframing, prioritizing interventions, and iterative testing.

Human-Centered Systems Thinking isn’t a checklist—it’s a mindset. By grounding systemic analysis in empathy and experimentation, we can redesign education, healthcare, and organizations to prioritize human dignity and resilience.

Start small: map a personal challenge, host a reframing workshop, or prototype a solution. The systems of tomorrow depend on the choices we make today.

A comprehensive vertical infographic titled "Designing Strategy: Uniting Rigor and Creativity" set against a light peach background with a dark green border. It presents a four-part framework for organizational success using illustrations, icons, and text. Part 1 shows identifying problems with a detective and the Five Whys. Part 2 covers winning conditions using a Strategy Canvas and prioritization matrix. Part 3 illustrates low-fidelity prototypes and experiments like A/B testing. Part 4 details alignment through roadmaps and agile teams. The bottom section lists key skills and a call to action, with references to www.juanfernandopacheco.com.

Designing strategy isn’t a one-time event—it’s a cycle of learning, adapting, and evolving. By blending analytical tools with creative methods, leaders can build strategies resilient enough for today’s volatility and visionary enough for tomorrow’s opportunities.

Start your next strategic session with a “How Might We” question. Then prototype, test, and iterate. The future belongs to those who design it.

A creative and disruptive infographic titled "Activating Strategy: Human-Centered Approaches for Bringing Strategy to Life," featuring sections on ownership, stakeholder engagement, testing, resources, and daily rituals, with the color palette #cacaaa background, #eec584, #c8ab83, #55868c, and #7f636e, and reference to www.juanfernandopacheco.com.

Activating strategy requires shifting from “planning” to “doing” through collaboration, experimentation, and agility. As Reed Hastings of Netflix says,

“Strategy is never done; it’s a living process”.

Start small, engage broadly, and iterate relentlessly.

An intricate infographic titled "What is User Co-creation: From Passive Subjects to Active Co-Producers," illustrating the historical evolution of design methodologies from User Centered Design (UCD) to User Experience (UX) and finally to User Co-creation (UC). The graphic uses a vibrant color palette and segmented arrows to flow through seven key sections, detailing principles, tools (e.g., LEGO Ideas, Starbucks, Miro, Figma), frameworks (Living Labs, Sanders & Stappers' Research Map), metrics (Social Capital), challenges, and future trends (AI-Driven, Decentralized Innovation). It includes a concluding quote from Don Norman and branding for www.juanfernandopacheco.com.

The shift from User Centred Design (UCD) to User Co-creation (UC) marks a democratization of innovation. By embracing Living Labs and participatory frameworks, designers can harness the collective genius of users. As Don Norman aptly stated:

“The real power of design lies not in solving problems, but in enabling people to solve their own.”

A comprehensive infographic titled 'VIRTUAL DESIGN AND DEVELOPMENT: Bridging UX, CX, and Innovation in Construction' that uses charts, diagrams, and illustrations to explain the role of User Experience (UX) and Customer Experience (CX) in the adoption of Virtual Design and Construction (VDC) and Building Information Modeling (BIM). The vertical graphic is structured in seven numbered sections: 1. The VDC/BIM Framework, 2. The Adoption Challenges (A UX/CX Lens), 3. Diffusion of Innovations: Crossing the Chasm, 4. Psychographics: Designing for User Mindsets, 5. Future Trends: AR/VR and CX Personalization, 6. Recommendations for UX Designers, and 7. Case Study: Finnish Construction (Matinaro & Liu, 2015). The infographic includes specific data from image_0.png, logos for software like Autodesk Revit and BIM 360, and concludes with a call to action to learn more at www.juanfernandopacheco.com.

VDC/BIM’s potential is undeniable, but its success hinges on human-centered design. By applying UX/CX principles—from progressive disclosure to psychographic segmentation—we can accelerate innovation diffusion and transform the construction industry.

An infographic titled 'Navigating the Stacey Matrix: Decision-Making in a Complex World' set against a light grey background with a dark red, grey, and olive color scheme. It features a large matrix with two axes: 'Agreement Among Stakeholders' (vertical) and 'Certainty of Outcomes' (horizontal). The matrix is divided into four quadrants with icons, characteristics, strategies, and examples: Top-Left 'Simple Challenges' (rationality), Top-Right 'Complicated Challenges' (expertise), Bottom-Left 'Complex Challenges' (emergence), and Bottom-Right 'Chaotic Challenges' (stabilize first). Below the matrix are sections on 'The Stacey Matrix in a Post-COVID, VUCA World' and 'Human-Centered Leadership: The Key to Complexity' with small illustrations of people. The footer includes the URL 'WWW.JUANFERNANDOPACHECO.COM'.

The Stacey Matrix is not just a tool—it’s a mindset shift. In a world where 73% of leaders cite complexity as their top challenge (per Gartner), mastering this framework requires courage to embrace ambiguity and humility to learn from failure.

A comprehensive, vertical infographic titled "UX Research Methods" detailing qualitative and quantitative methods, categorized by behavioral ("what people do") and attitudinal ("what people say"). The design uses a green, blue, and yellow color palette and features a central matrix connected to detailed panels for each method, including Usability Testing, A/B Testing, Interviews, and Analytics, concluding with case studies from Spotify, Amazon, and Google, and a reference to juanfernandopacheco.com.

UX research is not a one-size-fits-all process. By blending behavioral and attitudinal methods, designers can create holistic, user-driven solutions. Start small—try a five-second test or a quick survey—and scale as you gain confidence. Remember, the best designs are rooted in empathy and evidence.

A comprehensive infographic visualizing the "StoryVesting" business framework. It details the concentric EX (Employee Experience) and CX (Customer Experience) circles, leading to "Brand Euphoria," and includes sections on history, applications across functions (Digital Transformation, UX, IT, Employee Satisfaction), a retail case study, and challenges/future outlook. The design uses a purple-pink color palette and features references to Gallup, PwC, Buckley Barlow, and www.juanfernandopacheco.com.

StoryVesting™, a business transformation framework developed by RocketSource that bridges the gap between employee engagement and customer loyalty. By harmonizing these two pillars, organizations can unlock sustainable growth, even in volatile markets.