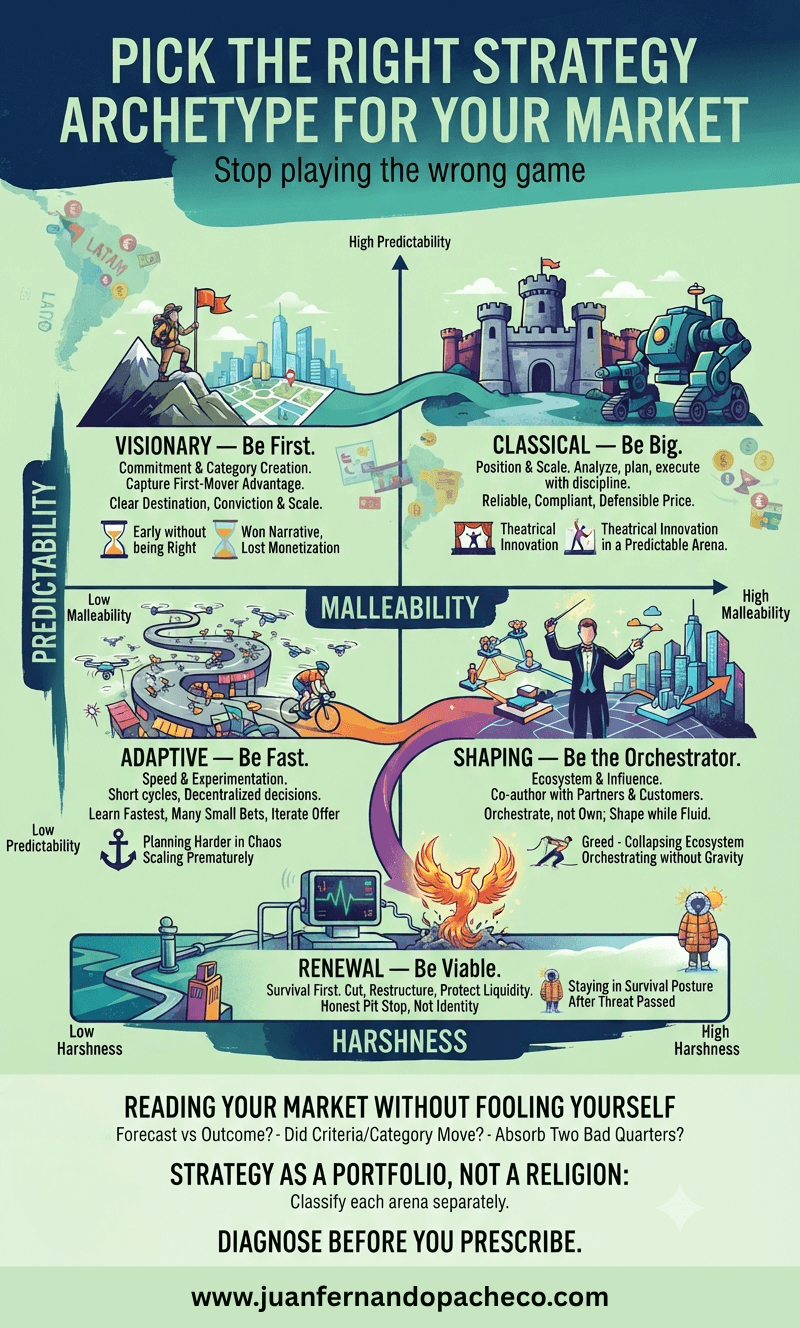
An infographic illustrating a strategic framework using a 3D quadrant chart and icons. It maps strategy types—Visionary, Classical, Adaptive, Shaping, and Renewal—against the environmental factors of Predictability, Malleability, and Harshness, with specific examples for Latin American and global markets.

Markets fail strategies more often than strategies fail markets. This post walks through the five strategy archetypes — classical, visionary, adaptive, shaping and renewal — and shows how to match each play to the predictability, malleability and harshness of your environment, with plain-spoken lessons from enterprise technology deals in Latin America.
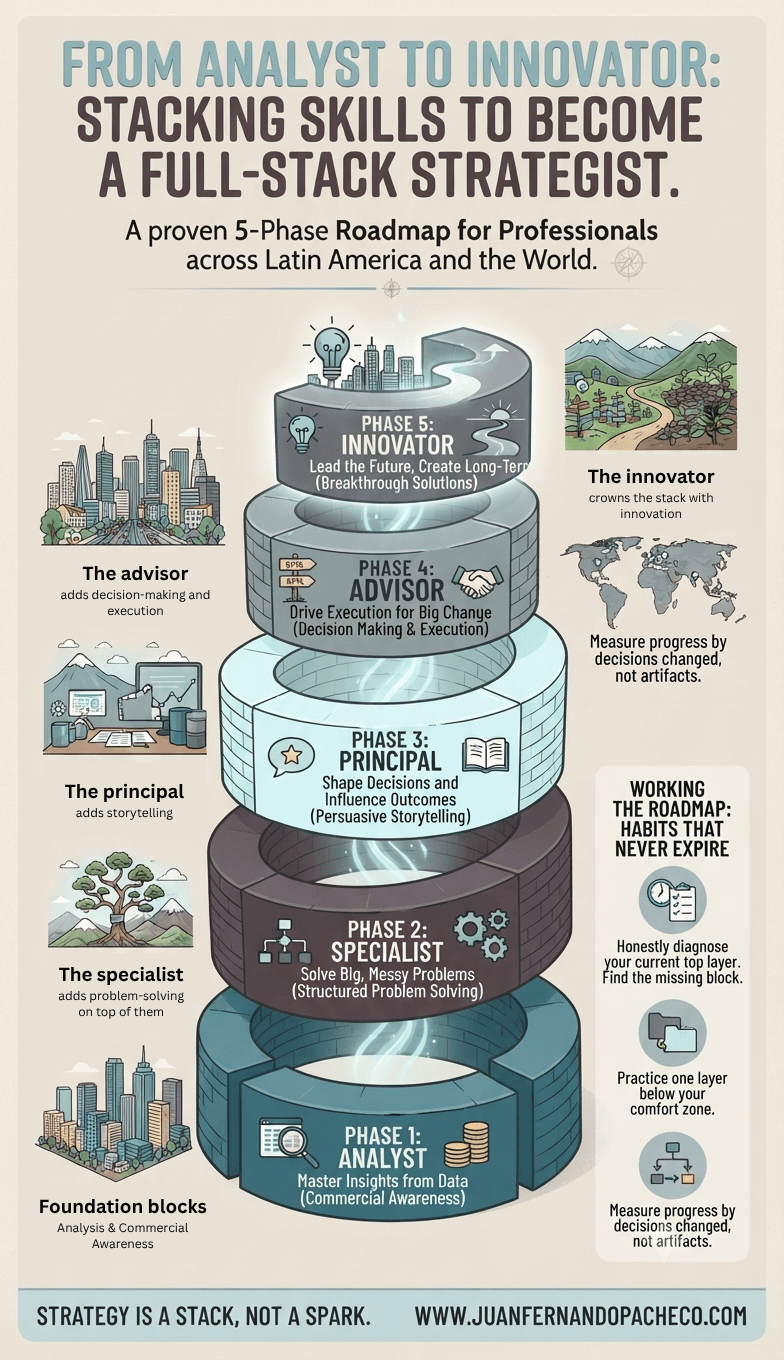
An infographic titled "FROM ANALYST TO INNOVATOR: STACKING SKILLS TO BECOME A FULL-STACK STRATEGIST." The image displays a five-tier cylindrical stack, ascending from a teal base to a grey top. Each tier represents a career phase with illustrative vignettes and text: Phase 1 (Analyst): "Master Insights from Data" (São Paulo skyline, data icons); Phase 2 (Specialist): "Solve Big, Messy Problems" (Andean tree, issue tree); Phase 3 (Principal): "Shape Decisions and Influence Outcomes" (Mexico City boardroom, book icon); Phase 4 (Advisor): "Drive Execution for Big Change" (Handshake, roadmap); and Phase 5 (Innovator): "Create Long-Term Value" (Lightbulb, agricultural model). To the right, a section details "WORKING THE ROADMAP: HABITS THAT NEVER EXPIRE." The bottom banner reads "STRATEGY IS A STACK, NOT A SPARK." and "WWW.JUANFERNANDOPACHECO.COM".

Strategy is not a title you are given; it is a stack of skills you build in a deliberate order. This post walks the five-phase roadmap — analyst, specialist, principal, advisor, innovator — and translates each layer into habits you can practice in any market, in any era.
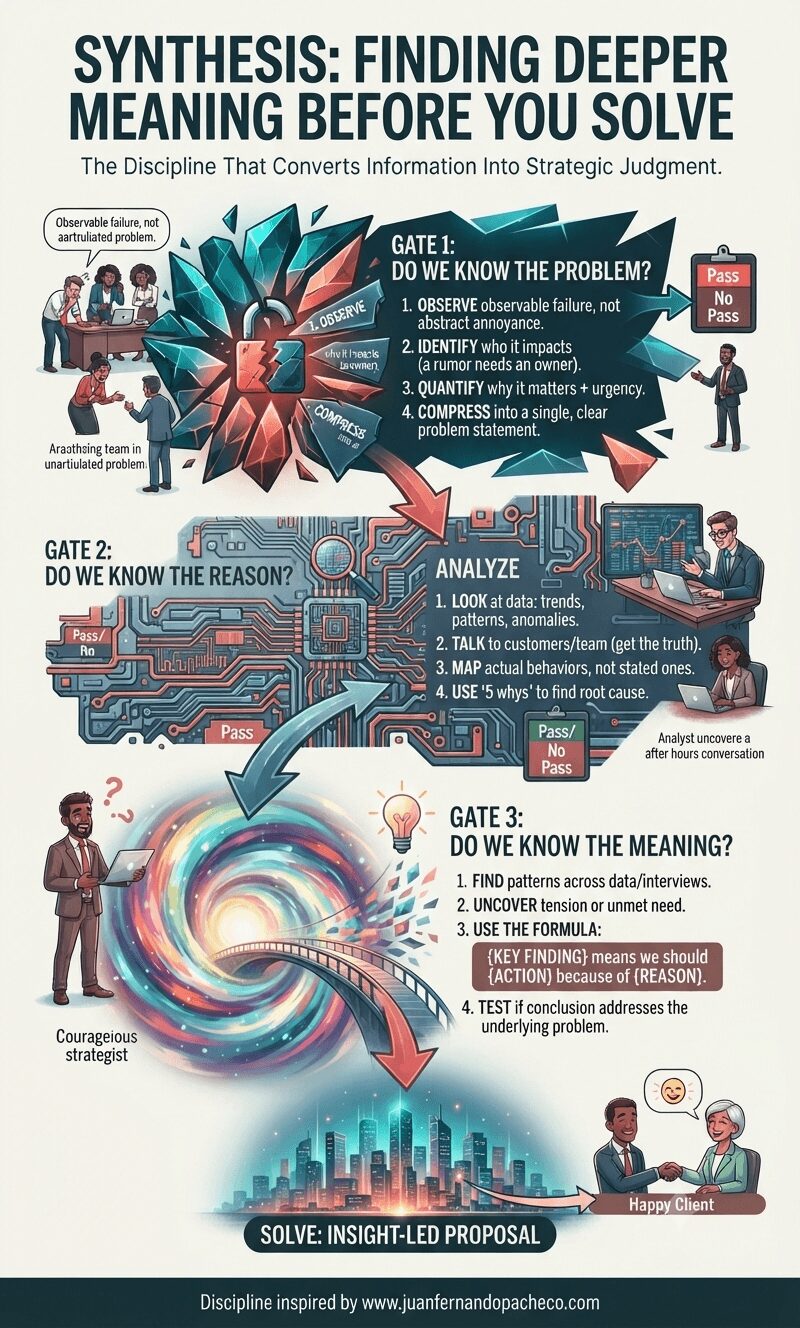
A vertical infographic titled 'SYNTHESIS: FINDING DEEPER MEANING BEFORE YOU SOLVE.' It visually maps a three-gate problem-solving journey. Gate 1, 'DO WE KNOW THE PROBLEM?', shows a team with a broken lock and a list of steps. Gate 2, 'DO WE KNOW THE REASON?', features a complex circuit board and data analysis scenes. Gate 3, 'DO WE KNOW THE MEANING?', uses a swirling vortex with a bridge and lightbulb to connect findings to action. The final section, 'SOLVE: INSIGHT-LED PROPOSAL', depicts a happy client. The background is cream, and the style is modern illustration with a professional LATAM/global feel. The footer references www.juanfernandopacheco.com.

A practical, evergreen field guide to the define–analyse–synthesise map: know the problem, know the reason, know the meaning, and only then solve. Written for product people, strategists and commercial leaders who want decisions that hold up for years, not quarters.
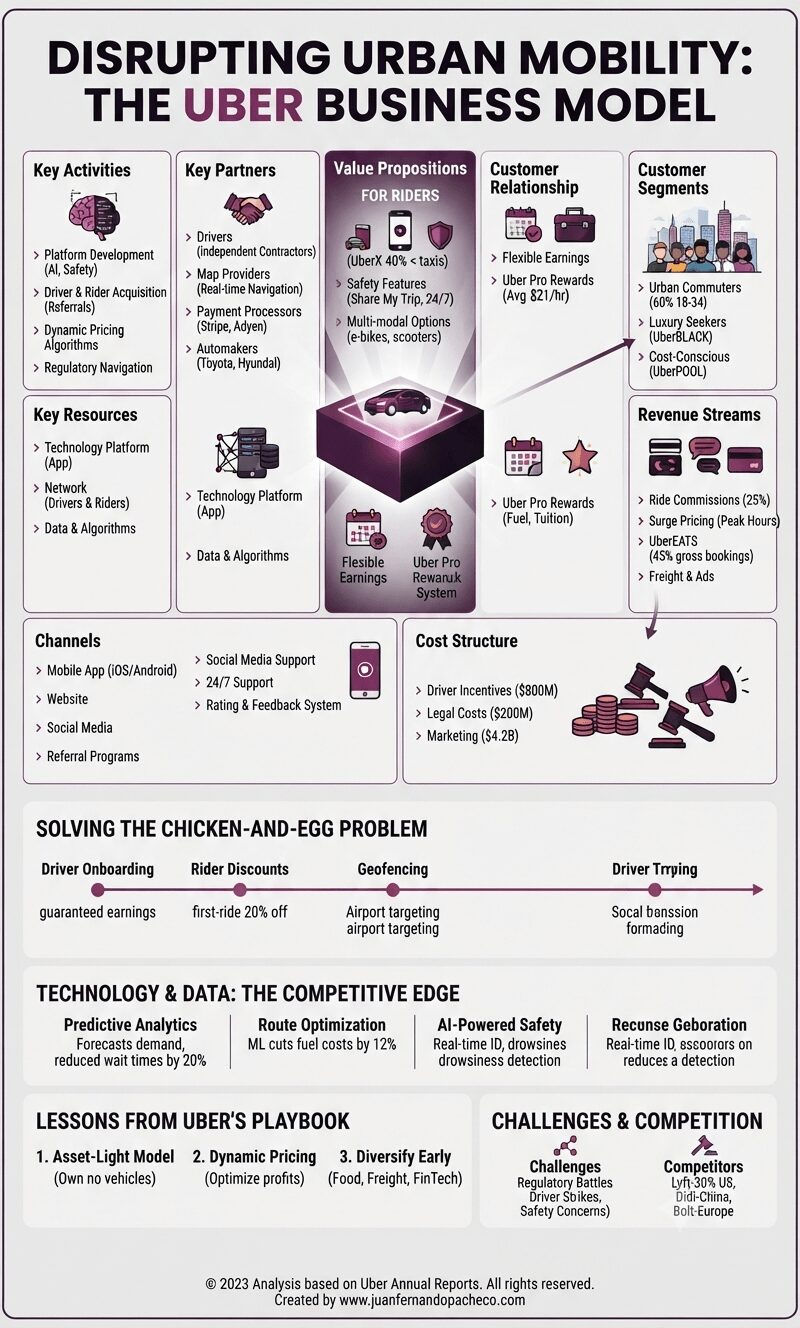
Infographic illustrating Uber's business model, including key activities, resources, partners, value propositions for riders and drivers, customer segments, revenue streams, and cost structure. The graphic features the text "DISRUPTING URBAN MOBILITY: THE UBER BUSINESS MODEL" and includes a footer with attribution to Juan Fernando Pacheco.

Uber’s relentless innovation—from self-driving cars to drone deliveries—positions it to dominate the future of mobility. By prioritizing scalability, data, and user experience, Uber remains a blueprint for disruptors worldwide.
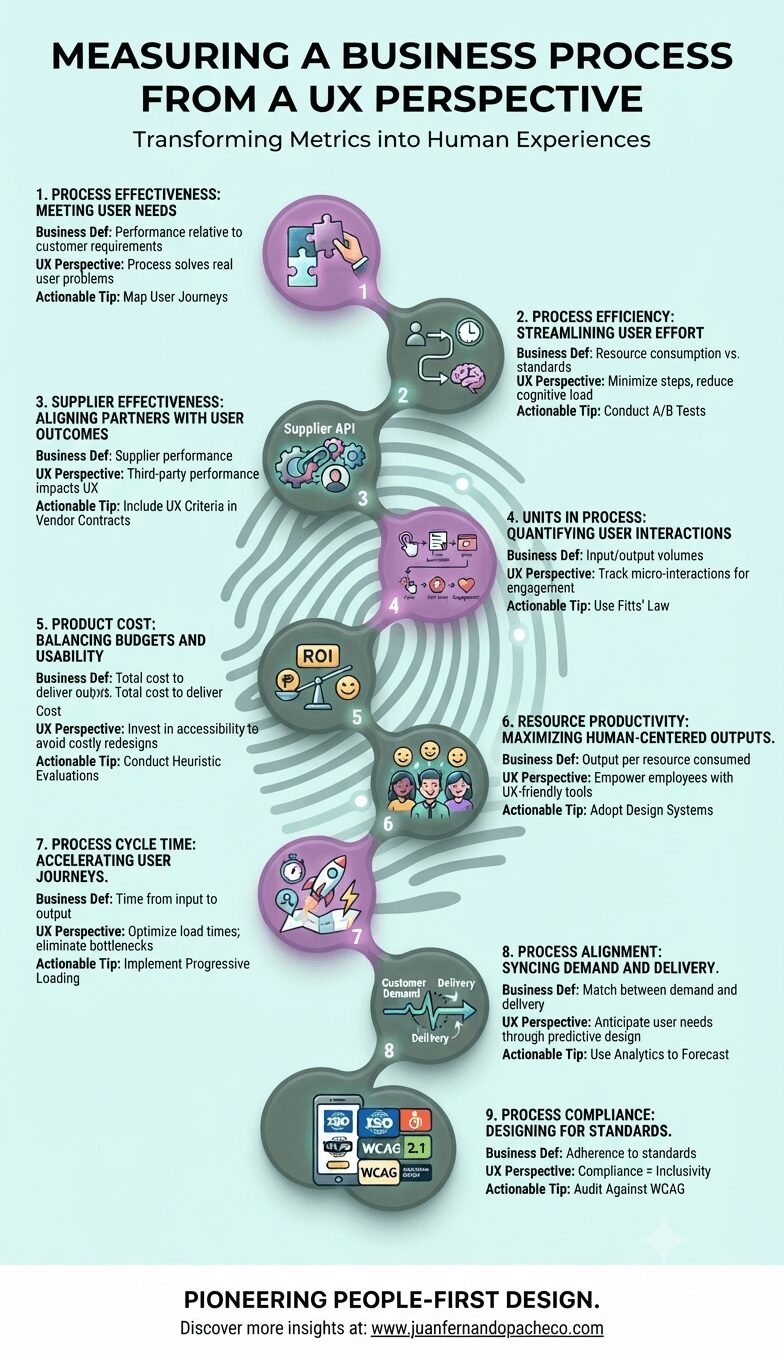
Infographic titled "Measuring a Business Process from a UX Perspective," featuring a vertical, winding, color-coded flow of nine distinct steps. Each step displays a number, a title, a small icon, and bullet points explaining the business definition, UX perspective, and actionable tip. The flow starts with "Process Effectiveness: Meeting User Needs" and ends with "Process Compliance: Designing for Standards." The color palette includes mint, teals, purples, and greys. The footer includes the text "PIONEERING PEOPLE-FIRST DESIGN" and the URL "www.juanfernandopacheco.com".

Measuring business processes through a UX lens transforms abstract metrics into human stories. By aligning efficiency with empathy, and compliance with inclusivity, organizations can create processes that delight users and drive ROI. As UX pioneers, our task is to ensure that every click, second, and dollar spent reflects a commitment to people-first design.