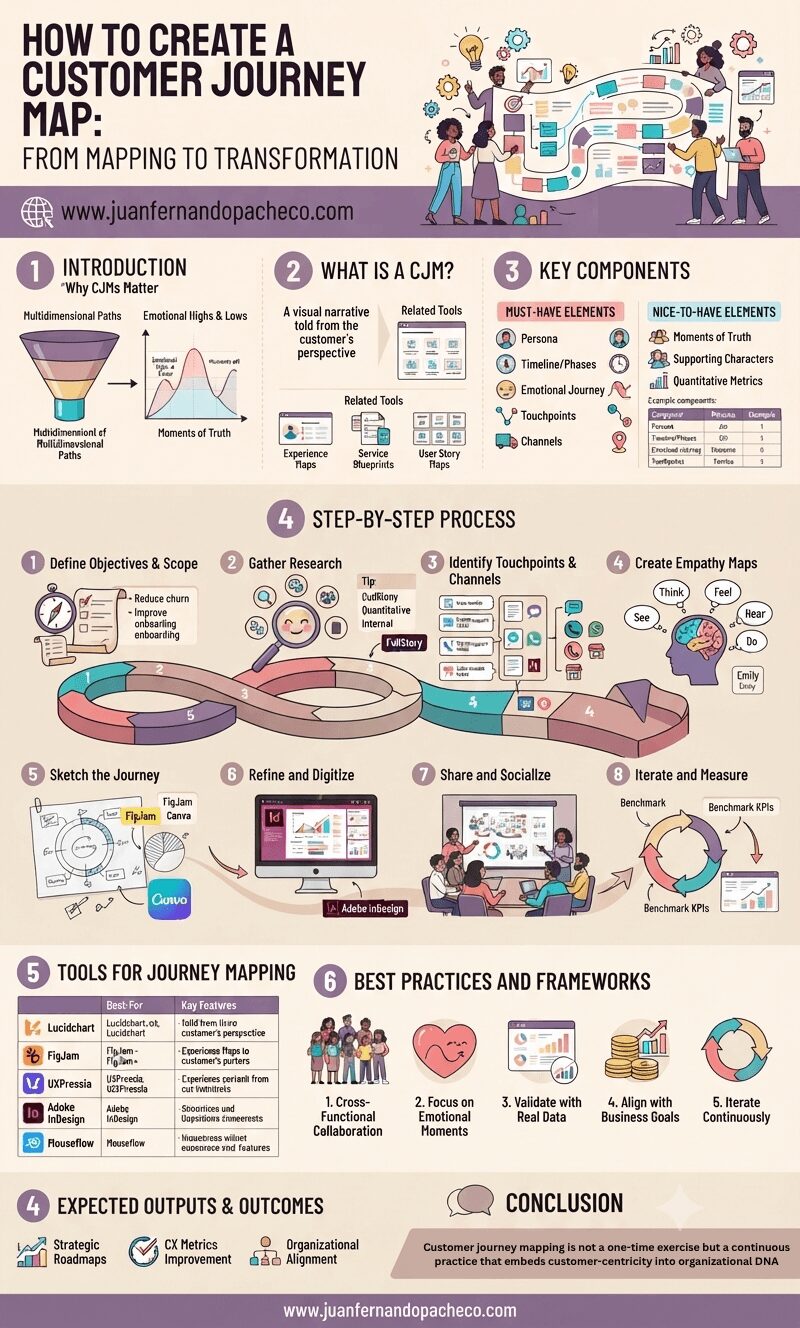
An intricate, vertically-oriented infographic detailing the eight-step process of creating a Customer Journey Map (CJM). The image includes sections on "Why CJMs Matter," "What Is a CJM," "Key Components," "Tools for Journey Mapping," and "Best Practices," using a color palette of lavenders, rose, and beige. It features illustrations of diverse CX teams, charts, a helical journey timeline, and the website www.juanfernandopacheco.com.

Customer journey mapping is not a one-time exercise but a continuous practice that embeds customer-centricity into organizational DNA.

By visualizing the intersection of human emotions and business processes, UX professionals can drive transformative change—turning fragmented interactions into cohesive, respectful experiences that build long-term loyalty.

As CX expectations escalate, the brands that thrive will be those who listen, adapt, and design journeys that resonate deeply with the people they serve.
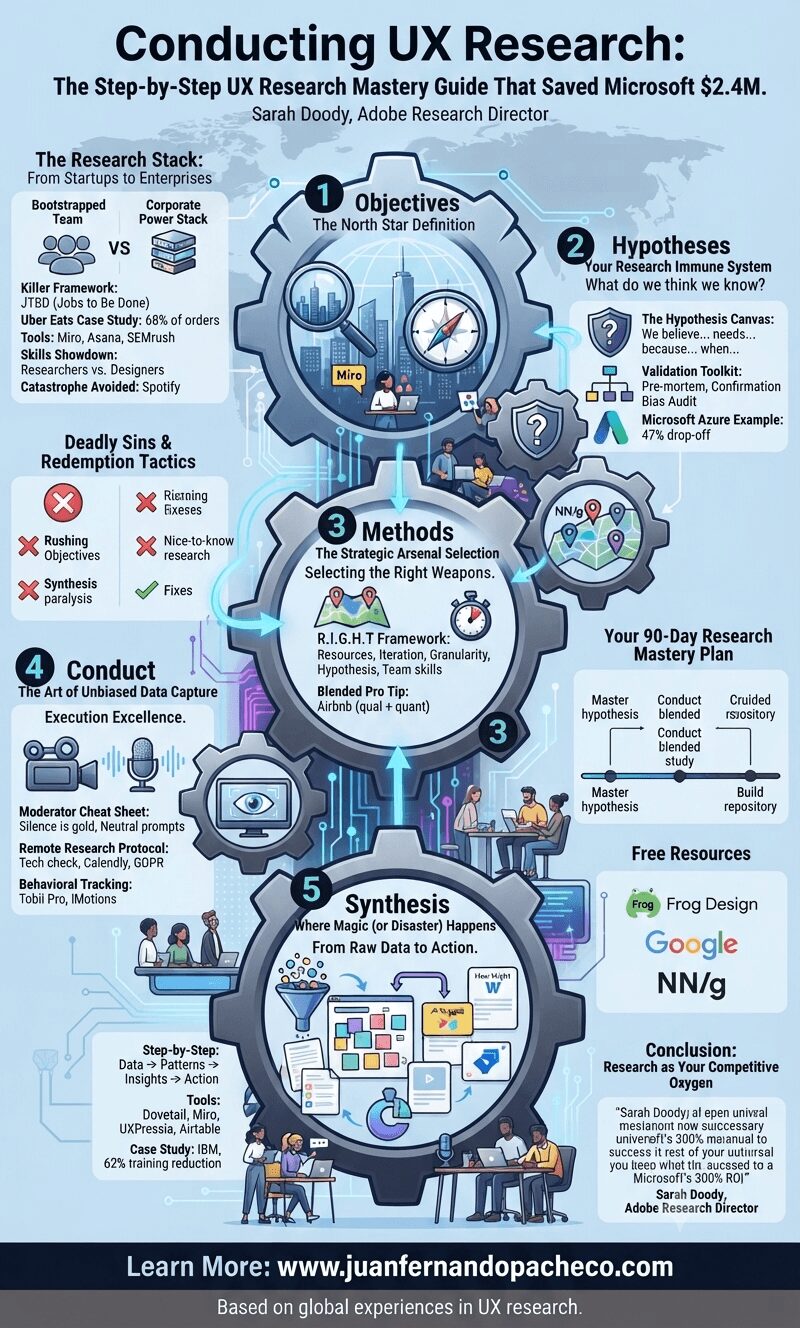
An intricate infographic with a blue and grey color scheme illustrating a five-step UX research process as a interconnected series of cogs. The title is "Conducting UX Research: The Step-by-Step UX Research Mastery Guide That Saved Microsoft $2.4M." Each cog represents a phase: 1. Objectives, 2. Hypotheses, 3. Methods, 4. Conduct, and 5. Synthesis. Detailed text within and around the cogs breaks down key frameworks (JTBD, R.I.G.H.T.), tools (Miro, Asana, Dovetail, etc.), case studies (Uber Eats, Spotify, Microsoft Azure, IBM), and skills. Additional sections include "The Research Stack," "Deadly Sins & Redemption Tactics," "Your 90-Day Research Mastery Plan," and "Free Resources." The footer displays "Learn More: www.juanfernandopacheco.com" and "Based on global experiences in UX research."

As a UX research lead, I’ve witnessed teams waste millions by skipping Step 2 (hypotheses). The Frog Design framework in your image isn’t academic theory—it’s a battle-tested survival blueprint. Let me walk you through each phase with real-world tactics you can implement tomorrow.