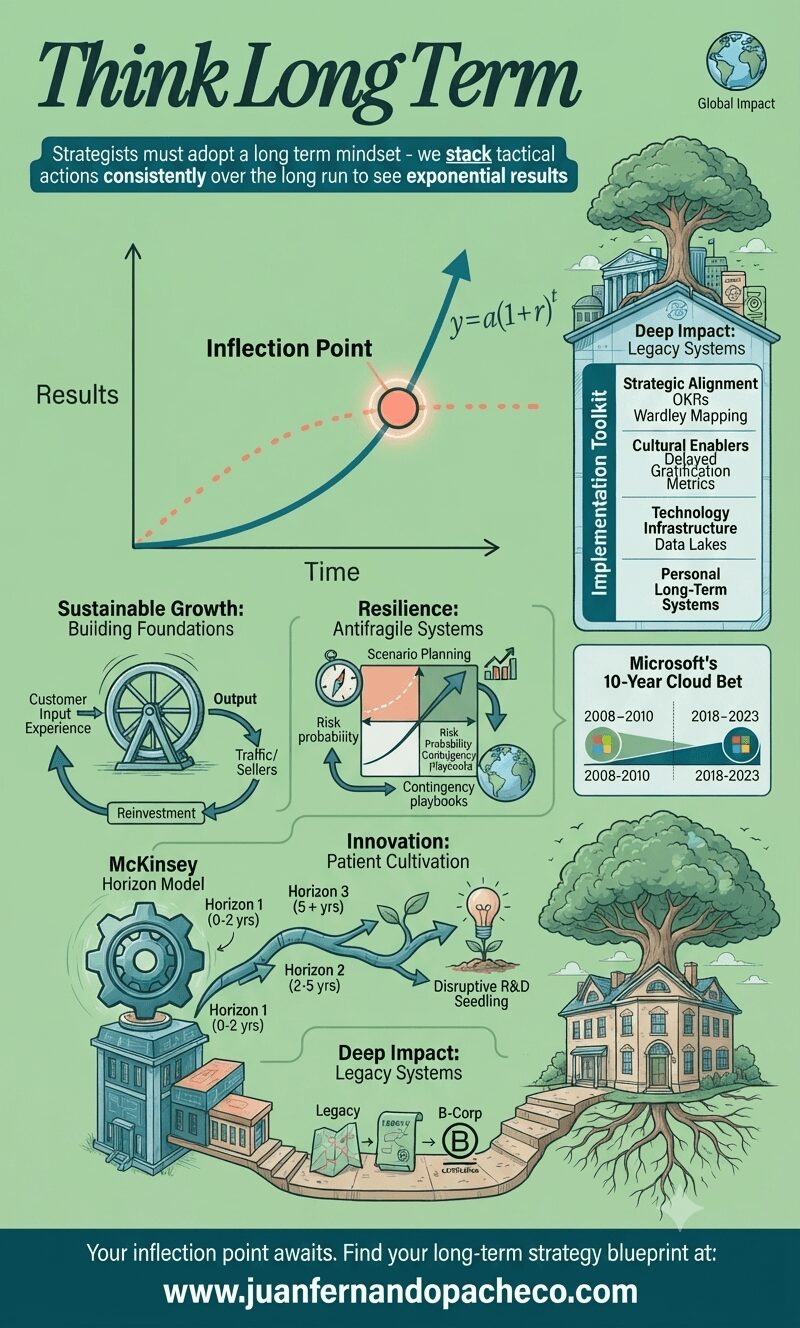
An intricate infographic titled 'Think Long Term,' illustrating a strategic blueprint for exponential growth based on the provided post. The central element is a graph showing an exponential teal curve labeled 'Long Term' overtaking a plateauing coral dotted line ('Short Term') at a glowing 'Inflection Point' (y=a(1+r)t). Below the graph, the strategy is broken into four detailed pillars: Sustainable Growth: Building Foundations, with a flywheel model (Customer Input → Output → Reinvestment). Resilience: Antifragile Systems, featuring a scenario planning matrix and contingency playbooks. Innovation: Patient Cultivation, depicted as a branching path (Horizon Model) leading to a 'Disruptive R&D Seedling.' Deep Impact: Legacy Systems, shown as a pathway from an initial structure to a mature B-Corp house with deep roots. A sidebar lists an 'Implementation Toolkit' (OKRs, Wardley Mapping, Data Lakes). A case study highlights 'Microsoft's 10-Year Cloud Bet.' The infographic ends with the footer text: 'Your inflection point awaits. Find your long-term strategy blueprint at: www.juanfernandopacheco.com.' The overall color scheme is a blend of soft green (#9ece9a), teal, and warm coral.

In the 1980s, IBM dominated mainframe computers while Microsoft focused on the embryonic PC market—a classic long-term gamble. Bill Gates famously said, 

“We always overestimate the change that will occur in two years and underestimate the change that will occur in ten.” 

This encapsulates the power of long-term thinking: the deliberate prioritization of future exponential gains over immediate rewards.
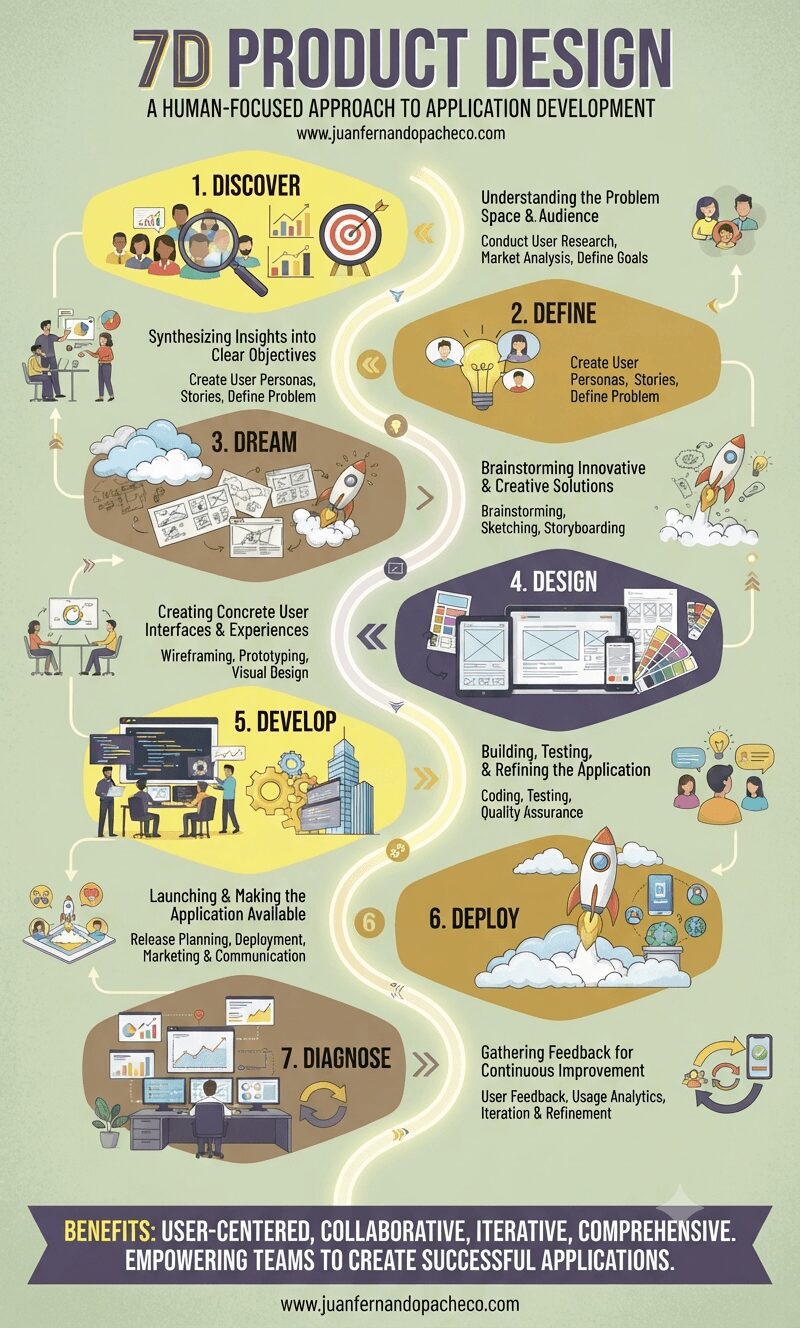
Infographic titled "7D Product Design: A Human-Focused Approach to Application Development" laid out vertically in seven numbered stages: Discover, Define, Dream, Design, Develop, Deploy, and Diagnose. Each section features icons and text summarizing the key activities and objectives of that phase. The overall framework emphasizes an iterative and collaborative process for creating user-centered applications.

7D Product Design offers a holistic and human-focused approach to application development. By emphasizing user needs, collaboration, and iterative development, it empowers teams to create successful applications that delight users and achieve business goals.
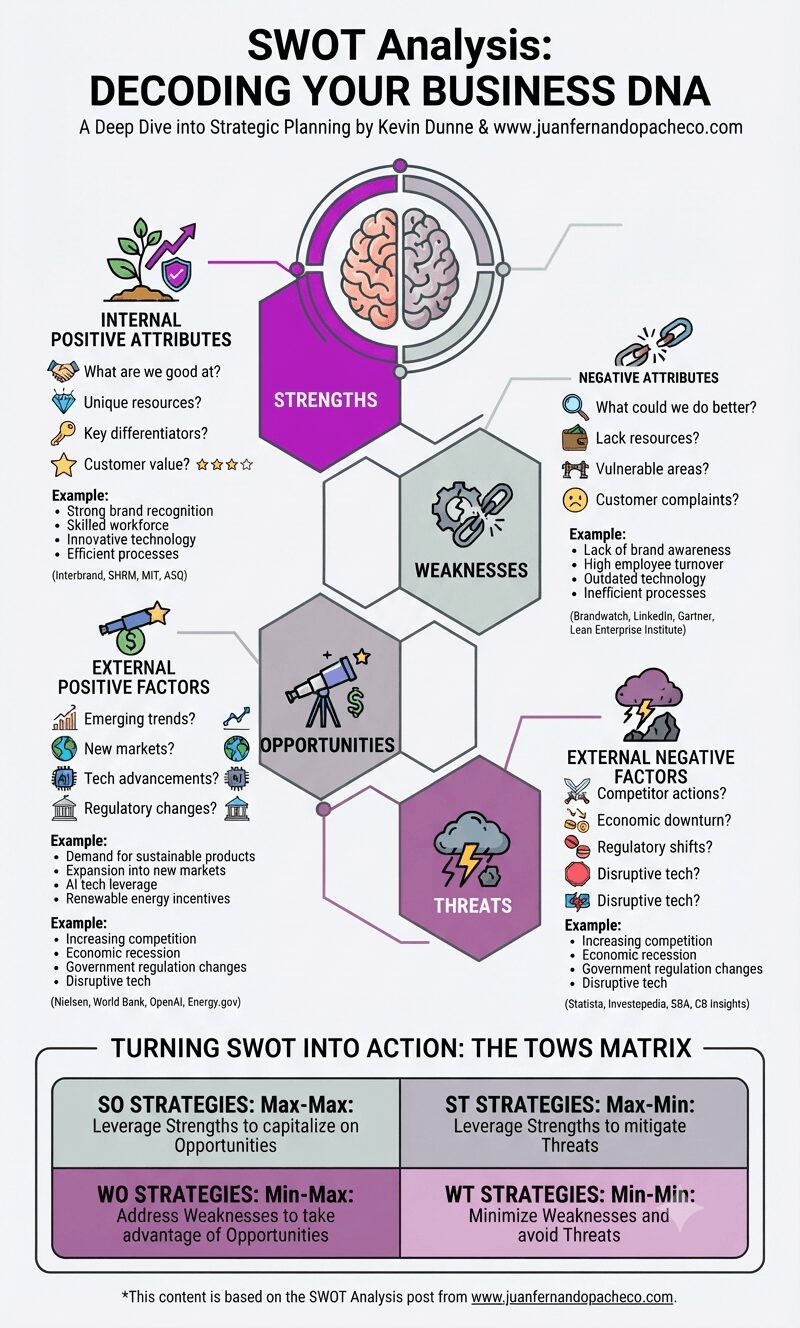
A vertical infographic titled "SWOT Analysis: Decoding Your Business DNA" featuring a central diagram of a brain split into internal (Strengths, Weaknesses) and external (Opportunities, Threats) factors. The top left shows 'Strengths' (plant, shield, gear) with examples like strong brand and skilled workforce. The top right shows 'Weaknesses' (broken gear, chain) with examples like high turnover and outdated tech. The bottom left shows 'Opportunities' (telescope, rising star) with examples like new markets and AI. The bottom right shows 'Threats' (storm cloud, lightning) with examples like recession and competition. A large bottom section outlines "The TOWS Matrix" with SO, ST, WO, and WT strategies. The design uses a modern palette of teals, lavender, and magentas on a light gray background.

A SWOT analysis is a powerful tool for understanding your organization’s current position and charting a course for future success. By systematically analyzing your strengths, weaknesses, opportunities, and threats, you can develop targeted strategies that leverage your competitive advantages and mitigate potential risks.
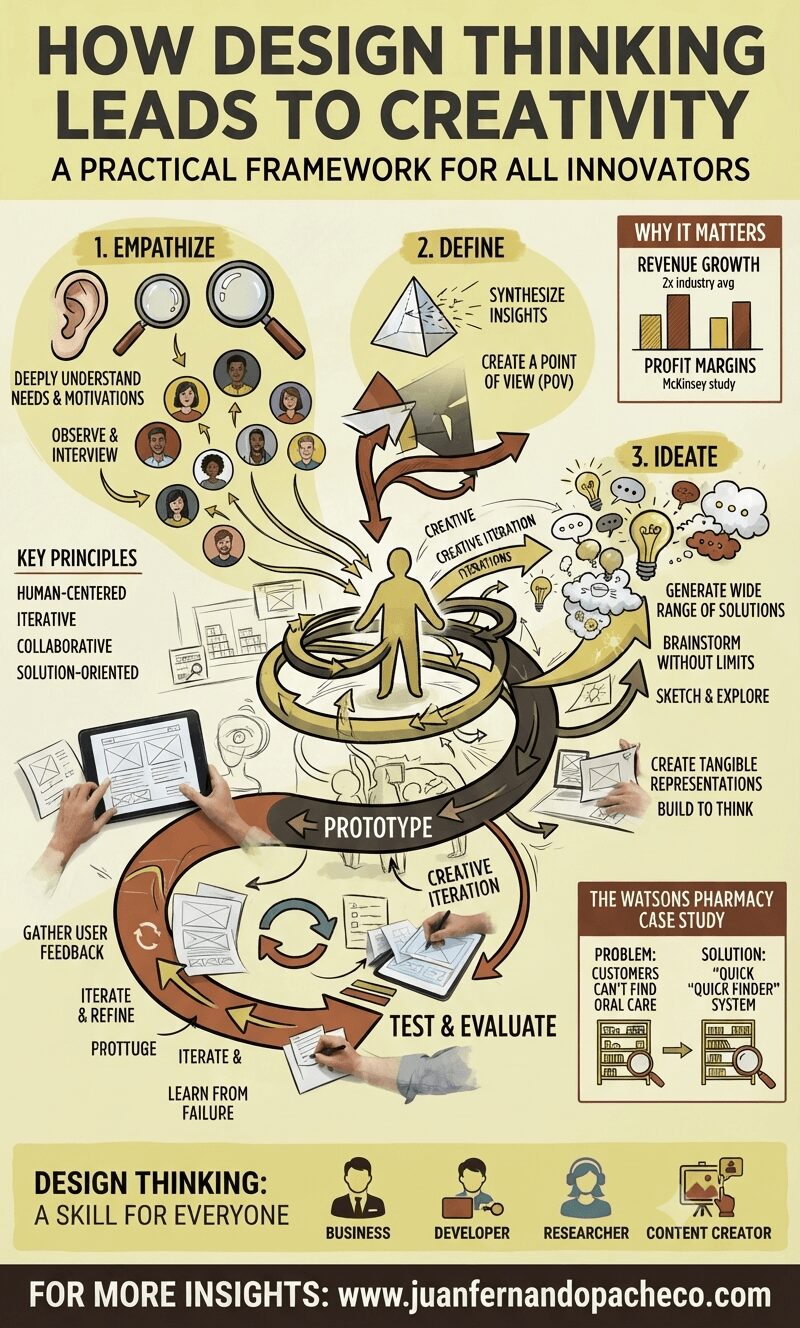
An intricate vertical infographic titled "How Design Thinking Leads to Creativity" (1,200px x 2,000+px). The design is structured around a central spiraling pathway connecting five distinct stages visualized with illustrations, icons, and text: 1. Empathize (ear, magnifying glasses, user portraits), 2. Define (pyramid, insights), 3. Ideate (lightbulbs, brain), 4. Prototype (hands with tablet and paper), 5. Test & Evaluate (feedback loops). The background is a pale yellow, using a color palette of mustards, browns, and charcoal. Sidebars detail "Why It Matters" (McKinsey study stats), "Key Principles," and a "Watsons Pharmacy Case Study." The bottom features a banner: "Design Thinking: A Skill for Everyone" with four persona icons and the URL "www.juanfernandopacheco.com".

Design Thinking isn’t limited to professional designers. It’s a valuable skill for anyone who wants to solve problems creatively and drive innovation. By adopting a human-centered approach and embracing the iterative nature of design thinking, individuals and organizations can unlock their creative potential and achieve remarkable results.
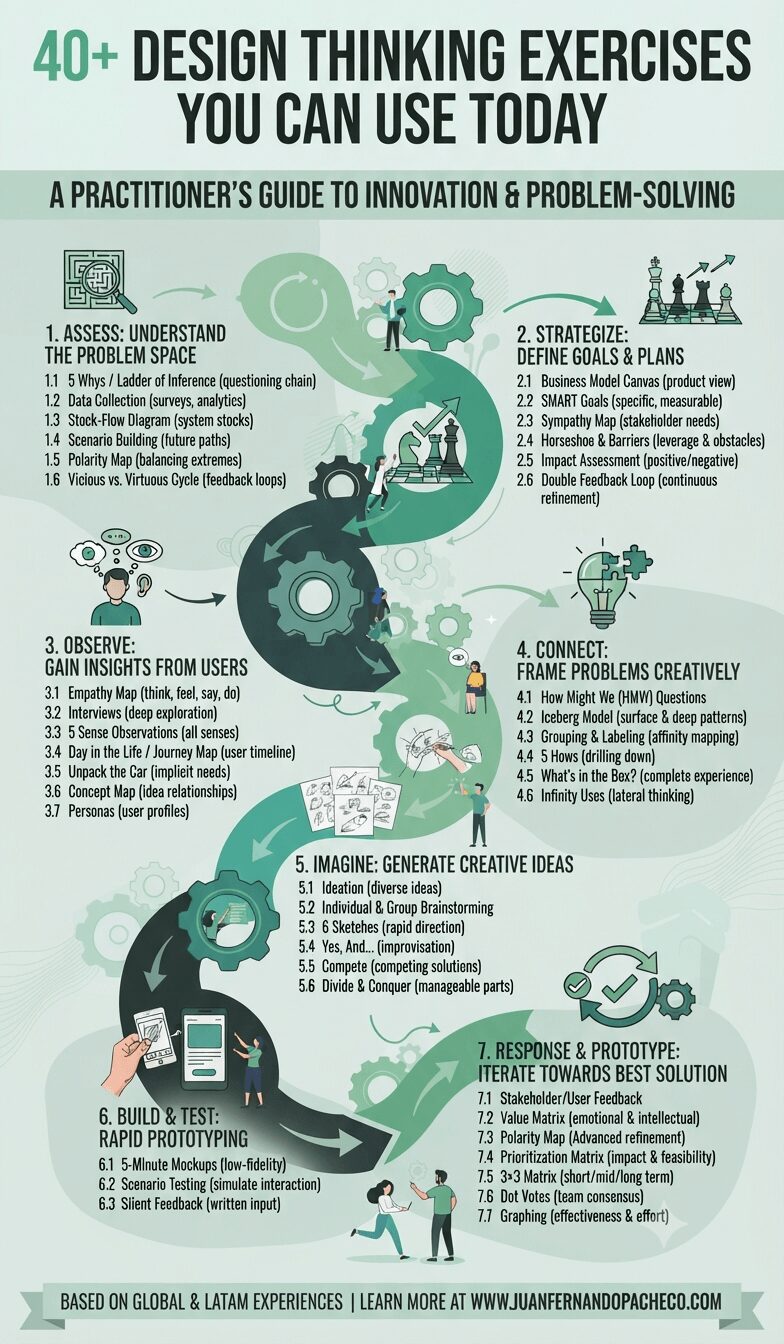
An infographic titled "40+ DESIGN THINKING EXERCISES YOU CAN USE TODAY" laid out as a continuous, winding flowchart across seven distinct phases: Assess, Strategize, Observe, Connect, Imagine, Build & Test, and Response & Prototype. Each section includes specific exercise lists and small illustrations of people engaging in design activities. The bottom banner includes the URL "WWW.JUANFERNANDOPACHECO.COM".

These 45+ design thinking exercises provide a practical and structured approach to problem-solving.

By incorporating these exercises into your UX practice, you can foster creativity, enhance user understanding, and drive impactful results.

Remember that design thinking is an iterative process, so don’t be afraid to experiment and adapt these exercises to fit your specific needs.