In an era where user experience (UX) defines competitive advantage, measuring business process metrics with UX principles is no longer optional—it’s essential.
While traditional business process measurements focus on efficiency and compliance, integrating a UX lens ensures these processes resonate with human needs, behaviors, and emotions.
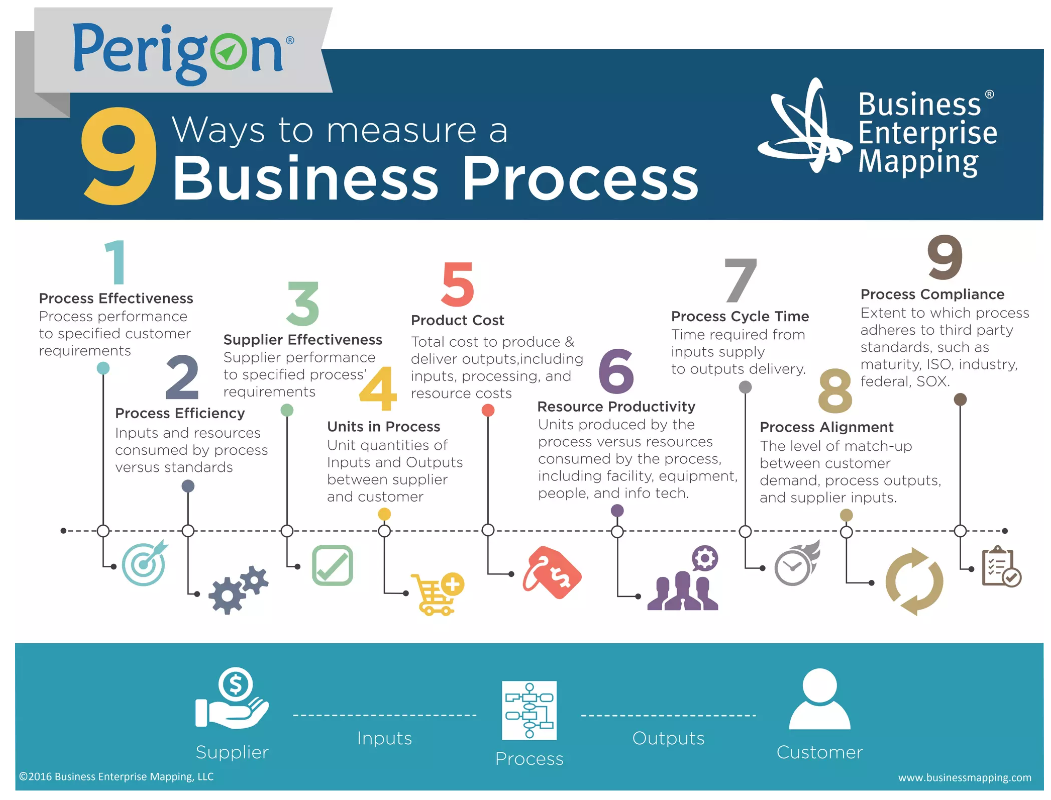
This post explores how the nine core business process metrics outlined by Business Enterprise Mapping can be reimagined through a UX perspective, bridging the gap between operational rigor and user-centricity.
1. Process Effectiveness: Meeting User Needs
Business Definition: Performance relative to customer requirements.
UX Perspective: Process effectiveness hinges on understanding user goals. A process is only effective if it solves real user problems.
- Example: A banking app’s loan approval process may meet internal benchmarks, but if users struggle to upload documents, the process fails.
- Measurement: Use usability testing and task success rates (Nielsen Norman Group, 2022).
- Tool: Hotjar’s session recordings to identify friction points.
Actionable Tip: Map user journeys to align process steps with user expectations. For instance, Airbnb redesigned its booking flow by prioritizing user trust, reducing drop-offs by 12% (Airbnb Design, 2016).
2. Process Efficiency: Streamlining User Effort
Business Definition: Resource consumption vs. standards.
UX Perspective: Efficiency isn’t just about speed—it’s about cognitive load. Minimize steps without sacrificing clarity.
- Example: Amazon’s 1-Click ordering reduces input fields, cutting checkout time by 50% (Amazon Science, 2020).
- Measurement: Time-on-task metrics via tools like Maze or Google Analytics.
- Framework: Hick’s Law: Fewer choices = faster decisions (Interaction Design Foundation, 2023).
Actionable Tip: Conduct A/B tests to compare streamlined vs. legacy workflows.
3. Supplier Effectiveness: Aligning Partners with User Outcomes
Business Definition: Supplier performance against process requirements.
UX Perspective: Suppliers (e.g., third-party APIs, vendors) impact UX. A slow payment gateway frustrates users, even if backend metrics look good.
- Case Study: When Slack integrated with Google Drive, they prioritized seamless file sharing, reducing user context-switching (Slack Engineering, 2021).
- Measurement: Monitor third-party service uptime and user feedback.
Actionable Tip: Include UX criteria in vendor contracts (e.g., API response time <2 seconds).
4. Units in Process: Quantifying User Interactions
Business Definition: Input/output volumes between supplier and customer.
UX Perspective: Track micro-interactions—clicks, form submissions, error rates—to gauge engagement.
- Example: Duolingo reduced lesson completion time by 20% by analyzing interaction units per session (Duolingo Blog, 2022).
- Tool: Mixpanel for granular event tracking.
Actionable Tip: Use Fitts’ Law to optimize button placement and reduce “units” of effort (Smashing Magazine, 2020).
5. Product Cost: Balancing Budgets and Usability
Business Definition: Total cost to deliver outputs.
UX Perspective: Cutting costs shouldn’t mean cutting corners. Invest in accessible design to avoid costly redesigns later.
- Case Study: Target’s $6M accessibility lawsuit underscores the cost of non-inclusive design (Forbes, 2019).
- Framework: ROI of UX: For every 1spentonUX,returnsrangefrom2 to $100 (Forrester, 2021).
Actionable Tip: Conduct heuristic evaluations to identify cost-saving UX improvements early.
6. Resource Productivity: Maximizing Human-Centered Outputs
Business Definition: Output per resource consumed.
UX Perspective: Empower employees with UX-friendly tools. Happy teams create better user experiences.
- Example: Salesforce’s Lightning Design System boosted designer productivity by 35% (Salesforce, 2020).
- Measurement: Employee Net Promoter Score (eNPS) and tool usability surveys.
Actionable Tip: Adopt design systems to reduce redundant work.
7. Process Cycle Time: Accelerating User Journeys
Business Definition: Time from input supply to output delivery.
UX Perspective: Users equate speed with competence. Optimize load times and eliminate bottlenecks.
- Case Study: Pinterest reduced perceived wait times by 40% using skeleton screens (Pinterest Engineering, 2018).
- Tool: Lighthouse for performance audits.
Actionable Tip: Implement progressive loading and prioritize above-the-fold content.
8. Process Alignment: Syncing Demand and Delivery
Business Definition: Match between customer demand, outputs, and inputs.
UX Perspective: Anticipate user needs through predictive design.
- Example: Netflix’s recommendation algorithm aligns content supply with viewer demand, driving 80% of watched hours (Netflix Research, 2023).
- Framework: Jobs-to-be-Done (JTBD) to align processes with user goals (JTBD Theory).
Actionable Tip: Use analytics to forecast user behavior and adjust processes dynamically.
9. Process Compliance: Designing for Standards
Business Definition: Adherence to third-party standards (ISO, WCAG).
UX Perspective: Compliance = inclusivity. Meeting WCAG 2.1 isn’t just legal—it’s ethical.
- Case Study: BBC’s accessibility overhaul increased mobile traffic by 30% (BBC Design, 2021).
- Tool: Axe DevTools for automated accessibility testing.
Actionable Tip: Audit designs against WCAG guidelines during prototyping.
Conclusion
Measuring business processes through a UX lens transforms abstract metrics into human stories. By aligning efficiency with empathy, and compliance with inclusivity, organizations can create processes that delight users and drive ROI. As UX pioneers, our task is to ensure that every click, second, and dollar spent reflects a commitment to people-first design.
Further Reading: