Uber’s rise from a San Francisco startup to a global transportation behemoth is a masterclass in disruptive innovation. With a market cap of $58.71 billion (as of January 2023) and over 93 million active users, Uber’s business model has redefined urban mobility.
This blog dissects Uber’s strategy using the Business Model Canvas framework, explores its revenue streams, and uncovers lessons for entrepreneurs.
Uber’s Origins: From “Everyone’s Private Driver” to a Mobility Ecosystem
Founded in 2009 by Garrett Camp, Oscar Salazar, and Travis Kalanick, Uber began as UberCab, a luxury car service. The idea was simple: tap a button, get a ride. Today, under CEO Dara Khosrowshahi, Uber operates in 70+ countries, offering services from ride-hailing to food delivery (UberEATS) and freight logistics (Uber Freight).
Key Milestones:
- 2011: Expanded beyond San Francisco to New York, Paris, and Toronto.
- 2014: Launched UberPOOL, introducing carpooling to reduce costs.
- 2017: Acquired Postmates, bolstering UberEATS’ dominance.
- 2023: Testing autonomous vehicles and drone deliveries.
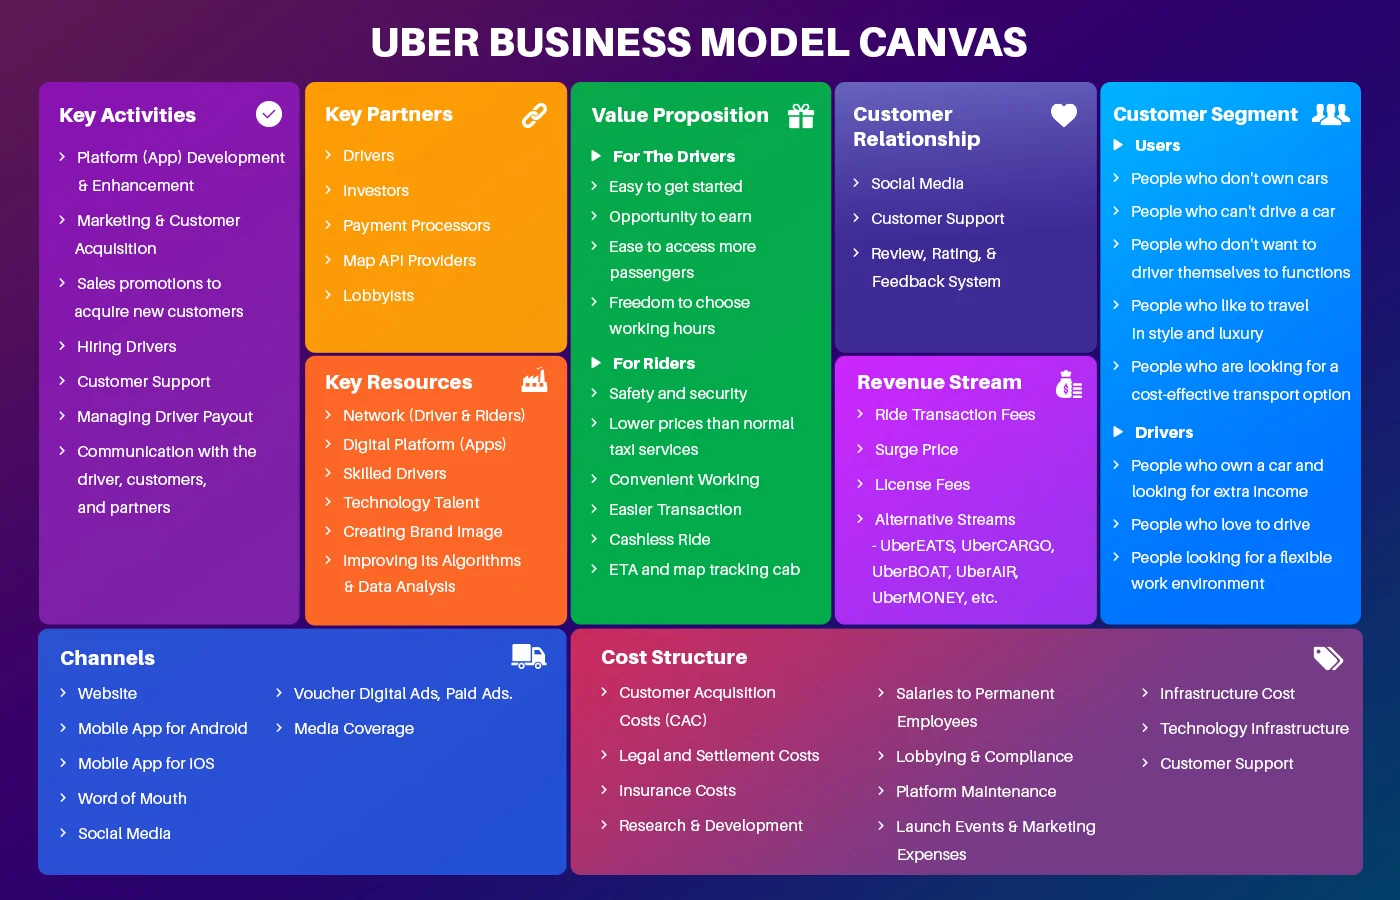
Uber Business Model Canvas: A Deep Dive
1. Key Activities
Uber’s operations hinge on:
- Platform Development: Continuous app upgrades (e.g., AI-driven ETAs, safety features).
- Driver & Rider Acquisition: Referral bonuses ($500M in driver incentives in 2022).
- Dynamic Pricing Algorithms: Surge pricing balances supply-demand.
- Regulatory Navigation: Lobbying for favorable laws in markets like London and California.
Reference: Uber’s 2022 Annual Report highlights R&D spending of $2.3 billion.
2. Key Partners
- Drivers: 3.9 million drivers globally, classified as independent contractors.
- Map Providers: Reliance on Google Maps API for real-time navigation.
- Payment Processors: Partnerships with Stripe and Adyen for seamless transactions.
- Automakers: Collaborations with Toyota and Hyundai for vehicle leasing programs.
Case Study: Uber’s partnership with Google Maps reduced driver navigation errors by 15% (Forbes, 2021).
3. Value Propositions
- For Riders:
- Affordability (UberX costs 40% less than taxis in NYC).
- Safety features (Share My Trip, 24/7 support).
- Multi-modal options (e-bikes, scooters).
- For Drivers:
- Flexible earnings (drivers average $21/hour post-expenses).
- Uber Pro rewards (fuel discounts, tuition coverage).
Statistic: 78% of drivers cite flexibility as their primary motivator (JPMorgan Chase Institute).
4. Customer Segments
Uber targets:
- Urban Commuters: 60% of users are aged 18–34 (Statista, 2023).
- Luxury Seekers: UberBLACK users spend 2.5x more per ride.
- Cost-Conscious Travelers: UberPOOL reduces fares by 30%.
5. Revenue Streams
Uber’s $31.8 billion revenue (2022) stems from:
- Ride Commissions: 25% fee per ride (varies by region).
- Surge Pricing: Contributed $1.2 billion during peak hours in 2022.
- UberEATS: 45% of gross bookings ($13.4 billion) in 2022.
- Freight & Advertising: $5.3 billion from Uber Freight and in-app ads.
Future Bets: Autonomous vehicles (ATG division raised $1 billion from Toyota) and Uber Air (eVTOL partnerships).
6. Cost Structure
- Driver Incentives: $800 million annually.
- Legal Costs: $200 million spent on lawsuits and settlements in 2022.
- Marketing: $4.2 billion on user acquisition (Sensor Tower, 2023).
How Uber Solved the Chicken-and-Egg Problem
Entering new markets requires balancing driver supply and rider demand. Uber’s strategy:
- Driver Onboarding: Guaranteed earnings for first 50 rides.
- Rider Discounts: 20% off first rides 300 million annually).
- Geofencing: Targeting high-demand areas like airports and business districts.
Example: In Jakarta, Uber offered free rides to corporate employees, securing 10,000 users in 3 months.
Uber’s Competitive Edge: Technology & Data
- Predictive Analytics: Algorithms forecast demand 15 minutes ahead, reducing wait times by 20%.
- Route Optimization: Machine learning cuts fuel costs by 12% (Uber Engineering Blog).
- AI-Powered Safety: Real-time ID checks and drowsiness detection.
Challenges & Controversies
- Regulatory Battles: Banned in Denmark and Hungary over labor laws.
- Driver Strikes: Protests for better wages in the U.S. and UK.
- Safety Concerns: 3,045 sexual assault reports in 2019 (Uber’s Safety Report).
Competitors: Lyft, Didi, and Beyond
- Lyft: Holds 30% U.S. market share, focuses on sustainability (100% electric fleet by 2030).
- Didi Chuxing: Dominates China with 550 million users.
- Bolt: Offers lower commissions (15%) in Europe.
Market Share: Uber controls 71% of the global ride-hailing market (Second Measure, 2023).
Lessons from Uber’s Playbook
- Asset-Light Model: Own no vehicles—scale faster.
- Dynamic Pricing: Use data to optimize profits.
- Diversify Early: Expand into food, freight, and fintech (Uber Money).
How to Build an App Like Uber
- MVP Features: Real-time tracking, in-app payments, ratings.
- Tech Stack: React Native for cross-platform apps, AWS for scalability.
- Monetization: Commission fees, surge pricing, subscriptions.
Toolkit:
- Map Integration: Google Maps Platform ($200/month for 40,000 requests).
- Payment Gateway: Stripe (2.9% + $0.30 per transaction).
Conclusion: Uber’s Road Ahead
Uber’s relentless innovation—from self-driving cars to drone deliveries—positions it to dominate the future of mobility. By prioritizing scalability, data, and user experience, Uber remains a blueprint for disruptors worldwide.
References: