Aligning Interfaces with Mental Models for Seamless Experiences
As digital landscapes grow increasingly complex, mapping remains one of UX design’s most powerful yet underutilized tools. At its core, mapping refers to the relationship between controls and their effects—both in the physical layout of interfaces and the conceptual models users form. When a thermostat’s “up” button increases temperature, that’s effective mapping. When an app’s navigation defies user expectations, that’s cognitive friction.
With 20 years in UX Design, I’ve witnessed how strategic mapping transforms confusing products into intuitive experiences. This deep dive explores mapping’s theoretical foundations, practical techniques, and evaluation frameworks—equipping you to bridge the gap between user cognition and interface design.
I. The Theoretical Foundations of Mapping
1. Mental Models: The User’s Cognitive Blueprint
Mental models are internal representations users build to predict system behavior. As Jakob Nielsen explains, they’re based on beliefs, not facts, and are shaped by prior experiences. Key characteristics include:
Personalization: Each user’s model differs (e.g., older users may map “swipe” to physical book gestures, while Gen Z maps it to TikTok).
Inertia: Established models resist change, making consistency critical (e.g., 89% of users expect the shopping cart icon to lead to checkout).
Mismatch Risks: When designers’ models diverge from users’, errors multiply. Nomad Lane’s auto-added shipping insurance violated the “cart-as-user-control” model, causing frustration.
2. Cognitive Load: The Battle for Mental Resources
Every interface imposes intrinsic load (essential processing) and extraneous load (unnecessary effort). Poor mapping exacerbates extraneous load through:
Recall Over Recognition: Forcing users to remember functions rather than recognizing visual cues.
Visual Clutter: Competing elements (e.g., dual search bars on University of Michigan Library’s site).
Solution: Leverage existing mental models to reduce learning curves. Skeuomorphism—like using door metaphors in children’s apps—capitalizes on real-world familiarity.
3. Mapping Principles in UX Heuristics
Nielsen’s usability heuristics directly support mapping:
#2: Match with Real World: Use natural language (e.g., “Trash” instead of “Delete Permanent Storage”).
#4: Consistency & Standards: Align with platform conventions (e.g., iOS back gestures vs. Android).
#6: Recognition Over Recall: Make actions/options visible (e.g., breadcrumb trails).
II. Core UX Mapping Techniques
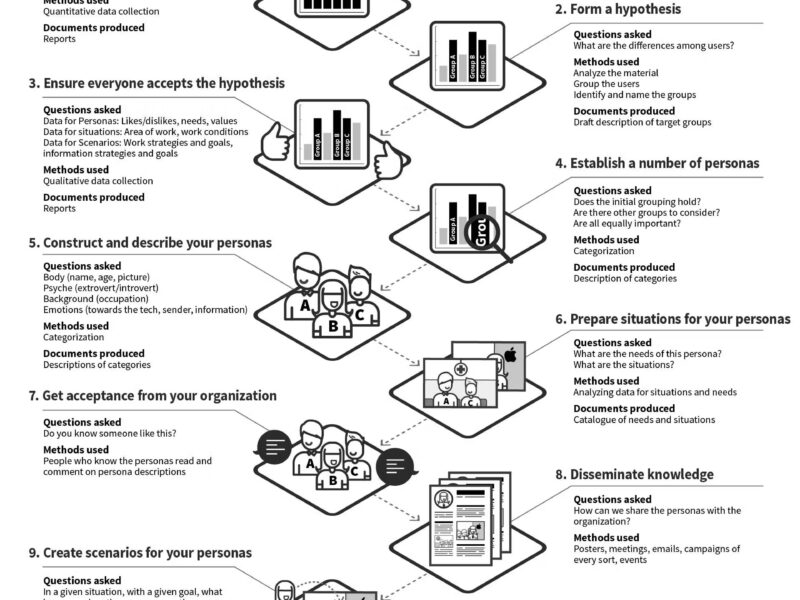
1. Empathy Mapping: Decoding User Cognition
Purpose: Externalize user attitudes during specific tasks.
Structure: Quadrants for “Says,” “Thinks,” “Feels,” “Does.”
Inputs: User interview transcripts, behavioral observations.
Output: 1:1 map per persona identifying pain points (e.g., “Thinks: ‘Why can’t I find pricing?'”).
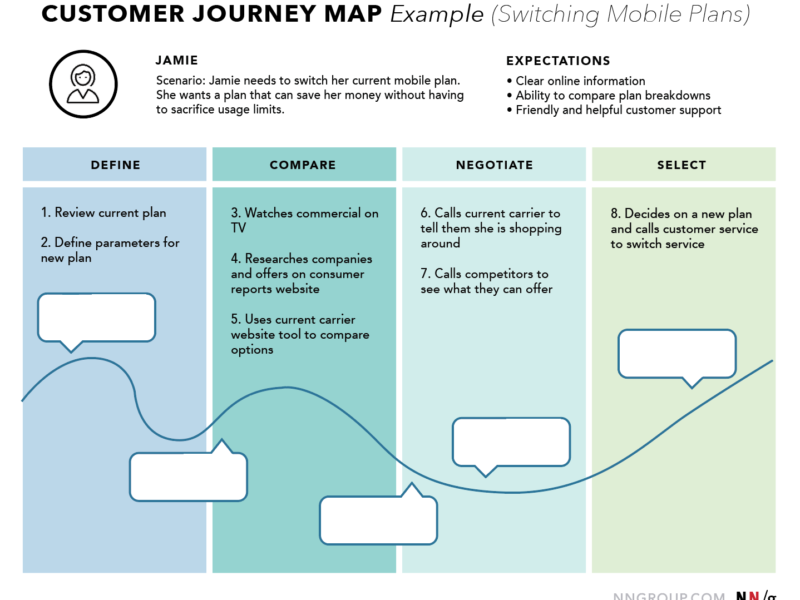
2. Journey Mapping: Sequencing Touchpoints
Purpose: Visualize a persona’s end-to-end interaction with a product/service.
Structure: Swimlanes for phases, actions, thoughts, emotions.
Inputs: Analytics data, support logs, usability tests.
Output: Timeline highlighting pain points (e.g., emotion dips at checkout) and ownership assignments.
Best Practice: Start with current-state (“as-is”) maps before future-state (“to-be”).
Example:
Phase: Checkout
Action: Clicks “Buy Now”
Thought: “Will this charge me immediately?”
Emotion: Anxiety
3. Experience Mapping: Generalizing Behaviors
Purpose: Capture broad human behaviors independent of specific products.
Structure: Similar to journey maps but tool-agnostic (e.g., mapping “online appointment booking” across healthcare apps).
Use Case: Baseline for industry-wide patterns before designing custom journeys.
4. Service Blueprinting: Exposing Organizational Mechanics
Purpose: Reveal behind-the-scenes processes enabling user journeys.
Structure: Swimlanes for:
Customer actions
Frontstage (employee/UI interactions)
Backstage (internal processes)
Support (third-party APIs/tools)
Inputs: Stakeholder workshops, system architecture diagrams.
Output: Gap analysis (e.g., “Insurance verification causes 48-hour delays”).
Table: Mapping Technique Comparison
| Type | Focus | Scale | Key Output |
|---|---|---|---|
| Empathy Map | User mindset | Single interaction | Pain point hypotheses |
| Journey Map | Product interaction | Task-specific | Touchpoint optimization roadmap |
| Experience Map | Human behavior | Cross-platform | Industry UX benchmarks |
| Service Blueprint | Organizational flow | Service ecosystem | Process bottlenecks |
III. The Mapping Process: Inputs, Tools, and Outputs
1. Inputs for Effective Mapping
User Research: Interviews, surveys, behavioral analytics.
Content Inventory: Audit existing copy/media for terminology alignment.
Business Goals: KPIs (e.g., “Reduce support calls by 25%”) to prioritize mappings.
2. Toolstack for Execution
Collaboration: FigJam, Miro for real-time co-creation.
Prototyping: Sketch (low-fi), Axure (hi-fi interactive maps).
Information Architecture: Card sorting via OptimalSort, tree testing.
3. Outputs and Artifacts
Current-State Maps: Highlight friction points (e.g., “Users abandon at step 3 due to ambiguous labels”).
Future-State Blueprints: Redesigned flows with annotated improvements.
Prioritization Matrices: Effort/impact scores for proposed changes.
4. Best Practices
Iterate Early: Test low-fi maps with users before high-fi refinement.
Cross-Functional Workshops: Include support, engineering, and marketing to break silos.
Hybrid Fidelity: Start with paper sketches, evolve to digital prototypes.
IV. Mapping to Mental Models: Practical Applications
1. Navigation Design
Problem: Users associate “Back” with undo, but some apps navigate hierarchically.
Solution: Mirror browser back-button behavior in web apps. Use Android’s predictive back animations to preview destinations.
2. Form and Control Layout
Problem: Sliders that invert expectations (e.g., right=lower volume).
Solution: Natural mapping—spatial (up=more), cultural (green=go), or symbolic (+=expand).
3. Error Prevention
Problem: Users accidentally paying for shipping insurance.
Solution: Match the “cart as user-controlled space” model with opt-in toggles instead of preselected add-ons.
V. Evaluation: Validating Your Mappings
1. Cognitive Walkthroughs
Purpose: Assess learnability for new users.
Process:
Define tasks (e.g., “Update patient address”).
For each step, ask:
Will users try the right action?
Will they notice it’s available?
Will they associate it with the goal?
Will they see progress after acting?
Tool: Spreadsheets recording pass/fail per step.
2. Heuristic Evaluation
Purpose: Benchmark against usability principles.
Process: 3–5 evaluators independently flag violations (e.g., “Inconsistent label: ‘Billing’ vs. ‘Invoice'”).
Output: Severity-ranked list of issues.
Table: Evaluation Method Comparison
| Method | Focus | Effort | Best For |
|---|---|---|---|
| Cognitive Walkthrough | Learnability | Medium | Novel/complex workflows |
| Heuristic Evaluation | General usability | Low | Standard UIs |
| Usability Testing | Real-user behavior | High | Validation pre-launch |
VI. Overcoming Common Mapping Pitfalls
Conflicting User Feedback
Solution: Weight input by user segments (e.g., prioritize frequent shoppers over one-time buyers).
Scope Creep in Journey Maps
Solution: Set “phase boundaries” (e.g., map only from “awareness” to “purchase”).
Over-Reliance on Hypotheses
Solution: Blend hypothesis-based mappings with research-backed data within 2 sprint cycles.
VII. The Future of Mapping: AI and Adaptive Interfaces
Emergent technologies are reshaping mapping:
Generative UI: AI interfaces that adapt layouts to individual mental models (e.g., repositioning settings based on usage patterns).
AR Spatial Mapping: Overlaying digital controls onto physical objects (e.g., turning a wrench icon to “tighten” a virtual valve).
Biometric Feedback: Using eye-tracking/fNIRS to detect cognitive load during journey testing, auto-flagging mapping mismatches.
Conclusion: Mapping as Strategic Advantage
Mapping transcends diagramming—it’s the art of translating cognition into interface. By anchoring designs in mental models, we reduce cognitive friction, build trust, and accelerate task completion. Start small: pick one critical user journey, blueprint its current state, then redesign one touchpoint using empathy-driven insights. Remember, even the most advanced AI relies on the foundational principle this all builds from: when controls map to human intuition, interfaces disappear, and users thrive.
Further Resources:
Nielsen Norman Group’s UX Mapping Cheat Sheet
Interaction Design Foundation’s Information Architecture Guide
Norman, D. A. (2013). The Design of Everyday Things. Revised Edition.
“Being human-centered is an additional cost, but it’s fundamental to creating ethical, sustainable solutions.”
— David Benyon, Professor of Human-Computer Interaction