The Strategist’s Secret to Asymmetric Results
We’ve all felt the pressure: do more, innovate faster, cut costs, increase revenue—all with limited resources. In the face of such demands, working harder is a dead end. The only viable path is to work smarter. This isn’t just a motivational platitude; it’s a fundamental principle of strategy, warfare, and high-performance engineering. The key to this smarter approach lies in understanding and deploying Force Multipliers.
The term itself originates from military doctrine, where it describes a factor that dramatically increases the combat effectiveness of a given force. A small, well-trained special operations unit using night-vision technology (their force multiplier) can achieve objectives far beyond what their numbers would suggest.
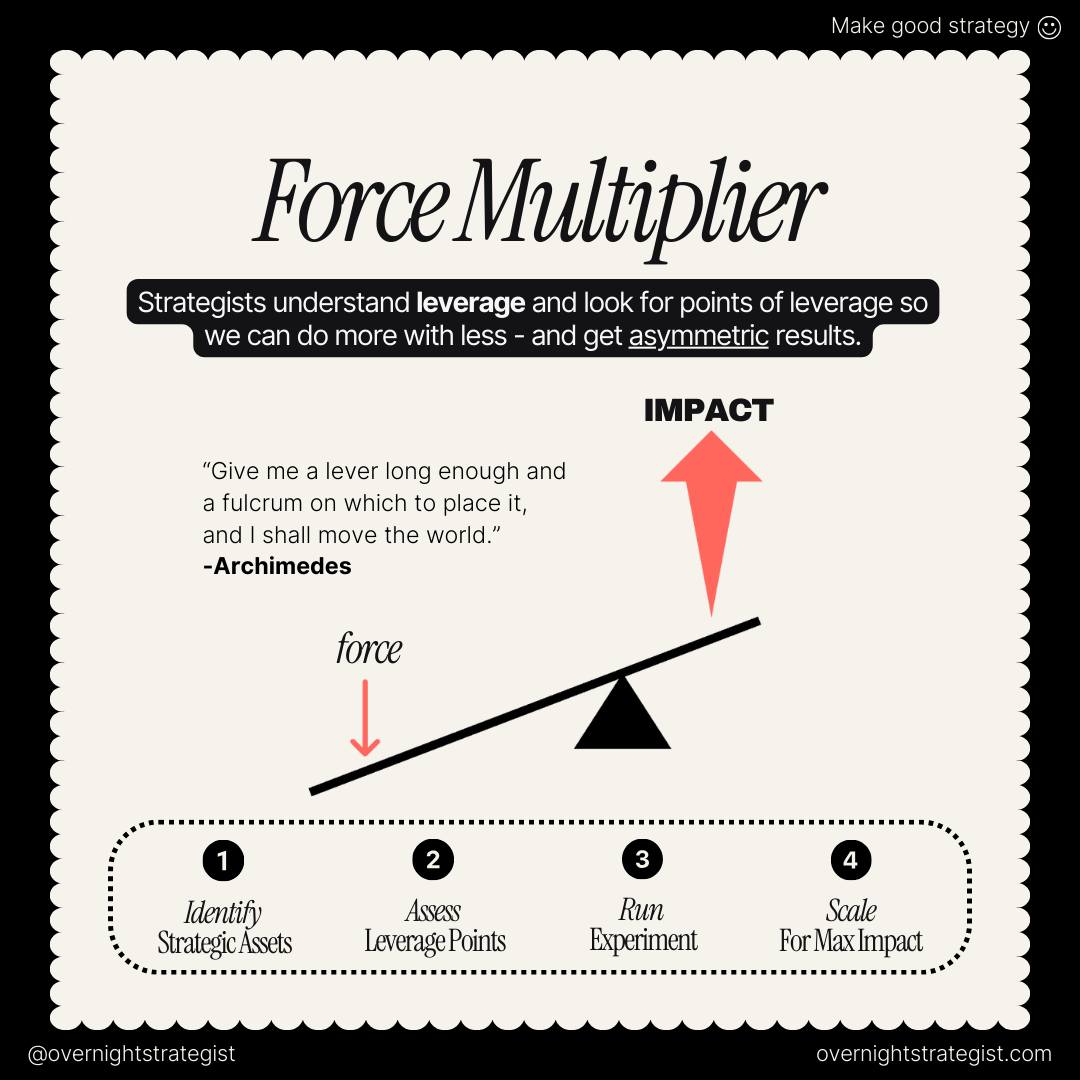
In the business and technology landscape, the principle is identical. As the ancient Greek mathematician Archimedes famously said, “Give me a lever long enough and a fulcrum on which to place it, and I shall move the world.” Your strategic assets are the lever, the leverage points are the fulcrum, and the resulting motion is the asymmetric impact on your market.
A force multiplier is an asset, tool, process, or capability that amplifies your input efforts, yielding outsized results. It’s not about incremental improvement; it’s about compounding, nonlinear gains. A single line of code that automates a thousand manual hours, a sales script that doubles conversion rates, a knowledge management system that cuts onboarding time in half—these are the ripples that become tidal waves of efficiency and growth.
As strategists, our job is to stop pushing the world with our bare hands and start building levers. This post will serve as your blueprint.
The Anatomy of a Force Multiplier: More Than Just a Tool
Before we dive into the methodology, it’s crucial to dissect what makes something a true force multiplier. It’s often misunderstood as simply a new piece of software.
It Creates a Ripple Effect: A true force multiplier doesn’t just solve one problem. It creates positive secondary and tertiary effects. An AI that automates data entry doesn’t just save time; it reduces human error, frees up skilled analysts for interpretive work, accelerates reporting cycles, and leads to faster, data-driven decision-making across the organization.
It Shifts the Ratio of Input to Output: The core metric of a force multiplier is its amplification factor. If you invest 1 unit of effort (time, money, resources) and get 3 units of return, that’s good business. If you invest 1 unit and get 10, 50, or 100 units of return, you’ve found a force multiplier. This is asymmetric payoff.
It Often Involves Automation or Abstraction: At its heart, amplification is about removing the limitations of human scale. Automation handles repetitive tasks at machine speed and scale. Abstraction (like using a high-level programming language instead of assembly code) allows you to perform complex operations with simple commands.
The Four-Step Framework for Deploying Force Multipliers
The provided image gives a clean, effective framework: Identify, Assess, Run, Scale. Let’s expand this into a actionable, detailed process informed by decades of design and architecture.
Phase 1: Identify Strategic Assets
You can’t amplify what you can’t see. The first phase is a systematic audit of your organization’s potential levers.
Objective: To catalog all assets, processes, and capabilities that have the potential to be amplified.
Inputs:
Process Maps: Detailed flowcharts of key business operations (e.g., lead-to-cash, hire-to-retire).
Technology Inventory: A complete list of all software, platforms, and infrastructure.
Skills Matrices: Data on employee competencies and time allocation.
Data Audits: Understanding what data you collect, where it resides, and how it’s used.
Customer Journey Maps: (A critical UX tool) Visualizations of every touchpoint a customer has with your company.
Tools & Frameworks:
Business Process Model and Notation (BPMN): The standard for mapping complex processes. Tools like Lucidchart or Miro are excellent for this.
SWOT Analysis (Strengths, Weaknesses, Opportunities, Threats): Helps identify internal strengths that can be amplified and weaknesses that need mitigation.
VRIO Framework (Valuable, Rare, Inimitable, Organized): A strategic management tool to pinpoint which of your resources and capabilities provide a sustainable competitive advantage. These are prime candidates for multiplication.
Customer Feedback & Support Tickets: A goldmine for identifying repetitive pain points that, if solved, would have a massive impact on satisfaction and efficiency.
Expected Output: A prioritized list of “Potential Force Multipliers.” Examples include:
Underutilized Data: Your CRM is full of customer data, but it’s not being used for predictive analytics.
Repetitive Cognitive Tasks: Your marketing team spends hours building the same report formats every week.
Tribal Knowledge: Your best salesperson’s techniques are locked in their head and not shared with the team.
Manual Deployment Processes: Your developers are manually building and deploying code, a process prone to error and slow to market.
Best Practice: Involve cross-functional teams. The IT department might see a tool as a cost center, while the sales team sees it as a revenue-generation engine. A diverse perspective is key to identification.
Phase 2: Assess Leverage Points
Not all strategic assets are created equal. This phase is about ruthless prioritization, asking the fundamental strategic question: “What small change can yield the biggest impact?”
This is where you find your fulcrum.
Objective: To quantitatively and qualitatively evaluate each potential force multiplier to determine where to focus your experimental efforts.
Inputs:
The prioritized list from Phase 1.
Data on time consumption, cost, error rates, and revenue impact for each process.
Tools & Frameworks:
Impact/Effort Matrix: The quintessential prioritization tool. Plot each potential multiplier on a 2×2 grid based on the estimated impact (y-axis) and the effort required to implement it (x-axis). Your primary targets are the initiatives in the “High Impact, Low Effort” quadrant.
https://media.adaptworldwide.com/writable/2021/02/210223-Impact-Effort-Matrix-1.pngICE Scoring Framework: A more nuanced method that scores ideas on three criteria:
Impact (1-10): How much will this increase our key metric?
Confidence (1-10): How confident are we in our impact estimate?
Ease (1-10): How easy will this be to implement?
ICE Score = (Impact * Confidence * Ease). The highest scores win.
Cost-Benefit Analysis (CBA): A more formal financial model projecting the return on investment (ROI).
Expected Output: A shortlist of 1-3 high-potential leverage points to experiment with. For example, your assessment might reveal:
Implementing a CI/CD pipeline (High Impact, Medium Effort) will have a larger long-term impact on developer productivity than switching project management tools (Low Impact, Low Effort).
Building a centralized customer data platform (CDP) might be high impact but also high effort, so it may be broken down into smaller, more manageable experiments first.
Best Practice: Be brutally honest in your assessments. “Effort” should include not just financial cost but also time-to-implement, training overhead, and potential cultural resistance. Over-optimism is the enemy of good strategy.
Phase 3: Run Experiment
This is where strategy meets execution. The biggest mistake organizations make is attempting a full-scale, “big bang” rollout of a new tool or process. The modern, agile approach is to treat every new force multiplier as a hypothesis to be tested.
Objective: To validate the effectiveness of a potential force multiplier with minimal risk and investment.
Inputs:
The chosen leverage point from Phase 2.
A clear, measurable hypothesis.
A defined experimental cohort (a specific team, a subset of users, etc.).
Tools & Frameworks:
Ag Methodology & Sprints: Time-box the experiment (e.g., 2-4 weeks). Define what “done” looks for the test.
A/B Testing: The gold standard for experimentation. Continue the old process with Team A (the control) while Team B uses the new tool/process (the variant). Compare the results. Tools like Optimizely or even Google Analytics can facilitate this.
MVP (Minimum Viable Product): Don’t build the perfect, full-featured system. Build the smallest possible version that can test your core hypothesis. For a new internal reporting tool, this might be a single, automated dashboard for one department instead of a company-wide suite.
Key Performance Indicators (KPIs): Define what success looks like before you start. Is it a 20% reduction in time spent? A 15% increase in conversion rate? A 50% reduction in error rates? Measure relentlessly.
Example in Action:
Hypothesis: “By providing the sales team with an AI-powered tool that analyzes call transcripts and suggests next steps, we will increase the lead-to-meeting conversion rate by 10%.”
Experiment: Provide the tool to half of the sales team for one quarter.
Measurement: Compare the conversion rates, deal velocity, and qualitative feedback from the two groups.
Result: The test group shows a 12% increase in conversions and reports higher confidence. The hypothesis is validated.
Expected Output: A data-backed conclusion on whether the force multiplier delivers the expected value. This output is a go/no-go decision for Phase 4.
Best Practice: Create a “blameless” experimentation culture. If an experiment fails, it’s not a failure of the team; it’s a success of the process. You’ve learned something valuable with minimal cost and can now pivot to a better idea.
Phase 4: Scale for Maximum Impact
A successful experiment is not a victory; it’s a green light. Scaling is the process of translating a localized win into an organizational transformation.
Objective: To institutionalize the validated force multiplier, driving broad, systemic impact.
Inputs:
Successful experimental results from Phase 3.
A rollout plan addressing people, processes, and technology.
Tools & Frameworks:
Change Management Models: Models like ADKAR (Awareness, Desire, Knowledge, Ability, Reinforcement) or Kotter’s 8-Step Process are essential. Technology is easy to scale; human behavior is not.
Enterprise Architecture Frameworks: Like TOGAF, to ensure the new solution integrates seamlessly and sustainably with the rest of the IT landscape.
Training & Documentation Platforms: (e.g., Confluence, Notion) to ensure consistent and effective use.
DevOps & Cloud Infrastructure: Platforms like AWS, Azure, or Google Cloud provide the elastic, scalable foundation to roll out a software-based force multiplier to thousands of employees or millions of customers instantly.
Expected Output: The force multiplier is fully integrated, widely adopted, and delivering its compounding results across the intended scope of the organization.
Best Practice: Scaling is not an afterthought. During the Experiment phase, you should already be thinking about scalability. Was the MVP built on a tech stack that can handle enterprise load? Does the new process require a support structure? Plan for scale from the beginning.
Real-World Case Studies of Digital Force Multipliers
Let’s move from theory to tangible examples.
The CI/CD Pipeline (Software Development):
Asset: Developer talent and codebase.
Leverage Point: The manual, error-prone deployment process.
Multiplier: A Continuous Integration/Continuous Deployment (CI/CD) pipeline using tools like Jenkins, GitLab CI/CD, or GitHub Actions.
Impact: Automates testing and deployment. A single code commit can trigger an automated process that builds, tests, and deploys code to production. This amplifies developer productivity, reduces errors, and increases release frequency from quarterly to daily or hourly. Reference: The State of DevOps Report consistently shows that elite performers deploy significantly more frequently and with lower change failure rates, a direct result of this force multiplier.
The Customer Data Platform (CDP) (Marketing):
Asset: Disparate customer data (website visits, CRM entries, support tickets, email engagement).
Leverage Point: The inability to form a single, unified view of the customer.
Impact: The CDP acts as a central nervous system, collecting data from all sources and providing a single, clean customer profile to all other tools (email, ad platforms, CRM). This amplifies the effectiveness of every marketing campaign, leading to higher personalization, better customer experiences, and increased ROI on ad spend.
The Design System (UX/Product):
Asset: Design and front-end development teams.
Leverage Point: Inconsistent, one-off design and code for every new feature.
Multiplier: A comprehensive Design System (like Google’s Material Design or IBM’s Carbon) built with tools like Figma and Storybook.
Impact: Provides a library of reusable, accessible UI components and clear usage guidelines. This amplifies team velocity (designers don’t have to redesign a button, developers don’t have to recode it), ensures brand and UX consistency, and dramatically improves accessibility. Reference: The Economic Impact of a Design System by Forrester often quantifies millions in savings and significant speed-to-market improvements.
Conclusion: Become the Architect of Leverage
The quest for force multipliers is not a one-time project; it’s a continuous mindset. It’s the essence of strategic thinking in the digital age. It asks us to shift from being mere operators to being architects of leverage.
Stop asking, “How can we do this task faster?” Start asking, “How can we make this task irrelevant?” or “How can we automate this outcome?” By systematically identifying your strategic assets, rigorously assessing their leverage points, courageously running experiments, and deliberately scaling successes, you embed a culture of amplification into your organization’s DNA.
You stop moving the world with your hands. You start building levers. And as Archimedes promised, that is how you achieve the impossible.
Image belongs to: overnightstrategist.