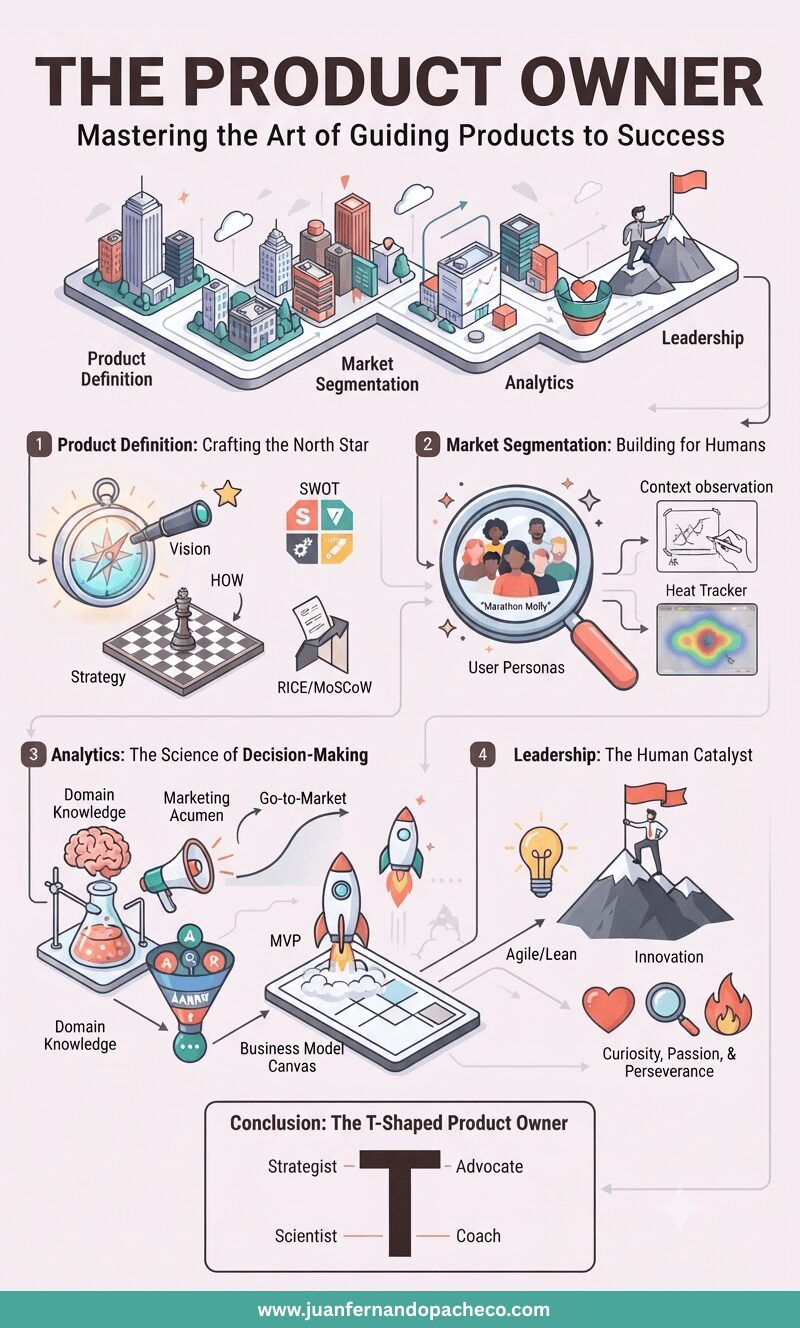
By weaving together strategy, empathy, data, and leadership, the Product Owner transforms ambiguity into impact—one backlog item at a time.
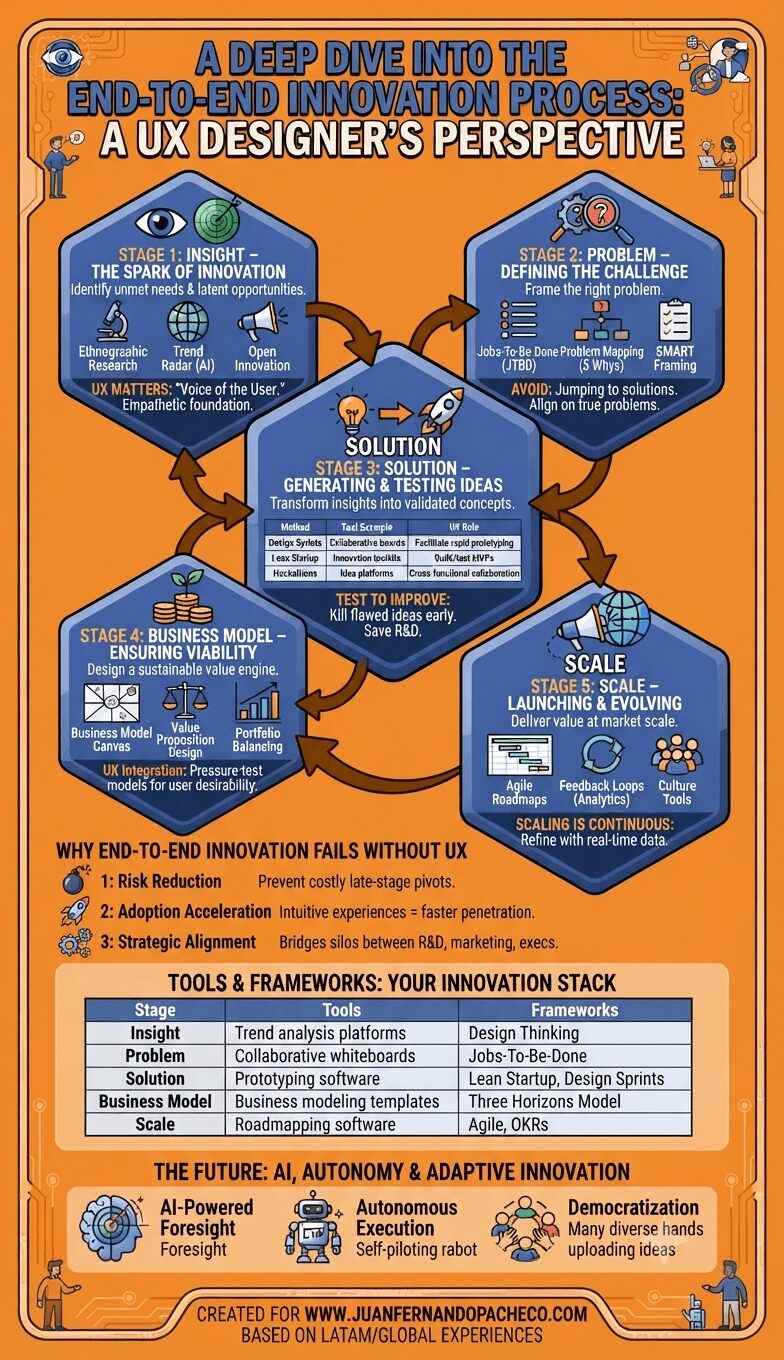
As a UX professional, I’ve witnessed how human-centered design transforms scattered ideas into market-shaping solutions. This process isn’t linear; it’s a dynamic ecosystem where strategy, creativity, and execution intertwine.
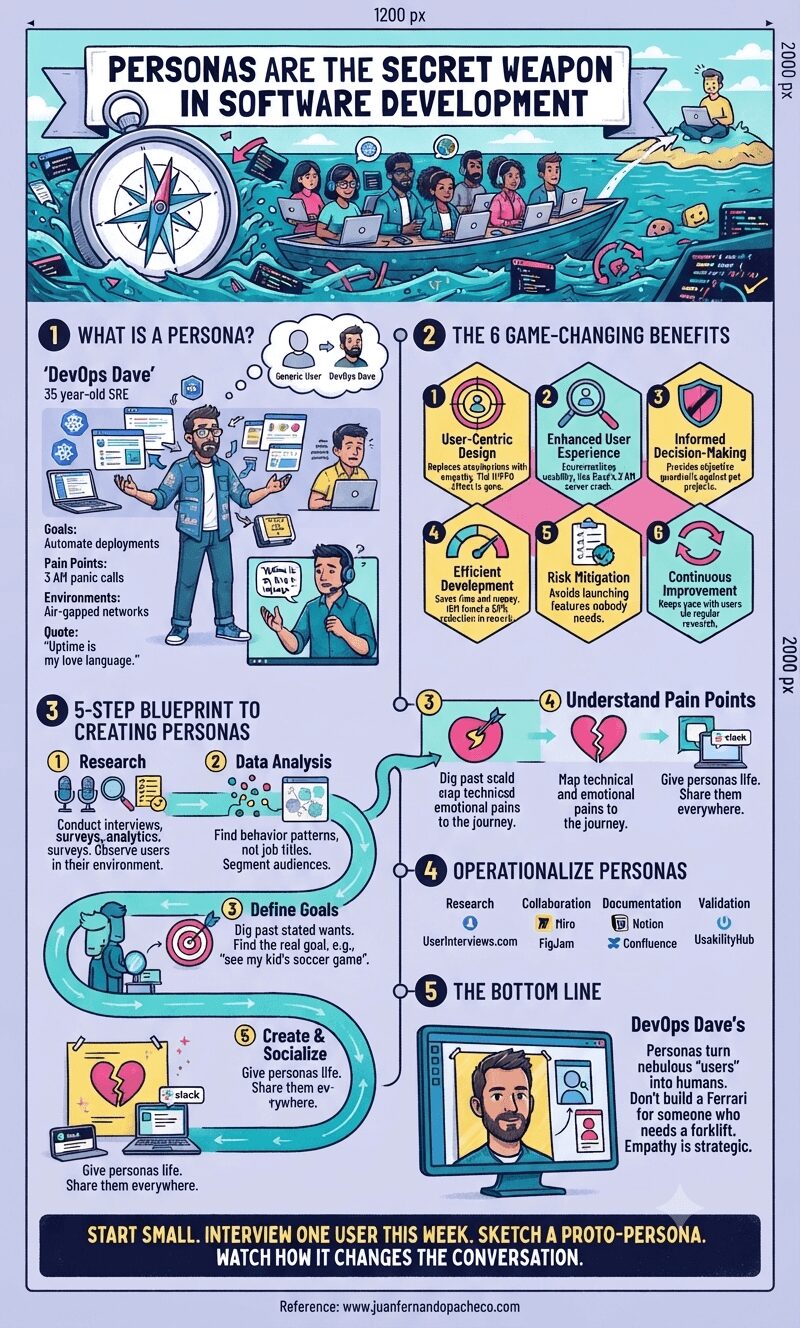
Personas turn nebulous “users” into humans your team cares about. They prevent you from building a Ferrari for someone who needs a forklift. When DevOps Dave’s face stares back from your design wall, you’re not coding for specs—you’re solving for a person.
In software, empathy isn’t soft—it’s strategic. Personas are how you bake it into your DNA.
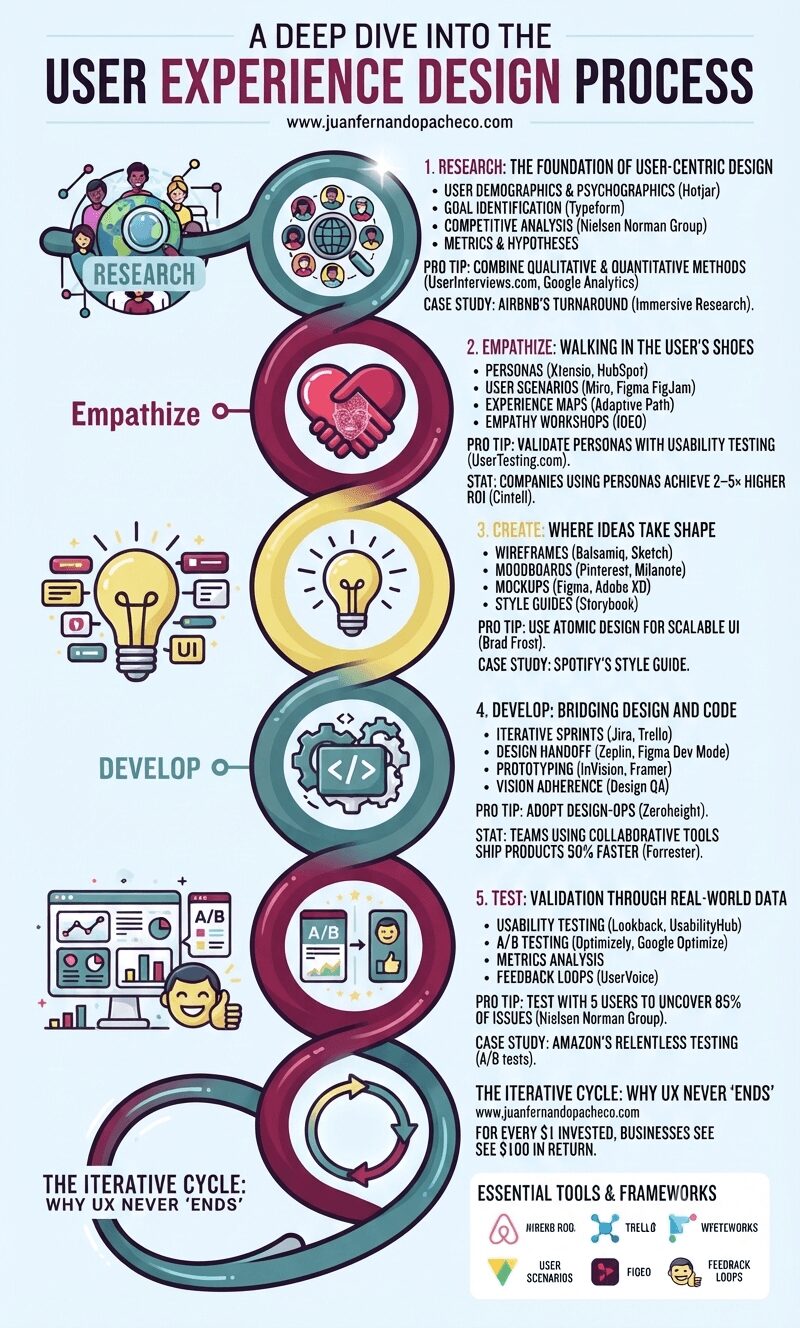
Neglecting UX risks obsolescence. Brands like Apple and Tesla dominate by embedding user-centricity in their DNA. Start small: interview 5 users today. Map one customer journey. Test one button. The process compounds—each iteration deepens empathy, refines solutions, and ultimately, builds products humans love.
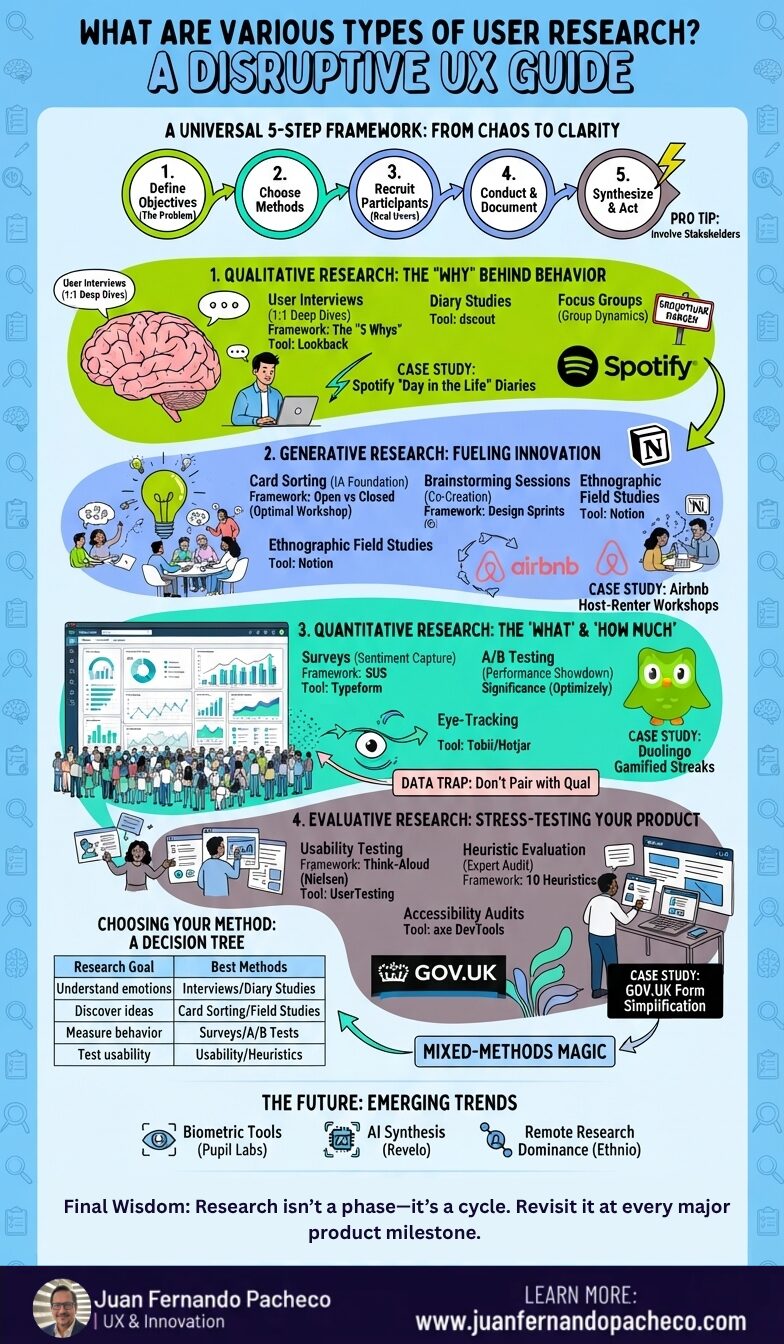
User research isn’t a luxury—it’s the oxygen of human-centered design.
Get it wrong, and you’ll build solutions that miss the mark. Get it right, and you unlock products users love. But with so many methods floating around, how do you navigate the chaos?
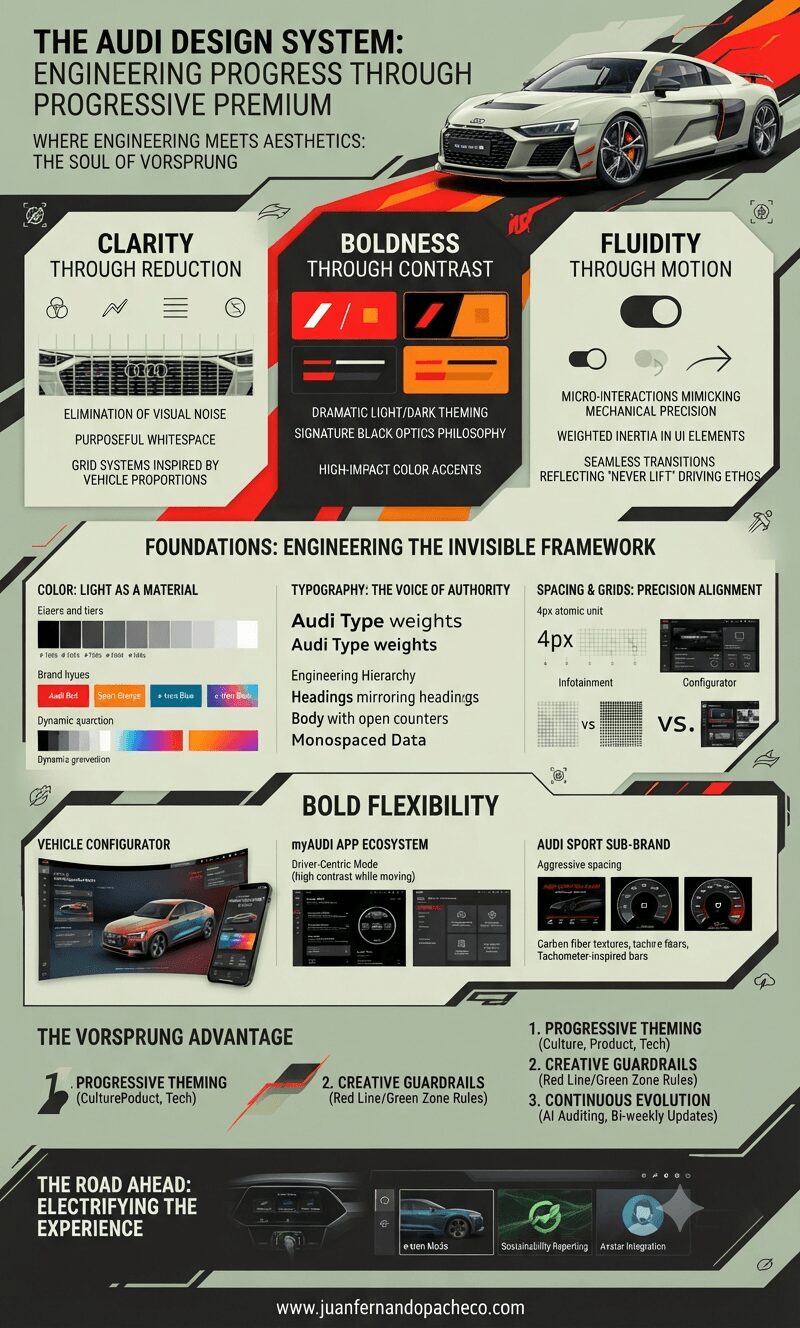
The Audi Design System transcends pixels and code. It’s the digital embodiment of Ingolstadt’s engineering soul—a framework where every gradient curves like a roofline, every grid aligns like wheel spokes, and every interaction delivers the thunk of a perfectly weighted door. In a world of disposable digital experiences, Audi proves luxury isn’t just felt in leather seats—it’s engineered into every click, swipe, and scroll.

A Professional’s Guide to Leveraging Urban Night Colors Color in UI and graphic design is
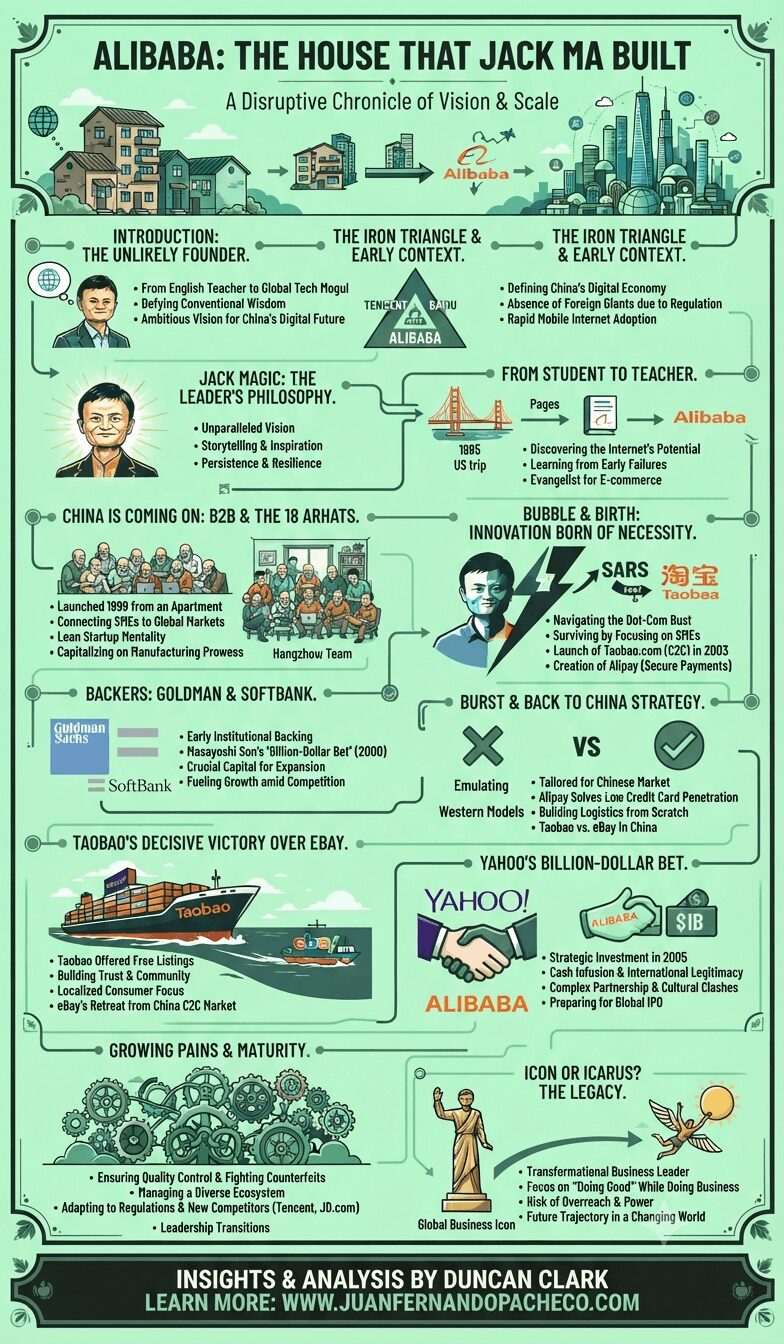
In “Alibaba: The House That Jack Ma Built,” Duncan Clark delivers a compelling and meticulously researched narrative that goes beyond a mere corporate history. It is a story about vision, resilience, leadership, and the unique alchemy that allowed an audacious entrepreneur from a developing nation to build a global empire that redefined commerce and technology.
Unlocking Design Excellence: Your Guide to DesignOps Ever wonder how some companies consistently deliver amazing
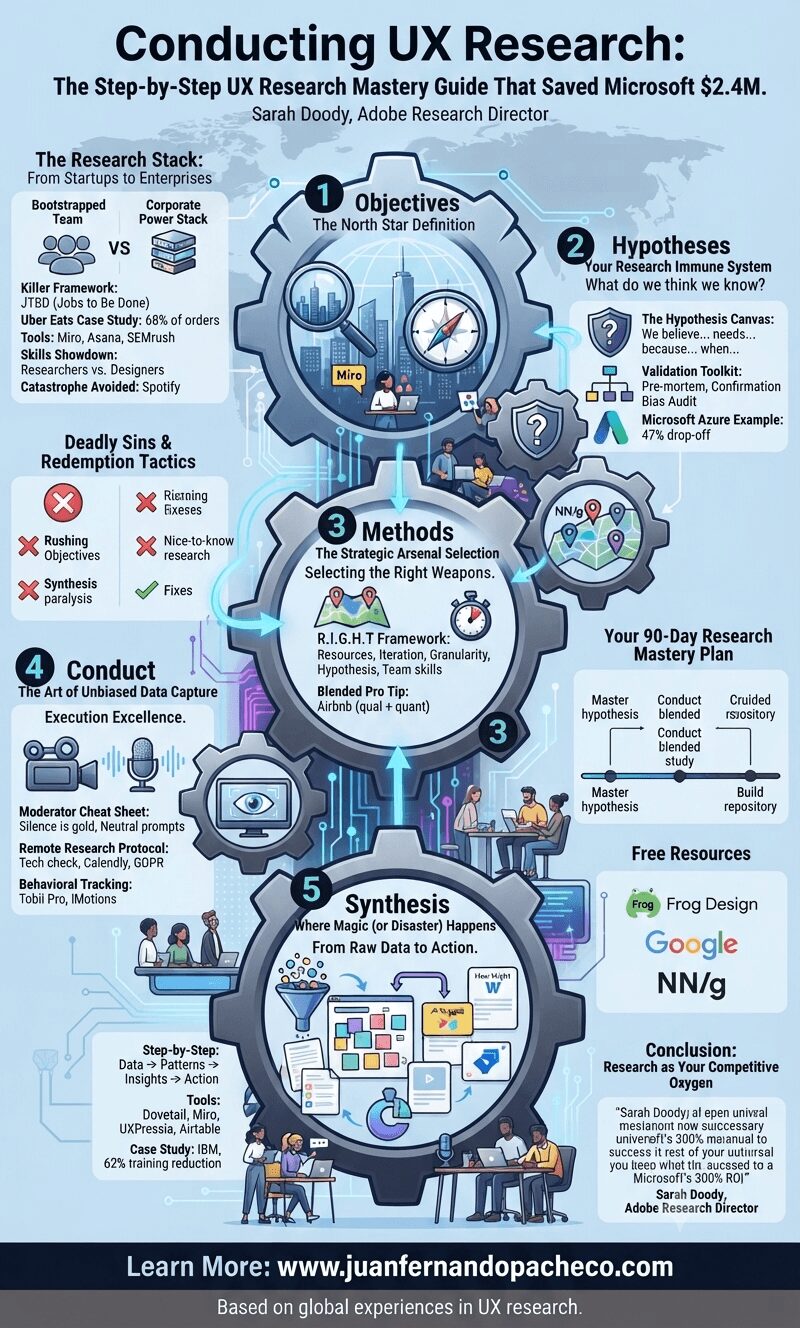
As a UX research lead, I’ve witnessed teams waste millions by skipping Step 2 (hypotheses). The Frog Design framework in your image isn’t academic theory—it’s a battle-tested survival blueprint. Let me walk you through each phase with real-world tactics you can implement tomorrow.