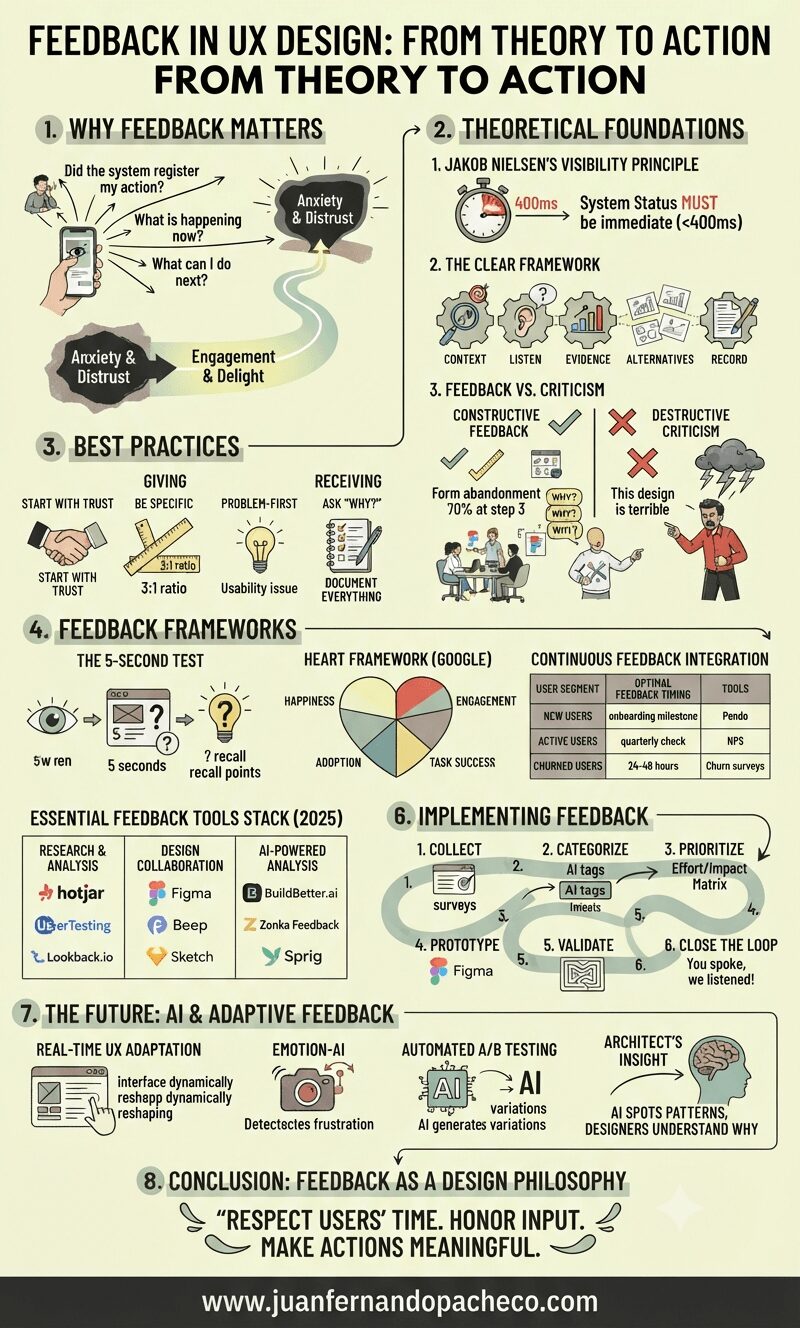
An infographic titled "Feedback in UX Design: From Theory to Action" that illustrates key concepts, frameworks, best practices, and tools for implementing effective user feedback. It covers topics from Jakob Nielsen's Visibility Principle to the future of AI-driven adaptive systems.

Feedback is the oxygen of user experience design.

Every click, swipe, or interaction creates a conversation between users and digital products. As a UX Designer with over two decades in the field, I’ve seen how strategically crafted feedback transforms frustrating experiences into delightful ones—and how poor feedback mechanisms sabotage even the most beautifully designed interfaces.
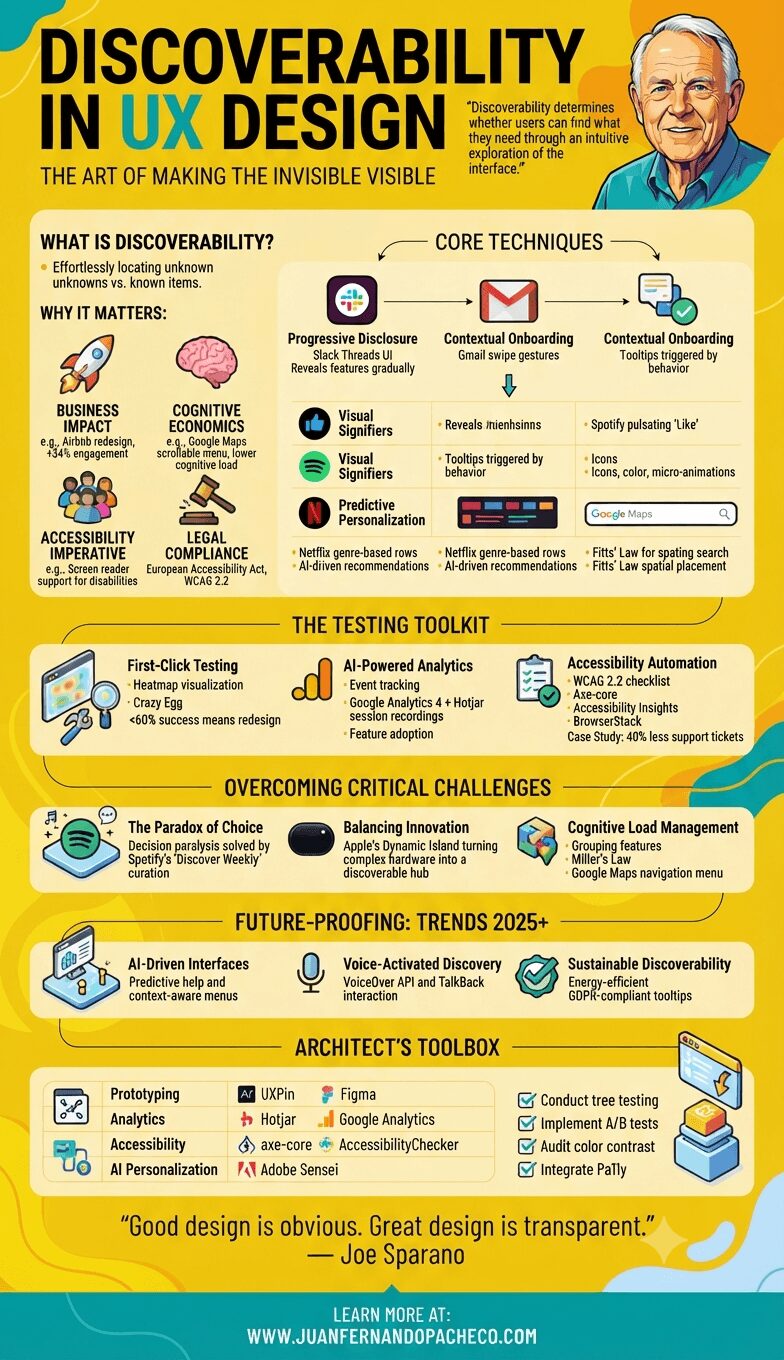
A comprehensive vertical infographic titled "Discoverability in UX Design" with a vibrant yellow background, featuring sections defining the concept, its importance, techniques, testing methods, challenges, future trends, and tools, alongside a portrait of Don Norman and the URL www.juanfernandopacheco.com.

Discoverability isn’t a UI embellishment—it’s the backbone of inclusive, efficient digital experiences. As interfaces grow more complex, the designer’s role evolves into a bridge builder between capability and usability.

By combining progressive disclosure, AI-enhanced personalization, and rigorous accessibility testing, we can create products that don’t just function but reveal their genius intuitively.

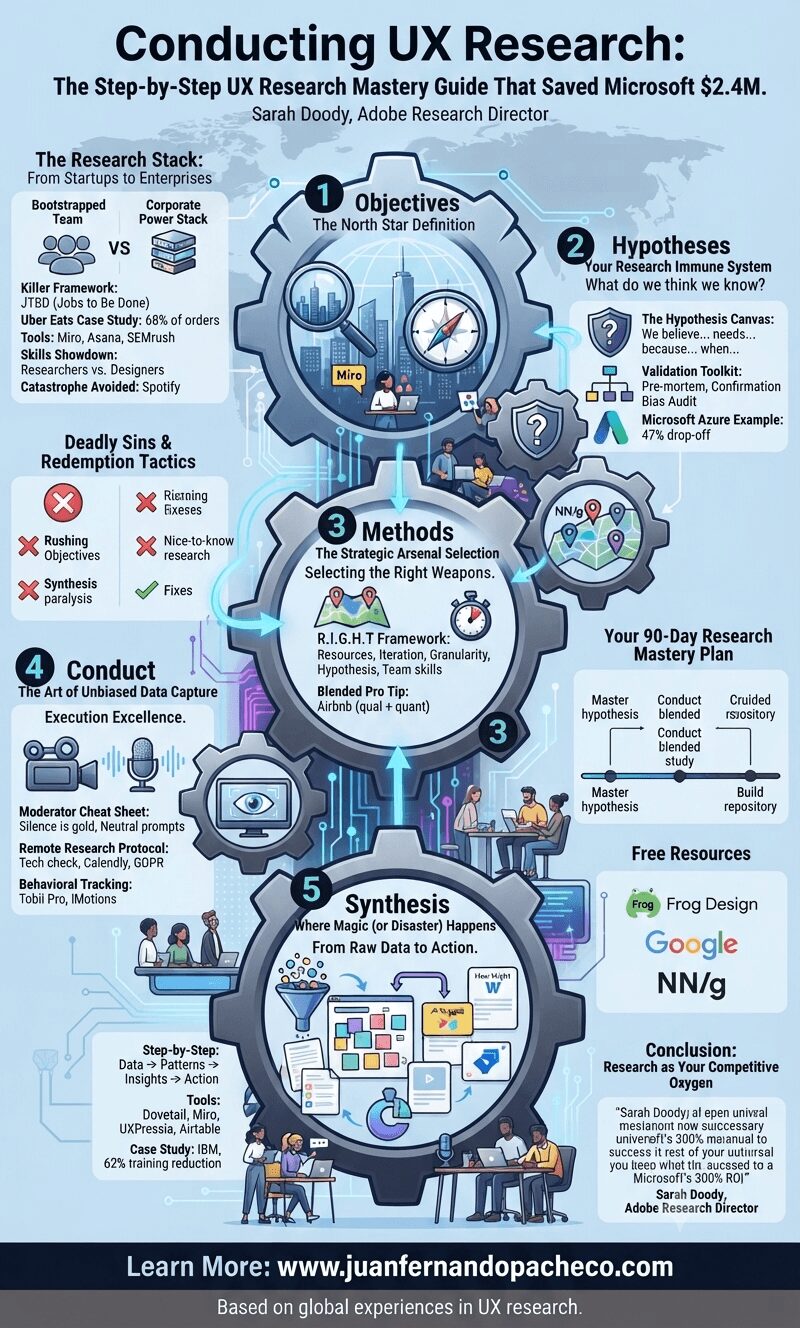
An intricate infographic with a blue and grey color scheme illustrating a five-step UX research process as a interconnected series of cogs. The title is "Conducting UX Research: The Step-by-Step UX Research Mastery Guide That Saved Microsoft $2.4M." Each cog represents a phase: 1. Objectives, 2. Hypotheses, 3. Methods, 4. Conduct, and 5. Synthesis. Detailed text within and around the cogs breaks down key frameworks (JTBD, R.I.G.H.T.), tools (Miro, Asana, Dovetail, etc.), case studies (Uber Eats, Spotify, Microsoft Azure, IBM), and skills. Additional sections include "The Research Stack," "Deadly Sins & Redemption Tactics," "Your 90-Day Research Mastery Plan," and "Free Resources." The footer displays "Learn More: www.juanfernandopacheco.com" and "Based on global experiences in UX research."

As a UX research lead, I’ve witnessed teams waste millions by skipping Step 2 (hypotheses). The Frog Design framework in your image isn’t academic theory—it’s a battle-tested survival blueprint. Let me walk you through each phase with real-world tactics you can implement tomorrow.

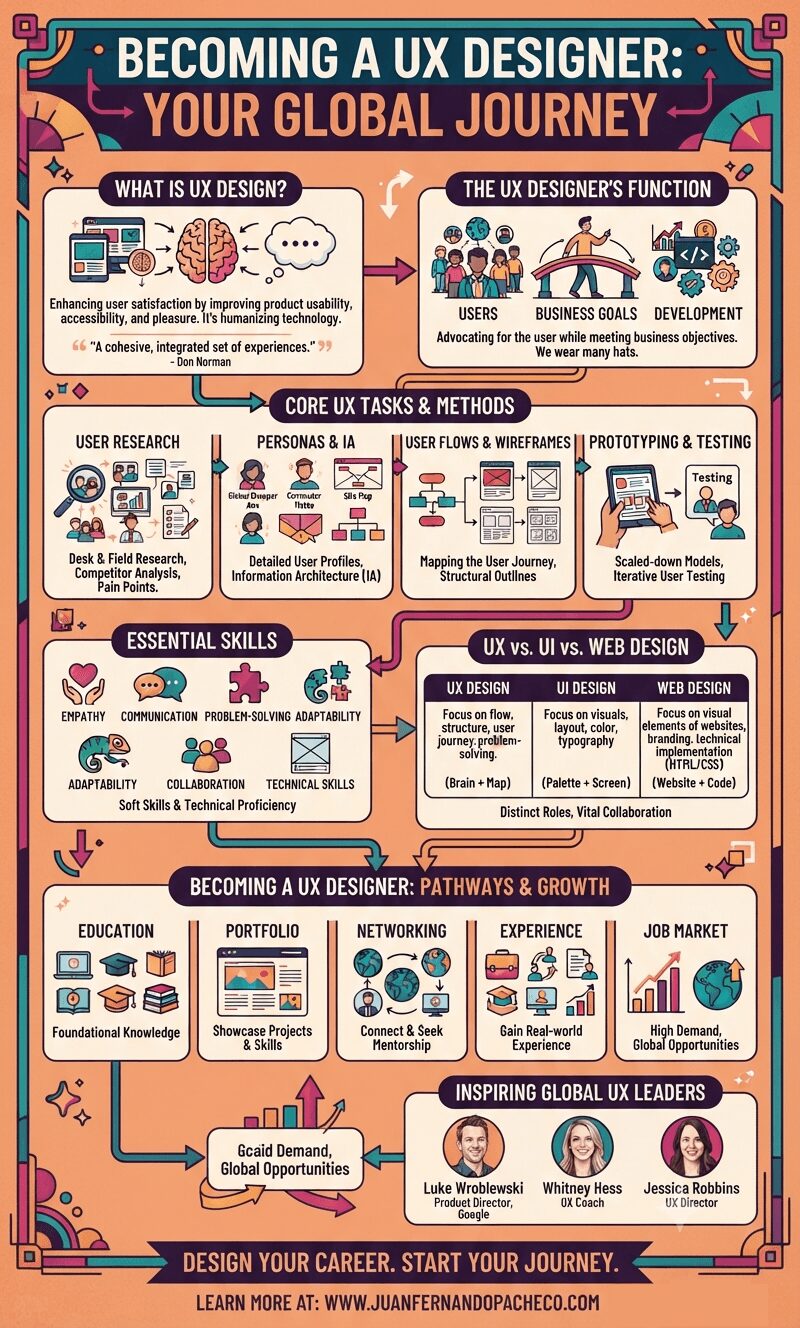
An intricate infographic titled "BECOMING A UX DESIGNER: YOUR GLOBAL JOURNEY" with a peach background. It outlines key UX concepts including definitions, the designer's function as a bridge between users and business, core methodologies (research, personas, flows, prototyping, testing), essential skills, comparisons to UI and web design, career paths (education, portfolio, networking), and features three inspiring leaders. Arrows connect the sections, and a footer directs to www.juanfernandopacheco.com.

Becoming a UX Designer: Learn User Experience Design by William N. Aldrich serves as a foundational guide for anyone looking to enter or better understand the field of User Experience (UX) design. The book aims to demystify UX design, clarifying its purpose, the responsibilities of a UX designer, and the essential skills required to succeed in this dynamic profession.

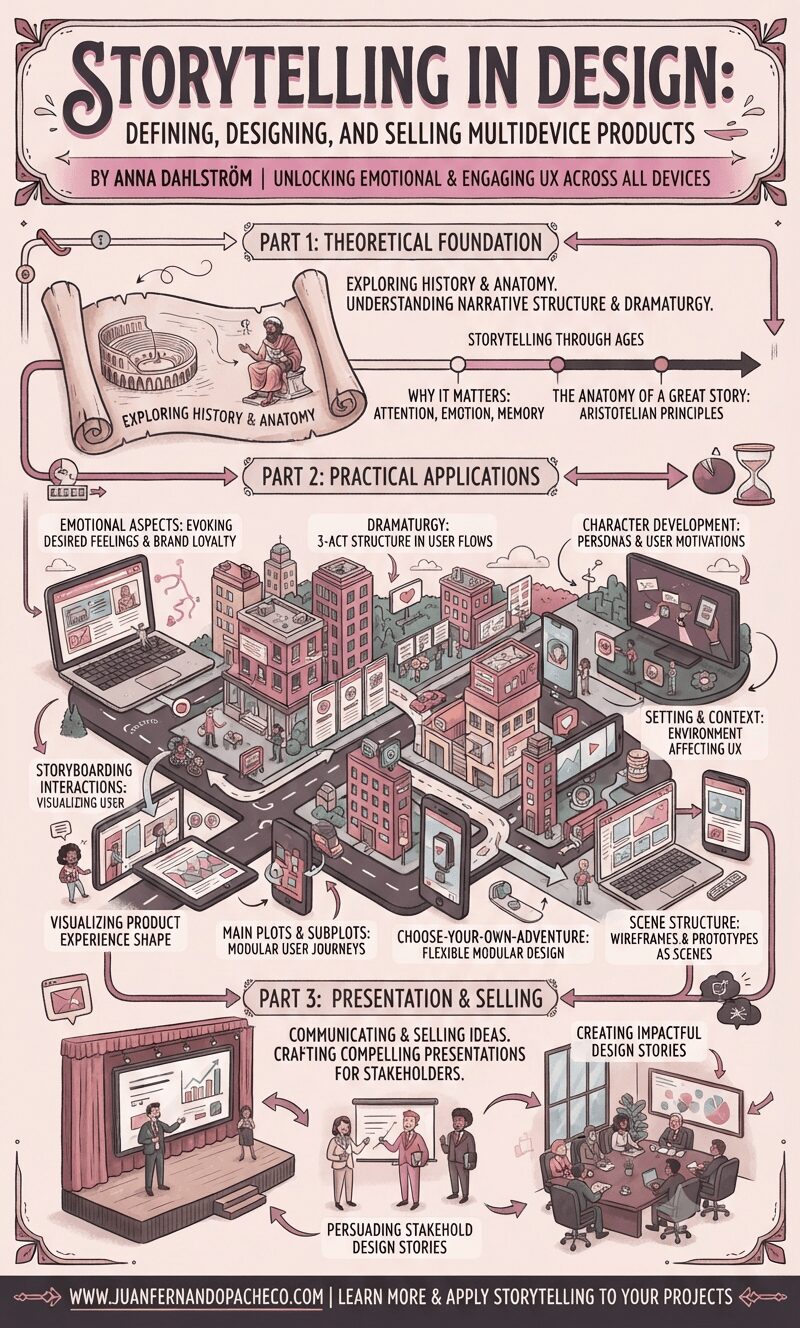
A detailed infographic titled "Storytelling in Design," summarizing Anna Dahlström's book. It is divided into three parts: "Theoretical Foundation" (history, Aristotelian principles), "Practical Applications" (using a 3D city map of devices to show UX, dramaturgy, and storyboarding), and "Presentation & Selling" (communicating ideas to stakeholders). The illustration uses a vintage, hand-drawn style with a dusty rose and grey color palette.

Throughout the book, Dahlström provides practical exercises and examples to help readers apply storytelling principles to their design projects.

She emphasizes that storytelling is not just about creating entertaining narratives but also about designing effective and user-centered experiences.

By drawing on the power of storytelling in design, designers can create products that are not only functional but also engaging, meaningful, and memorable.

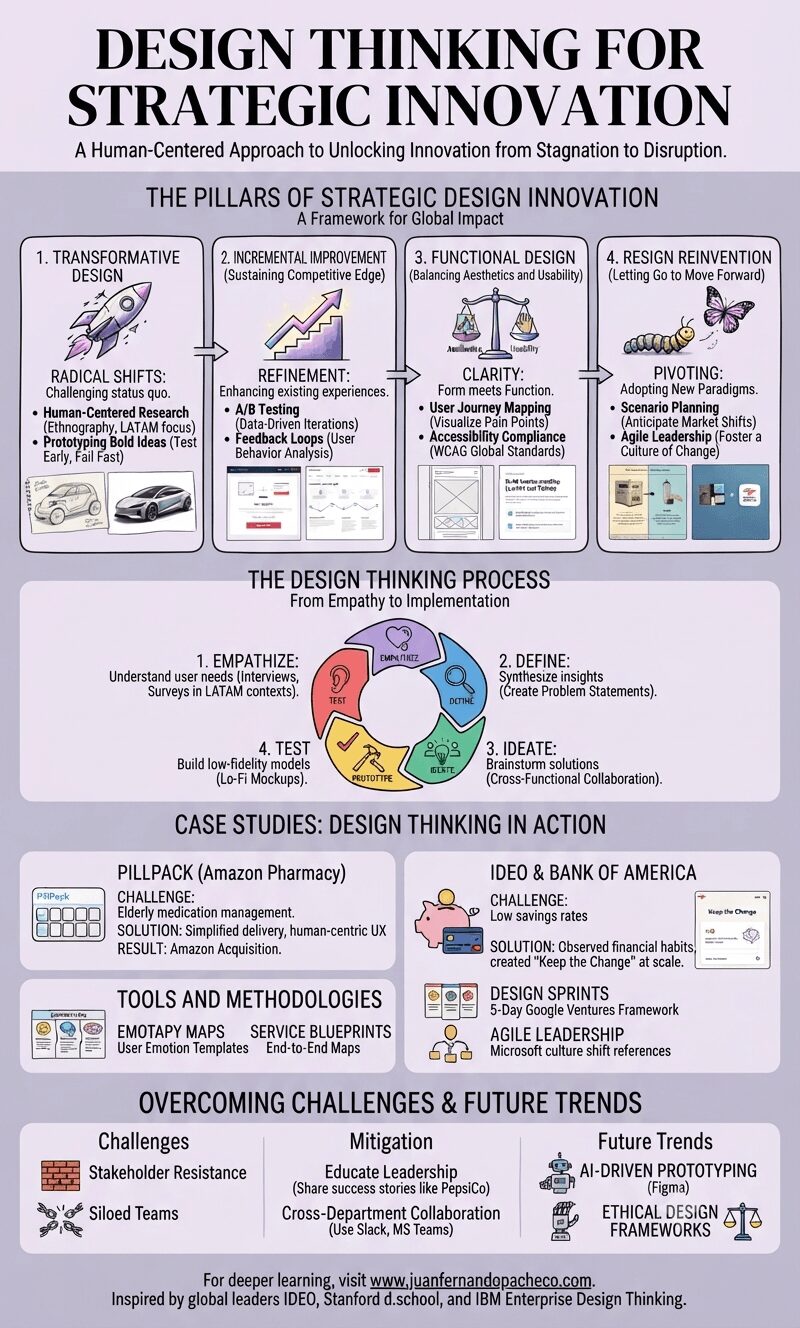
An infographic titled "DESIGN THINKING FOR STRATEGIC INNOVATION" with a human-centered approach, detailing the four pillars (Transformative Design, Incremental Improvement, Functional Design, Resign Reinvention), the five-stage process, case studies (PillPack, IDEO & Bank of America), tools, challenges, future trends, and a final call to action and website reference www.juanfernandopacheco.com.

Design Thinking is more than a buzzword—it’s a human-centered approach to solving complex problems and unlocking strategic innovation.

By blending empathy, creativity, and iterative learning, organizations can pivot from stagnation to disruption. This post unpacks how Design Thinking intersects with four pillars of innovation: Transformative Design, Incremental Improvement, Functional Design, and Resign Reinvention.

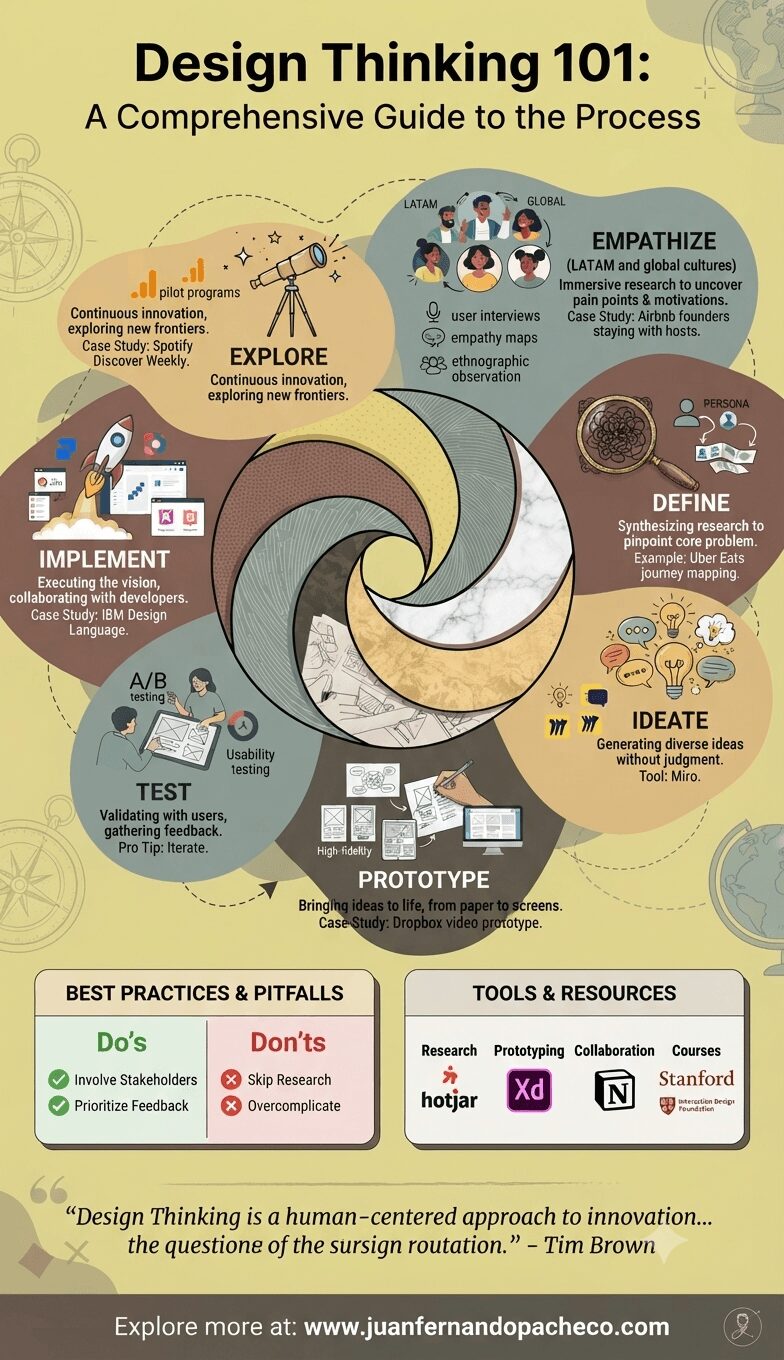
An infographic titled "Design Thinking 101" displaying the seven-phase design thinking process (Empathize, Define, Ideate, Prototype, Test, Implement, Explore) in a circular, flowing design on a beige background, featuring icons, key case study references, best practices, and links to professional tools.

Design Thinking is a human-centered methodology that empowers teams to solve complex problems through creativity, empathy, and iterative learning.

Rooted in disciplines like UX design and systems thinking, it bridges the gap between user needs and business goals. According to the Stanford d.school, Design Thinking is “a methodology for innovation that combines creative and analytical approaches.”

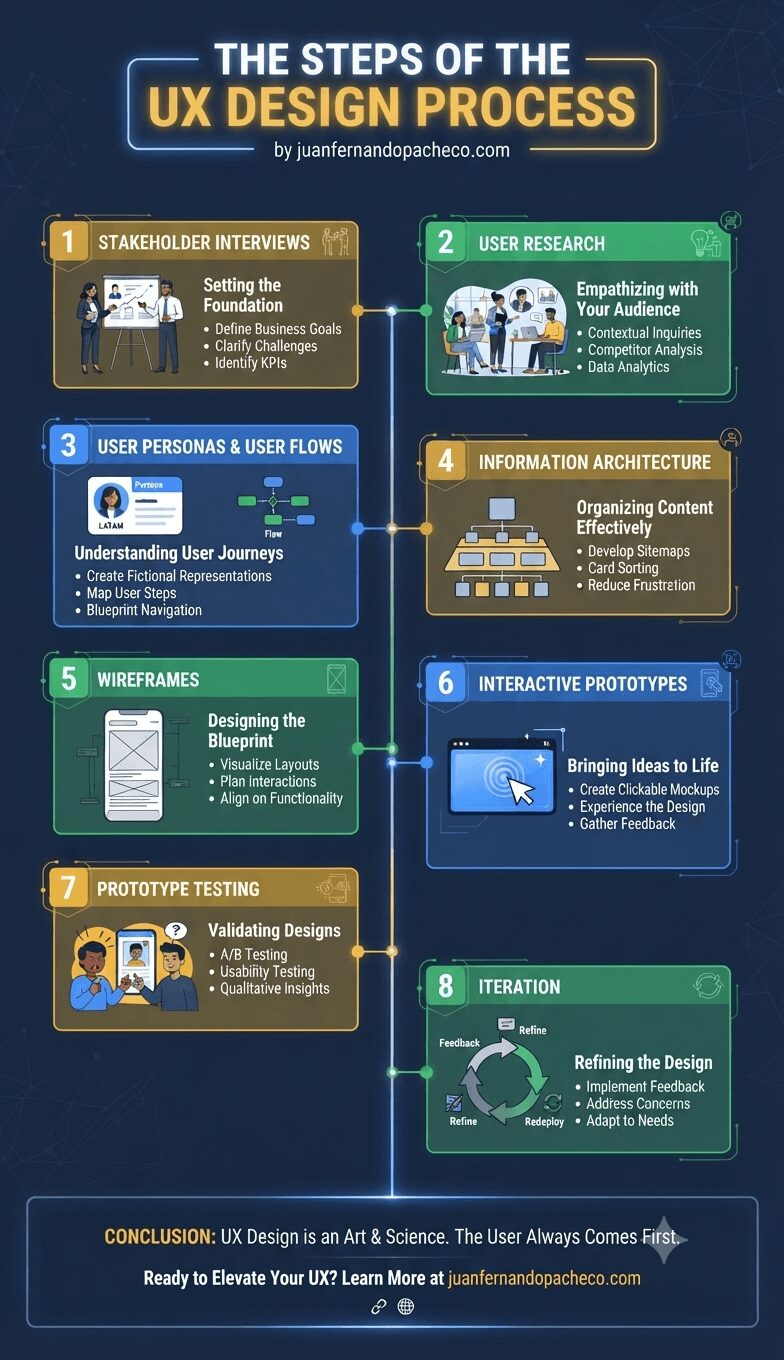
Infographic titled "The Steps of the UX Design Process by juanfernandopacheco.com" presented in a vertical, connected layout against a dark blue background. Eight numbered steps are detailed sequentially: 1. Stakeholder Interviews, 2. User Research, 3. User Personas & User Flows, 4. Information Architecture, 5. Wireframes, 6. Interactive Prototypes, 7. Prototype Testing, and 8. Iteration. Each step features a descriptive icon or illustration, a subtitle explaining the goal, and three specific bullet points outlining the activity. The infographic concludes with a summary banner emphasizing user-centered design and a call to action for the provided website.

The UX design process is both an art and a science. By following these steps, you’ll create products that resonate with users and achieve business goals. Whether you’re designing a simple app or a complex enterprise platform, remember: the user always comes first.