In the complex ecosystem of modern business, where customers interact with brands across a dozen different touchpoints before making a decision, a singular, internal view of your process is a liability. You might see a sleek, efficient machine, but your customer experiences a labyrinth. The tool that bridges this critical gap between perception and reality is the Customer Journey Map (CJM).
As defined by the Nielsen Norman Group, a leading voice in user experience research, a journey map is “a visualization of the process that a person goes through in order to accomplish a goal.” 1 But that definition, while accurate, only scratches the surface. Think of it not as a simple diagram, but as a strategic artifact—a shared source of truth that aligns your entire organisation around the lived experience of the people you serve.
In this deep dive, we will move beyond the basics to explore the operational, strategic, and architectural significance of Customer Journey Maps. We’ll dissect what they are, why they are a non-negotiable asset, when to deploy them, and most importantly, how to build them with the rigor of a seasoned architect.
What Are Customer Journey Maps, Really?
At its core, a Customer Journey Map is a visual narrative of a user’s relationship with your product, service, or brand over time and across channels. It’s the story of “persona on the move,” as your initial text aptly states. However, from an architectural standpoint, it’s more than a story; it’s a system blueprint.
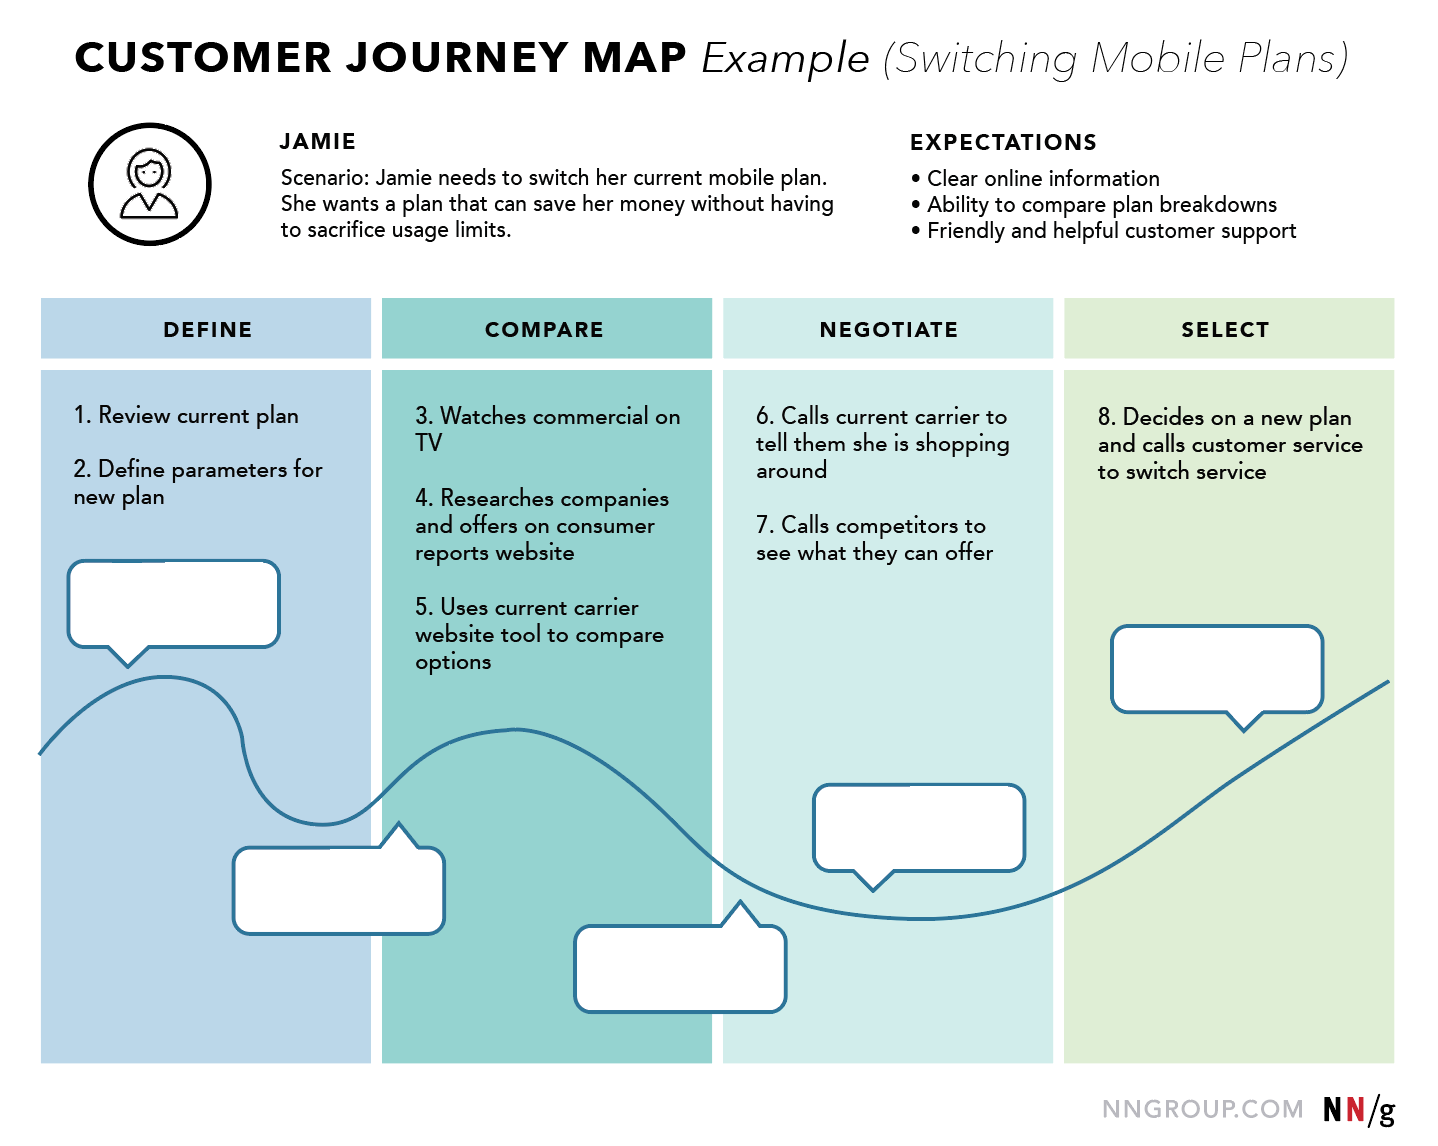
A robust CJM doesn’t just list steps; it layers multiple dimensions of the user’s experience onto a timeline. Let’s break down its core components, using the provided example of “Jamie” switching her mobile plan:
Persona & Scenario: The “who” and the “why.” The map is anchored to a specific user archetype (Jamie, a cost-conscious consumer) and her specific goal (switching to a cheaper plan without sacrificing usage). A map without a focused scenario is too generic to be actionable.
Phases & Stages (The Timeline): The high-level stages of the journey. In Jamie’s case, this is
Define -> Compare -> Negotiate -> Select. These phases represent the mental model of the user, not your internal departmental silos.Actions & Touchpoints: The “what.” The specific actions the user takes (e.g., “Watches commercial on TV,” “Uses current carrier website tool”) and the channels they use (TV, website, phone call). This is the behavioral layer of the journey.
Thoughts & Emotions: The “feelings.” This is the qualitative, empathetic heart of the map. What is Jamie thinking when she sees a competitor’s ad? Is she feeling hopeful, skeptical, or overwhelmed? This is often represented as an emotional curve, dipping into “pain points” and rising into “moments of delight.”
Opportunities & Insights: The “so what?” This is the most critical output-oriented layer. For every identified pain point (e.g., “Feels confused by complex plan jargon on the website”), the team brainstorms a concrete opportunity (“Simplify plan descriptions with plain-language comparisons”).
The example image is a classic “current-state” map, designed to diagnose the existing experience. Conversely, an “aspirational” or “future-state” map visualizes the ideal, streamlined journey you intend to build, serving as a North Star for design and development teams.
The Compelling “Why”: The Business Case for Journey Mapping
Once considered a “nice-to-have” UX exercise, Customer Journey Mapping is now a cornerstone of customer-centric strategy, and the data proves it. The Aberdeen Group found that companies who excel at journey mapping see, on average, a 24.9% increase in marketing-generated revenue and a 21.2% reduction in service costs. 2
Why are the returns so significant?
It Fosters Empathy and Breaks Down Silos: A CJM forces marketing, sales, engineering, and support to see the world from a single, unified perspective: the customer’s. It replaces internal debates (“The website is fine!”) with evidence-based, shared understanding (“Oh, this is why our customers get frustrated and call support at this step”).
It Uncovers Hidden Pain Points and Inefficiencies: You may have great analytics showing where users drop off, but a CJM reveals the why. That 80% cart abandonment rate isn’t just a number; the map might show it’s caused by a sudden shipping cost revealed too late, coupled with anxiety about the return policy. This insight directs your resources to the root cause, not just a symptom.
It Informs Technology and Architectural Decisions: As an IT Solutions Architect, I use CJMs to prevent technology-driven decisions. Steve Jobs famously said, “You’ve got to start with the customer experience and work back toward the technology, not the other way around.” A CJM provides the “what” and “why” that dictates the “how.” Should we invest in a new CRM, a chatbot, or a better comparison tool? The map will show you which investment will most directly alleviate a key customer pain point and improve the journey.
It Prioritizes Roadmaps and Allocates Resources: With a visual map of the entire journey, it becomes painfully obvious which “quick wins” will have the most impact and which major initiatives are truly critical. This moves prioritization from a political battle to a data-driven conversation.
When to Wield the Map: Strategic Timing for Maximum Impact
Journey mapping is a powerful but resource-intensive tool. Deploying it at the right moment is key to its success.
During a Website Redesign or Digital Transformation: This is a classic use case. Instead of simply “freshening up” the UI, a CJM ensures the redesign is grounded in user needs. It answers fundamental questions: What information do users seek at each stage? What tasks are they trying to accomplish? What emotional state are they in?
When Addressing a Known Business Problem: Is customer churn high? Are support calls for a specific issue skyrocketing? A CJM focused on the “onboarding” or “troubleshooting” journey can pinpoint the exact moment where the experience breaks down and causes long-term damage.
When Launching a New Product or Service: A “future-state” map is invaluable for aligning the entire product team on the desired end-to-end experience before a single line of code is written. It defines the success metrics for the launch beyond mere functionality.
When Organizational Silos are Causing Friction: If departments are blaming each other for customer complaints, a cross-functional mapping workshop is the antidote. It creates a shared artifact that everyone owns, highlighting how each team’s output impacts the customer’s holistic experience.
When Serving Multiple Distinct Customer Segments: As your text notes, a B2B client has a vastly different journey than a B2C one. Creating separate, nuanced maps for each key persona ensures your marketing, sales, and support processes are appropriately personalized.
How to Build a Customer Journey Map: A Workshop Framework for Success
Creating a CJM is not a solitary task for a designer in a corner office. It’s a collaborative, facilitated workshop. Here is a detailed framework for executing it.
Necessary Inputs
Do not enter a mapping session blind. Arm yourself with qualitative and quantitative data:
User Personas: Who are we mapping for? (e.g., Jamie).
User Research: Data from interviews, surveys, and usability studies that provide quotes and insights into user goals, mindsets, and pain points.
Analytics Data: Quantitative data from web analytics, CRM, and support tickets that show behavioral trends (drop-off rates, common paths).
Business Goals: What does the business hope to achieve by improving this journey? (e.g., reduce support calls, increase conversion).
A Cross-Functional Team: Include representatives from Marketing, Sales, Customer Support, Design, Development, and any other relevant department.
The Workshop Process: A Step-by-Step Guide
1. Pre-Workshop: Set the Stage
Define the scope: Which specific persona and scenario will you map? (e.g., “First-time Jamie switches her mobile plan”).
Gather all inputs and pre-share them with attendees.
Book a dedicated room (physical or virtual) for 2-4 hours.
2. During the Workshop: Facilitate the Build
Step 1: Define the Lens (15 mins). Reiterate the persona, scenario, and goals. Everyone must be aligned on the “who” and “why.”
Step 2: Brainstorm Stages & Actions (45 mins). Using sticky notes on a whiteboard (or a digital tool like Miro or Mural), have the group collaboratively list all the steps the user takes. Start high-level with phases (
Define,Compare), then drill down into specific actions (Reviews current bill,Googles "best mobile plans"). Sequence them chronologically.Step 3: Layer on Thoughts & Emotions (30 mins). For each key action, ask: “What is Jamie thinking here? What is she feeling?” Use quotes from user research. This is where empathy builds. Plot the emotional journey as a line graph below the timeline.
Step 4: Identify Touchpoints & Channels (20 mins). For each action, note the channel: Website, Phone, Email, In-store, App, etc. This reveals channel-switching friction.
Step 5: Highlight Pain Points & Opportunities (45 mins). This is the most critical phase. Go through the map and mark every point of friction, confusion, or frustration. Then, for each pain point, brainstorm a concrete opportunity. Frame opportunities as “How might we…?” statements (e.g., “How might we make plan comparisons easier?”).
3. Post-Workshop: Synthesize and Act
The Output: The primary output is a polished, digital version of the map created in a tool like Miro, Lucidchart, Smaply, or even PowerPoint/Keynote. It should be visually compelling and easy for anyone in the organization to understand.
The Action Plan: The map is useless if it just hangs on a wall. The secondary, and more important, output is a list of prioritized opportunities, assigned owners, and next steps. This turns insight into action.
Tools and Frameworks
Collaboration Tools: Miro, Mural, Figma Jam are ideal for remote or hybrid workshops.
Diagramming Tools: Lucidchart, Smaply, Touchpoint Dashboard, OmniGraffle, or even Google Slides for final visualization.
Frameworks: While the structure above is a proven method, other excellent frameworks exist. Adaptive Path’s Experience Mapping method is a foundational approach 3. Service Blueprinting is a powerful extension of journey mapping that adds the “backstage” employee actions and support processes invisible to the customer 4.
Conclusion: From Map to Action
A Customer Journey Map is more than a diagram; it’s a strategic compass. It aligns your organization’s internal machinery with the external reality of your customer’s experience. It transforms abstract data into human stories, and those stories into a clear, actionable blueprint for improvement.
In a world where customer experience is the last sustainable competitive advantage, the ability to truly see, understand, and optimize the customer journey is not just a best practice—it’s a business imperative. Stop guessing what your customers experience. Start mapping it, and you will build not just better products, but a more resilient, customer-centric organization.
References
Nielsen Norman Group. “Customer Journey Mapping 101.” https://www.nngroup.com/articles/customer-journey-mapping-101/
Aberdeen Group. “Journey Analytics: How to Improve Customer Experience and Business Results.” https://www.aberdeen.com/customer-experience/journey-analytics-how-to-improve-customer-experience-and-business-results/
Adaptive Path. “Experience Maps: A Guide.” https://adaptivepath.org/ideas/experience-maps-a-guide/
Nielsen Norman Group. “Service Blueprints: Definition.” https://www.nngroup.com/articles/service-blueprints-definition/
Gibbons, Sarah. “When and How to Create Customer Journey Maps.” Nielsen Norman Group. https://www.nngroup.com/articles/customer-journey-mapping/