A Strategic Blueprint for Business Success
In the architecture of modern business, the most critical blueprint isn’t for a product or a marketing campaign; it’s for the human experience. For over two decades, I’ve guided organizations through digital transformations, and one truth remains constant: companies that intimately understand their customers’ journeys thrive, while those that don’t, stagnate. They are building in the dark.
A Customer Journey Map (CJM) is the lantern that illuminates this path. It’s not merely a diagram; it’s a strategic narrative, a visual epic that chronicles every step, emotion, and interaction a person has with your brand. It transforms abstract data into a human story, allowing you to design with empathy and precision.
In this deep dive, we will deconstruct the customer journey map, moving beyond theory to practical application. We’ll use a real-world example—a sports fan named Juan Fernando Pacheco—to ground our discussion, and we will equip you with the frameworks, tools, and methodologies to build your own.
What is a Customer Journey Map? Beyond the Buzzword
At its core, a Customer Journey Map is a visual or graphical representation of a customer’s experience with a product, service, or brand over time and across different channels. It tells the story from the user’s perspective, not the company’s.
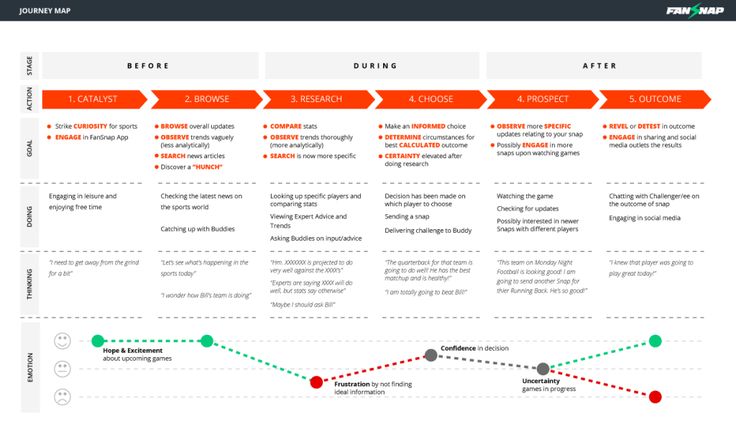
Think of it as a film script where the customer is the protagonist. The map details the scenes (touchpoints), the plot (their goals), the conflicts (pain points), and the emotional arc (their feelings). The provided image of Juan’s journey is a perfect, high-level example of this script. It doesn’t just show what he does; it attempts to capture what he thinks, feels, and does at each stage.
This holistic view is what separates a CJM from siloed metrics like conversion rates or bounce rates. It connects disparate data points into a coherent narrative, answering the critical “why” behind the “what.”
The Indisputable “Why”: The Business Impact of Journey Mapping
Creating a CJM is an investment of time and resources. The return, however, is transformative and impacts the entire organization.
Fosters Customer-Centricity and Empathy: A CJM is a powerful empathy engine. By forcing teams to walk in the customer’s shoes, it dismantles internal assumptions. When a product manager sees the frustration a user feels when a feature is hard to find, or a marketer understands the anxiety a prospect experiences during a complex checkout process, priorities shift. It aligns the entire organization around a shared understanding of the customer.
Identifies Critical Friction Points and Inefficiencies: Journey maps are diagnostic tools. They pinpoint exactly where users struggle, get confused, or abandon their task. In Juan’s map, a pain point might be “Difficulty finding reliable player stats” during the RESEARCH phase. This is a direct, actionable insight for a product team to improve a stats feature or for content teams to create more accessible analysis.
Uncovers Hidden Opportunities for Innovation: Beyond fixing problems, CJMs reveal opportunities. A moment of high engagement (e.g., “Engaging in comments and enjoying the time”) could be a chance to introduce a new community feature or a loyalty program. An unmet need (“Desiring to be more aware about player choices”) might spark an entirely new service, like a personalized player analytics dashboard.
Breaks Down Organizational Silos: A journey map is a universal language. It visually demonstrates how the efforts of Marketing, Sales, Product, and Customer Service are intrinsically linked. A poorly defined ad (Marketing) can set false expectations that lead to high support calls (Customer Service). A CJM makes these interdepartmental dependencies visible, fostering collaboration toward a common goal.
Drives Data-Driven Decision Making: A robust CJM is built on a foundation of qualitative and quantitative data. It moves decision-making from “I think” to “The data and user stories show.” This evidence-based approach ensures that resources are allocated to initiatives that will have the most significant impact on customer satisfaction and business outcomes.
Deconstructing the Blueprint: The Core Components of a CJM
Let’s use the provided “Customer Journey – Juan Fernando Pacheco” as our archetype. While formats vary, all effective maps contain these essential layers.
1. The Journey Phases (The Timeline):
This is the horizontal axis of the map, representing the linear progression of the experience.
BEFORE: The pre-purchase or pre-engagement phase. For Juan, this includes CATALYST (what triggered his need?) and BROWSE (initial, broad exploration).
DURING: The core engagement or purchase phase. This is where Juan is actively RESEARCHING and CHOOSING.
AFTER: The post-purchase or post-engagement phase. The map intriguingly labels this with PROSPECT and OUTCOME, suggesting a focus on future potential and the final result of his engagement.
2. The Customer Lens (The Layers of Experience):
This is the vertical axis, detailing what happens at each phase. The Juan map beautifully illustrates this with three key layers:
THINKING & FEELING (Cognitive & Emotional Layer): This captures the user’s internal state. What are their questions, motivations, and emotions? In the BROWSE phase, Juan thinks, “Let’s see what’s happening in the sports today,” and “To check how Bill’s team is doing.” His feeling is one of casual curiosity. This is gold for content strategists.
DOING (Behavioral Layer): The concrete actions the user takes. For Juan, this includes “Checking the latest news,” “Creating up with Buddies” (likely “Catching up with Buddies”), and “Watching the game.”
TOUCHPOINTS & CHANNELS (Interaction Layer): The “where” of the interaction. The map notes “BROWSE overall updates,” “Discover a ‘NISTKIN'” (likely a “MUST-READ” article or a specific platform), and “Social media outlets.” This tells you where to be present and optimize.
3. The Insights & Opportunities (The Strategic Output):
This is where the map transitions from description to prescription. It’s where we identify:
Pain Points: Obstacles that cause friction. The map hints at “Uncertainty” and a need for “More information.”
Opportunities: Ideas for improvement. The “OPPORTUNITIES” section in Juan’s map suggests “Promoting an effort from best” and “Promote PROBABILITIES through conversations games,” which could mean highlighting top performers and facilitating discussions around game predictions.
The Architect’s Process: A Step-by-Step Guide to Building Your CJM
Creating a powerful CJM is a methodological process. Here is the framework I’ve refined over hundreds of projects.
Foundation & Discovery (Inputs)
Objective Setting: What is the specific goal of this map? Are we mapping the journey of a new prospect, a loyal customer, or someone experiencing a specific problem? Define the scope and the persona.
Data Synthesis: Gather your raw materials. This is non-negotiable.
Quantitative Data: Google Analytics, CRM data, support ticket logs, product usage metrics (e.g., from Mixpanel or Amplitude). This tells you what is happening.
Qualitative Data: User interviews, contextual inquiries, survey open-ended responses, usability testing recordings. This tells you why it’s happening. For Juan, interviews with sports fans would be crucial.
Input: Stakeholder and SME interviews to understand business constraints and internal processes.
Synthesis & Visualization (Process)
Persona Development: Based on your data, create a detailed persona. Juan Fernando Pacheco is a persona. Flesh him out further: age, profession, core motivation (e.g., social connection, love of the game, competitive fantasy sports), and tech-savviness.
Workshop Facilitation: Assemble a cross-functional team. Using a whiteboard (physical or digital like Miro), collaboratively plot the journey.
Define the Phases: (Awareness, Consideration, Decision, Retention, Advocacy).
Map Actions & Touchpoints: What does the user do, and where do they do it?
Layer on Thoughts & Feelings: Use sticky notes to add quotes and emotions. This is where empathy builds.
Identify Pain Points & Opportunities: Use a different colored sticky note for each. Be brutally honest.
Tool Selection: Choose your weapon.
Collaboration & Diagramming: Miro, Mural, or Figma. These are ideal for real-time workshops.
Dedicated CJM Platforms: Smaply or UXPressia. These offer structured templates and sharing features, excellent for formalizing and distributing the final map.
Simple & Accessible: Google Sheets or PowerPoint. Perfect for low-fidelity starts or resource-constrained environments.
Analysis & Action (Outputs)
Prioritization: You will identify dozens of opportunities. Use a framework like the Impact/Effort Matrix to prioritize them. Focus on high-impact, low-effort “quick wins” and strategic high-impact, high-effort projects.
Create an Action Plan: Assign each key opportunity to an owner. Turn “Users are confused about player stats during research” into a specific Jira ticket: “Redesign player stats module on article pages to improve scannability and depth.”
Socialize the Map: The map is useless in a drawer. Make it a living artifact. Share it widely via company intranets, presentations, and printed posters. The map of Juan’s journey could be central to the daily stand-up of a sports media company’s product team.
Advanced Architectures: Frameworks to Elevate Your Mapping
For more mature organizations, consider these advanced lenses:
Service Blueprinting: This extends the customer journey map “behind the curtain.” For every customer action, you map the frontstage employee actions, the backstage processes, and the supporting technology. If Juan’s pain point is “slow video loading,” the service blueprint would trace this to a backstage CDN (Content Delivery Network) issue.
Emotional Journey Mapping: Quantify the emotional highs and lows. Assign sentiment scores (e.g., +2 for “Excited,” -1 for “Frustrated”) to each touchpoint and plot them on a graph. This creates a powerful visual of the emotional rollercoaster, making it clear which moments are most critical to fix or amplify.
“Jobs to Be Done” (JTBD) Framework: Complement your CJM by understanding the fundamental “job” the customer is “hiring” your product to do. For Juan, the functional job might be “get sports updates.” But the emotional and social jobs are likely “feel connected to my friends” and “be knowledgeable in social conversations.” Designing for the job often yields more innovative solutions than just improving the task.
A Living Document: The Iterative Cycle of Journey Mapping
The market changes. Customer expectations evolve. Your product grows. A customer journey map is not a one-and-done project; it’s a living document.
Establish a rhythm of review and iteration. Revisit your primary journey maps quarterly. After a major product launch or a shift in market strategy, run a “journey mapping sprint” to reassess and update the narrative. This ensures your organization’s understanding of the customer never becomes outdated.
Conclusion: From Map to Manifesto
Decoding the customer journey is the first, most critical step in building a truly customer-centric organization. The map of Juan Fernando Pacheco is more than a diagram; it’s a manifesto. It declares that the company’s success is inextricably linked to his success in achieving his goals—be they finding community, proving his knowledge to his buddies, or simply enjoying the thrill of the game.
By adopting the disciplined, empathetic, and collaborative practice of customer journey mapping, you stop guessing and start knowing. You move from pushing products to pulling customers through a thoughtfully designed experience that feels less like a transaction and more like a partnership. In the architecture of your business, let the customer journey map be your master blueprint for growth, loyalty, and lasting success.
References & Further Reading
NN/g: Journey Mapping 101
URL:
https://www.nngroup.com/articles/journey-mapping-101/The foundational article from the world’s leading UX research firm.
Interaction Design Foundation: Customer Journey Maps
URL:
https://www.interaction-design.org/literature/topics/customer-journey-mapsAn excellent, in-depth resource with detailed explanations and examples.
Harvard Business Review: The Truth About Customer Experience
URL:
https://hbr.org/2013/09/the-truth-about-customer-experienceA classic article that argues customer experience is a complex journey, not a single interaction.
Miro Blog: How to Create a Customer Journey Map
URL:
https://miro.com/blog/customer-journey-map/A practical, tool-specific guide with templates.
Smaply: Customer Journey Map Tool & Resources
URL:
https://www.smaply.com/A dedicated platform for journey mapping with a blog full of best practices.
UXPressia: Customer Journey Mapping Guide
URL:
https://uxpressia.com/customer-journey-map-guideAnother comprehensive tool provider with a detailed guide and templates.
Tools & Frameworks Summary
Frameworks: Customer Journey Mapping, Service Blueprinting, Jobs to Be Done (JTBD), Impact/Effort Matrix.
Inputs: User Interviews, Analytics Data, Support Logs, Stakeholder Workshops.
Process Tools: Miro, Mural, Figma (for collaboration); Smaply, UXPressia (for formal mapping).
Outputs: Prioritized Action Plan, Shared Company Vision, Empathy-Building Artifact, Service Blueprint.