How the AARRR framework turns user behavior into a growth strategy
I have spent more than twenty years sitting on both sides of the table.
I started my career as a product and UX designer, fighting for users who would abandon a confusing onboarding flow. Later, I moved into business development and commercial strategy, negotiating enterprise technology deals across Latin America and leading RFx processes where every claim had to survive scrutiny from a procurement team.
They look like different jobs
In practice, they are the same job seen from different angles: creating value a person can feel, and proving value a buyer can verify. In both seats I learned that growth is not a mystery.
It is a system, and systems can be measured.
Of all the measurement systems I have used, the one I keep returning to is the one with the strangest name: pirate metrics, better known as the AARRR framework, created by investor Dave McClure.
The name makes executives smile
The discipline behind it makes boards money. What follows is the way I use the framework in real life — as a lens for product decisions, as a structure for commercial conversations, and as an honesty test for any growth story, including the ones we tell enterprise buyers in a proposal.
What pirate metrics actually measure
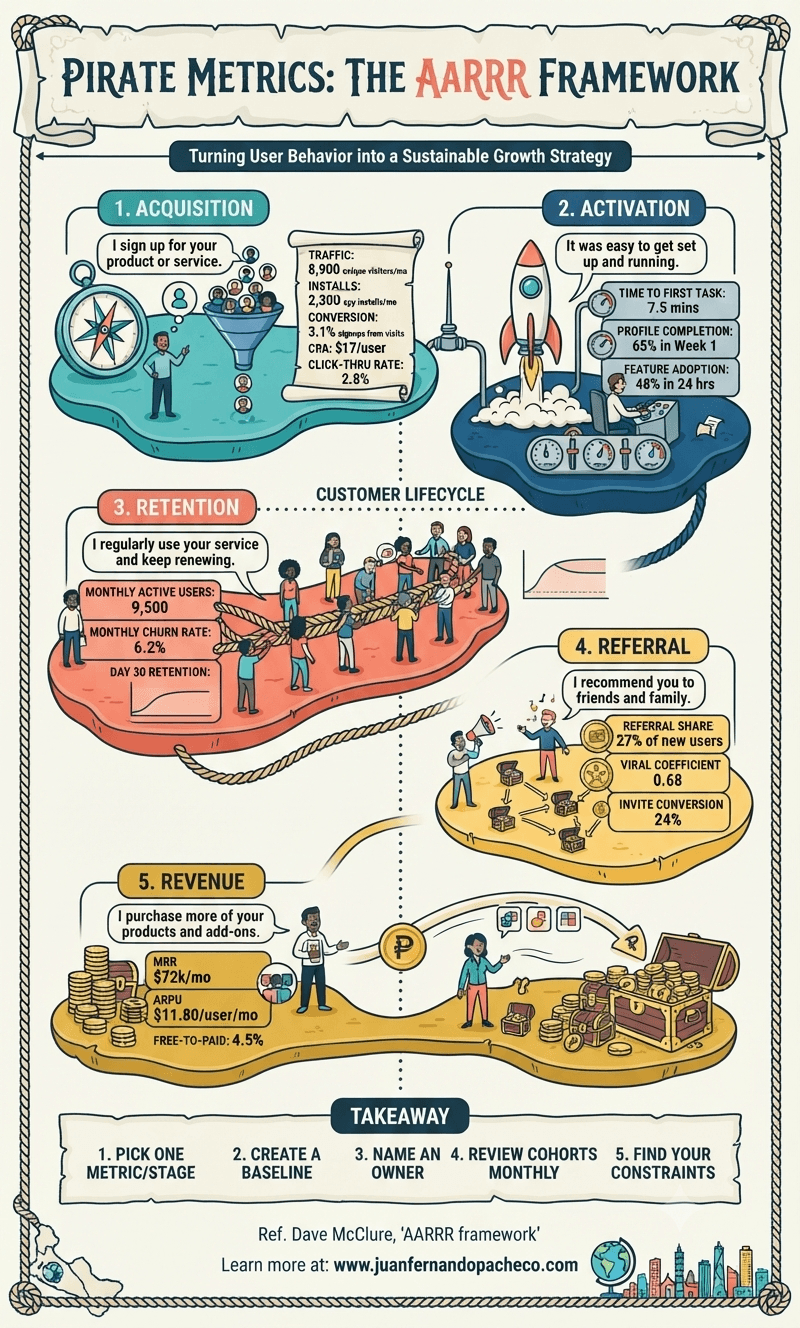
The framework arranges the customer lifecycle into five stages.
- Acquisition: how people find you, and whether they convert.
- Activation: whether the first experience is good enough that the user reaches real value.
- Retention: whether they come back and stay.
- Referral: whether they recommend you to others. Revenue: whether they pay in a way that sustains and grows the business.
The power of the framework is not in the definitions; it is in the order.
Each stage constrains the next one, so the sequence tells you where to work. A weakness in retention will swallow any acquisition budget you pour into the top. A weakness in activation will quietly tax every other investment.
That is why the framework stays useful year after year: channels change, algorithms change, pricing models change, but the sequence of human decisions — notice, try, stay, recommend, pay — does not.
A trick that makes it even more useful is to translate each stage into a sentence the customer says.
- Acquisition is “I sign up for your product or service.”
- Activation is “it was easy to get set up and running.”
- Retention is “I regularly use your service and keep renewing.”
- Referral is “I recommend you to friends and family.”
- Revenue is “I purchase more of your products and add-ons.”
When you write metrics this way, teams stop arguing about dashboards and start arguing about human experiences, which is where the truth lives.
To keep the rest of this post concrete, we will follow one hypothetical subscription product with a consistent set of example numbers across the five stages.
Acquisition: traffic is easy, conversion is honest
Our example product receives 8,900 unique visitors per month and 2,300 app installs, converts 3.1% of visits into signups, pays about $17 per acquired user, and sees a 2.8% click-through rate on its campaigns. None of these numbers is good or bad in isolation. They become information when you compare them against your own history and your own economics.
Acquisition is where most teams start, because it is the easiest stage to buy.
You can always rent attention. The honest metrics are the ones that describe what happens after the click: the share of visits that turn into signups, the cost per acquisition measured against what a user will pay you over their life, the click-through rate as a rough signal of whether your message matches a real need.
Two evergreen principles apply.
- First, measure acquisition in cohorts by channel, because an average hides almost everything; a channel that brings cheap, curious tourists is worse than a channel that brings fewer, serious users.
- Second, treat the cost per acquisition as a contract with your future margin: if it costs $17 to acquire a user who will never pay you $17, you have not built growth; you have built a subscription to your own losses.
In enterprise sales we accept this discipline naturally — we weigh the cost of pursuing a tender against the probability of winning and the value of the contract. The same arithmetic applies to a $17 user.
Activation: where the designer in me starts
Activation is the stage where my designer instincts kick in, and it is the stage I believe most teams underestimate. Our example: 7.5 minutes to complete the first meaningful task, 65% of users completing their profile in week one, and 48% adopting a core feature within the first 24 hours.
Activation measures the distance between a promise and a felt value.
Marketing creates an expectation; onboarding either confirms it or kills it. The 7.5 minutes to first task is the single most design-sensitive number in the whole framework. Every unnecessary field, every ambiguous label, every forced product tour adds seconds, and seconds are where trust leaks out. If a user reaches real value in minutes, the rest of the lifecycle gets easier; if they reach confusion, every later metric suffers.
Activation is also the most controllable stage in the framework.
You cannot command loyalty, but you can redesign onboarding this quarter and measure the difference next quarter. Completion rates and early feature adoption give you a precise map of where the experience breaks. If I had to pick one place where product design directly moves revenue, it is activation, because it is the moment the customer decides whether the story you told them was true.
Retention: the compound interest of product strategy
Our example product reports 9,500 monthly active users, a 6.2% monthly churn rate, and 29% of users still active 30 days after signup.
Here is the arithmetic every founder and every commercial leader should feel in their chest
A 6.2% monthly churn, compounded over twelve months, leaves you with less than half of your starting users. Retention is compound interest working in reverse, which is why it deserves the same reverence finance teams give to interest rates. Small improvements in churn, sustained over time, change the value of a company more than most campaigns ever will.
Look at the shape of the curve, not just the number at day 30
A retention curve that falls and then flattens tells you that a core of users has found a permanent place for your product in their lives. A curve that never flattens tells you that you are renting users, not earning them, and that every cohort is a bucket with holes. In commercial language, retention is renewal. In enterprise software, the renewal rate is the retention metric, and it is usually the first number a sophisticated buyer probes, because it predicts whether the vendor will still be a healthy partner in five years.
Referral: advocacy you can measure
In our example, 27% of new users arrive through referrals, the viral coefficient is 0.68, meaning each user brings in 0.68 new users, and 24% of the invites sent turn into signups.
A viral coefficient below one does not mean failure.
It means word of mouth is a tailwind rather than an engine, which is the normal and healthy state of most good businesses. The deeper reason to track referral is that it is the only stage in the framework that measures trust.
Nobody recommends a mediocre product to a friend, because the price is paid in reputation. Referral metrics are therefore an early warning system for brand equity, long before it shows up in revenue.
In relationship-driven markets — and most of Latin America is exactly that — referral is not one channel among many; it is the channel. Deals, partnerships and even enterprise tenders move on reputation. The strongest RFx response is the one the buyer already half-believes because a peer they trust recommended you. Advocacy, measured honestly, tells you how much of that asset you have.
Revenue: where the story meets the income statement
Our example closes the lifecycle with $72,000 of monthly recurring revenue, $11.80 of average revenue per user per month, and 4.5% of free users converting to paid.
Revenue is where the lifecycle becomes a business
And the three numbers form a small system of their own. The free-to-paid rate tells you whether the paywall sits in the right place: too low and you may be charging for value that should tease, too high and you may be taxing adoption.
Average revenue per user tells you whether pricing captures the value users actually feel, or leaves it on the table. Monthly recurring revenue tells you whether the other four stages are compounding or merely repeating.
Notice the customer sentence for this stage
“I purchase more of your products and add-ons.”
That is expansion revenue, the clearest evidence that value keeps growing after the sale. It is the reason mature vendors obsess over land-and-expand motions, and the reason a buyer’s second contract tells you more than their first. Monetization, done well, is not a billing detail. It is a product feature, and one of the most strategic ones you will ever design.
Pirate metrics in enterprise deals and RFx processes
Here is the part my colleagues in commercial roles will find most useful
The lifecycle does not stop at consumer startups. An enterprise buyer walks the same five stages:
- Discover you (acquisition)
- Run a pilot or a proof of concept (activation)
- Renew and expand (retention)
- Agree to be a reference for you (referral)
- Pay more over time (revenue).
When I structure a proposal, I design it around that sequence, because a proposal is really an onboarding document for a very expensive product.
And when we are the vendor being evaluated, I volunteer our own pirate metrics in the response
A buyer choosing a technology partner is buying the future vitality of the vendor. Showing churn, retention curves, and expansion revenue turns marketing prose into evidence, and evidence is what survives a procurement review. In high-stakes RFx execution, the vendor that can prove its own lifecycle health wins more often than the vendor that merely promises it.
A simple routine to put the framework to work
You do not need a data team to start.
You need five commitments, written down and reviewed on a cadence:
- one metric per stage, five in total, each with its customer sentence written above it so nobody forgets who the metric is for;
- a baseline for each metric, captured before any experiment begins, because an experiment without a baseline is an anecdote;
- a named owner for each stage, because a metric without an owner is a suggestion;
- a fixed cadence to review cohorts, monthly for most teams, since totals flatter and cohorts tell the truth;
- one constraint, the weakest stage where the curve breaks, where the majority of your experiments concentrate.
Pouring traffic into a leaky bucket is the classic error the framework exists to prevent. Find the constraint first, then spend.
Mistakes that keep repeating
The mistakes are also evergreen.
Optimizing acquisition before fixing retention, which scales loss efficiently. Celebrating vanity metrics like cumulative registered users while active users quietly shrink.
Copying benchmarks as targets, when the numbers in any article, including this one, are illustrations, not goals. And treating the framework as a funnel to push people through, instead of what it actually is: a diagnostic that tells you where the experience breaks.
The takeaway
The name is a joke; the discipline is serious.
Notice, try, stay, recommend, pay — that sequence will outlive every channel, every algorithm, and every trend you and I will ever see. Whether you are designing an onboarding screen, pricing a subscription, or negotiating an enterprise contract, the question is always the same: where in the lifecycle is the truth, and what will we do about it this week?
Find your constraint, fix it, and let the compounding do the rest.