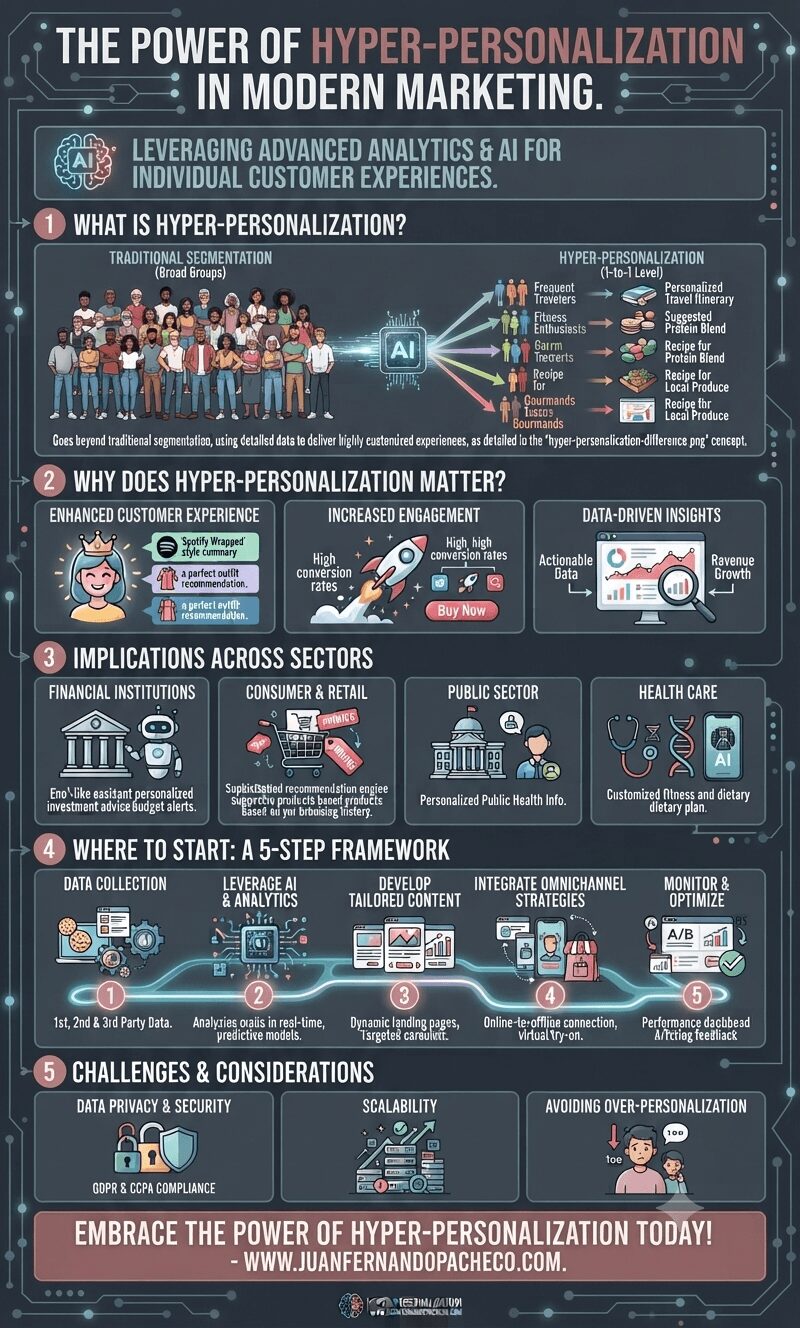
Adopting a hyper-personalized marketing approach not only meets the evolving expectations of consumers but also positions organizations for success in an increasingly complex digital landscape. As companies navigate this journey, those that prioritize personalization will undoubtedly stand out in the minds of their customers.
Author: Juan Fernando Pacheco
I am Juan Fernando Pacheco, a Business Development Manager, Senior Product Designer, and UX Designer with 20+ years of experience working on user-centered experiences, developing products and services driven by research and design.
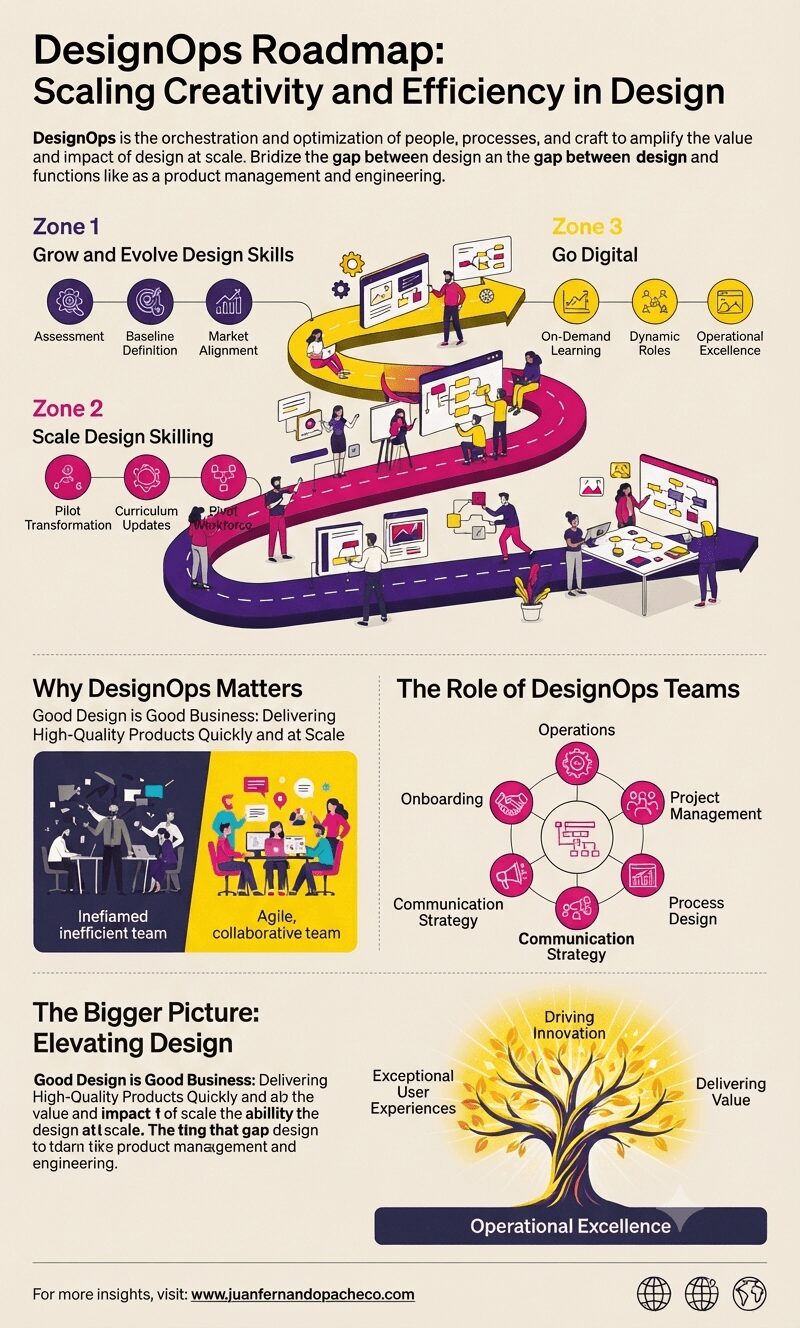
DesignOps is the orchestration and optimization of people, processes, and craft to amplify the value and impact of design at scale.
It focuses on streamlining design workflows, fostering collaboration, and enhancing the efficiency and effectiveness of design processes.
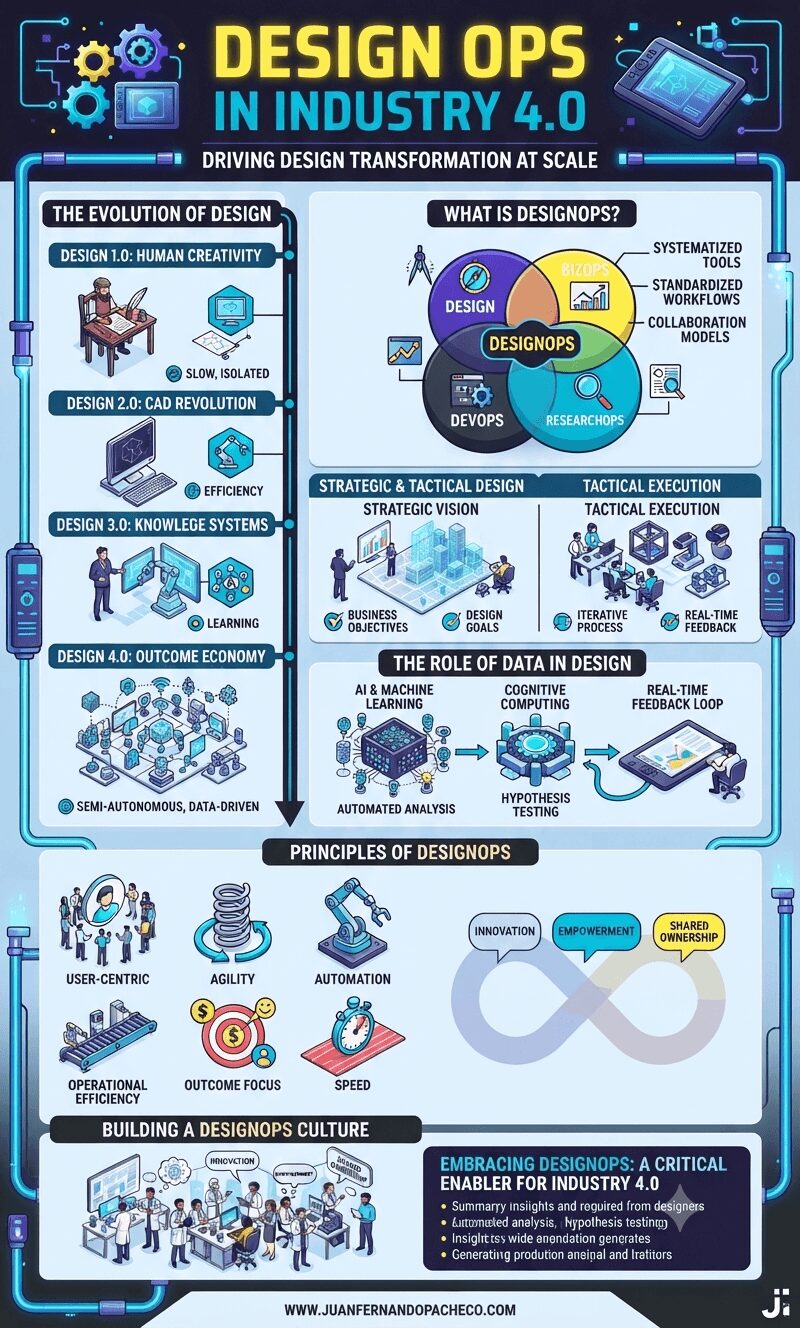
As organizations navigate the complexities of Industry 4.0, DesignOps emerges as a critical enabler of success. By operationalizing design, fostering collaboration, and leveraging data, companies can deliver innovative solutions at scale.
Embracing DesignOps is not just about optimizing processes; it’s about transforming how businesses think, design, and deliver value in a rapidly changing world.
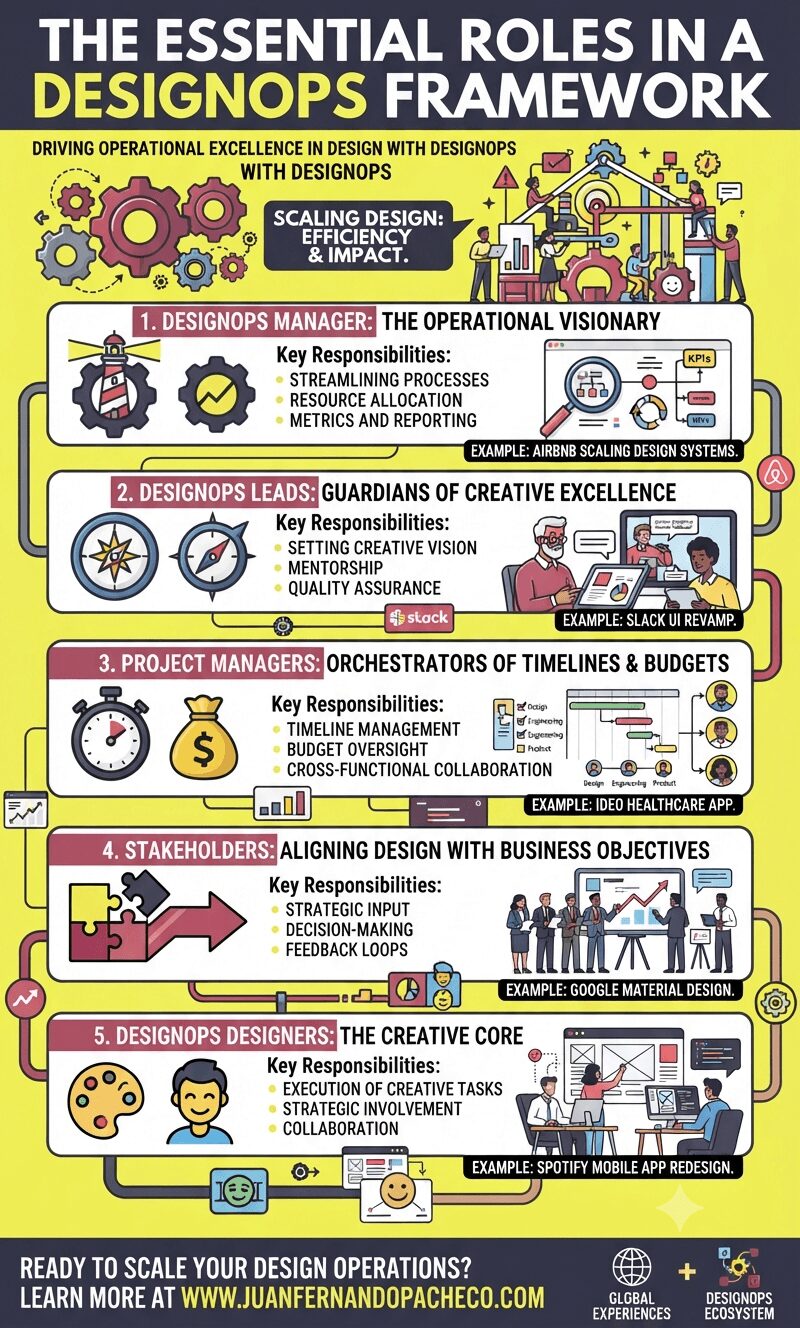
The rapid pace of digital transformation has propelled organizations to place greater emphasis on design as a strategic lever for innovation and customer satisfaction.
Yet, scaling design efforts across teams, tools, and workflows remains a formidable challenge. This is where DesignOps (Design Operations) emerges as a critical discipline, providing the scaffolding for designers to focus on what they do best: creating impactful experiences.
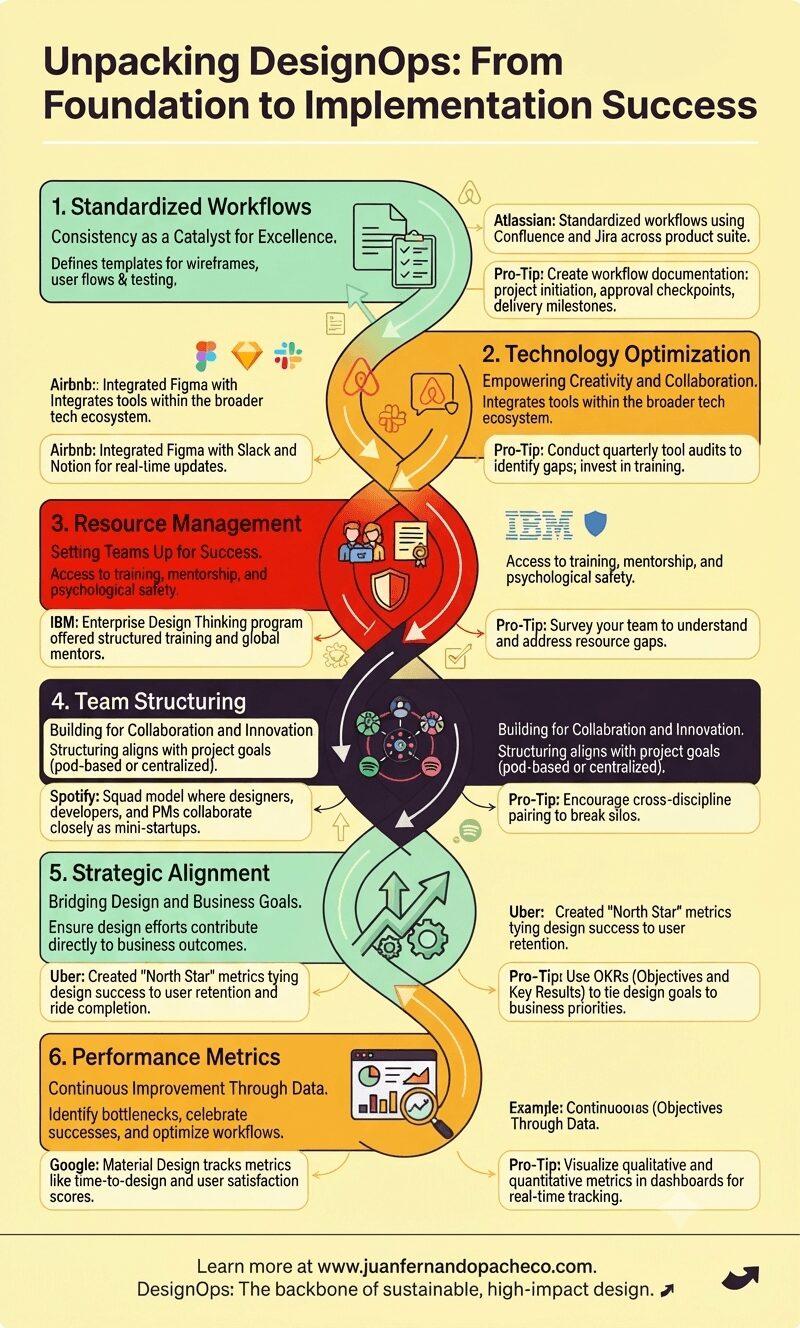
DesignOps isn’t just about scaling design; it’s about enabling designers to focus on what they do best: crafting exceptional user experiences.
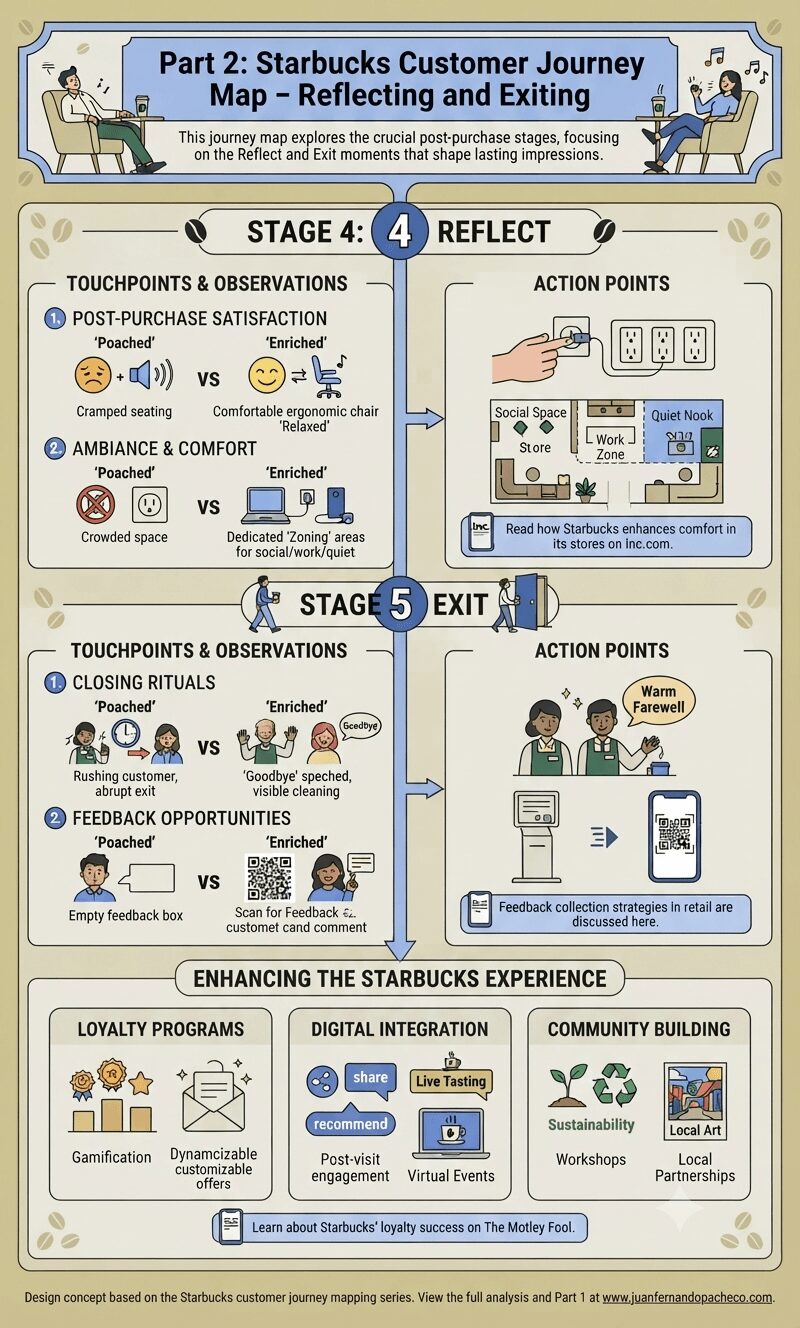
The second half of the Starbucks customer journey map focuses on post-purchase experiences, including the Reflect and Exit stages.
These stages are critical in leaving a lasting impression and influencing future visits.
Here, we delve into touchpoints, identify areas for improvement, and propose actionable strategies to ensure customer experience satisfaction remains high.
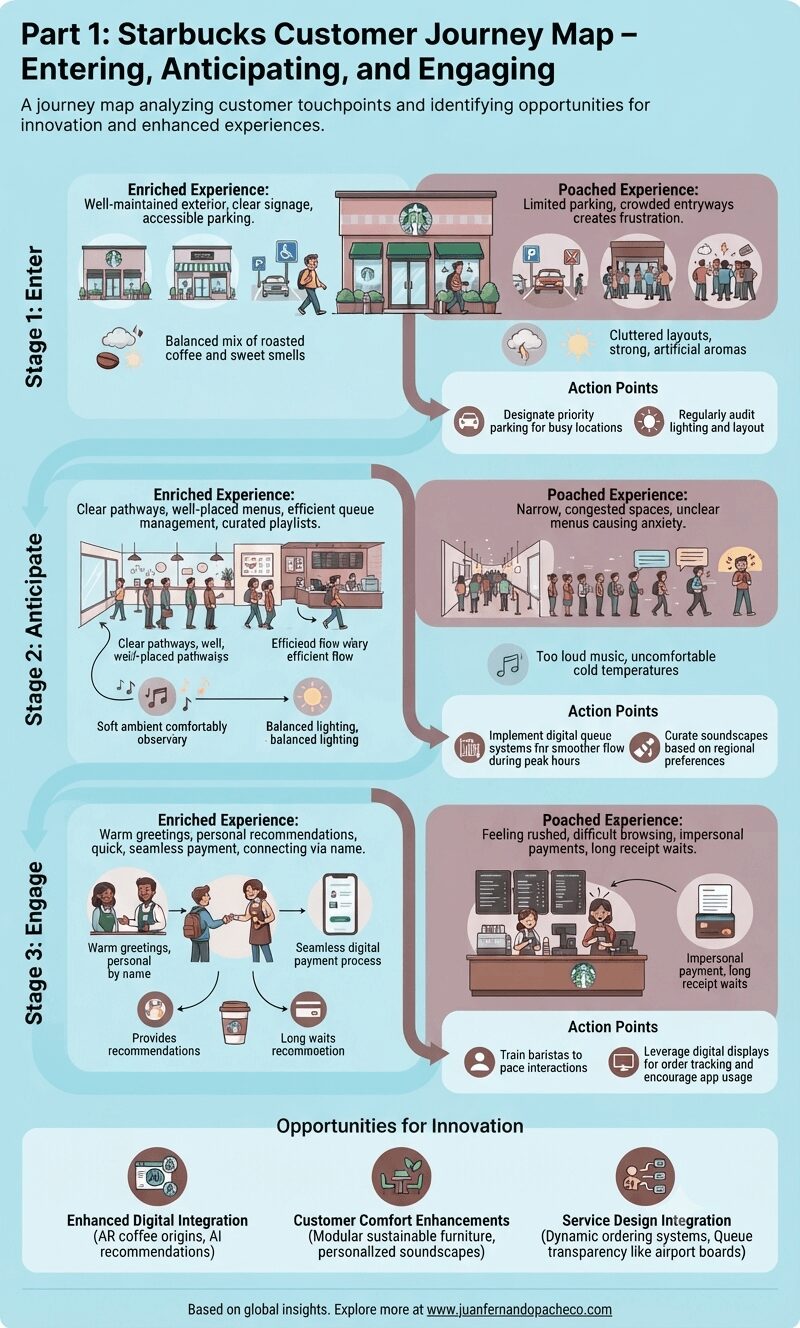
The Starbucks customer journey is more than just a coffee run; it’s a dynamic interaction of sensory, emotional, and functional elements. Each stage has distinct touchpoints that shape perceptions and satisfaction levels. Here, we’ll unpack the journey’s early stages.
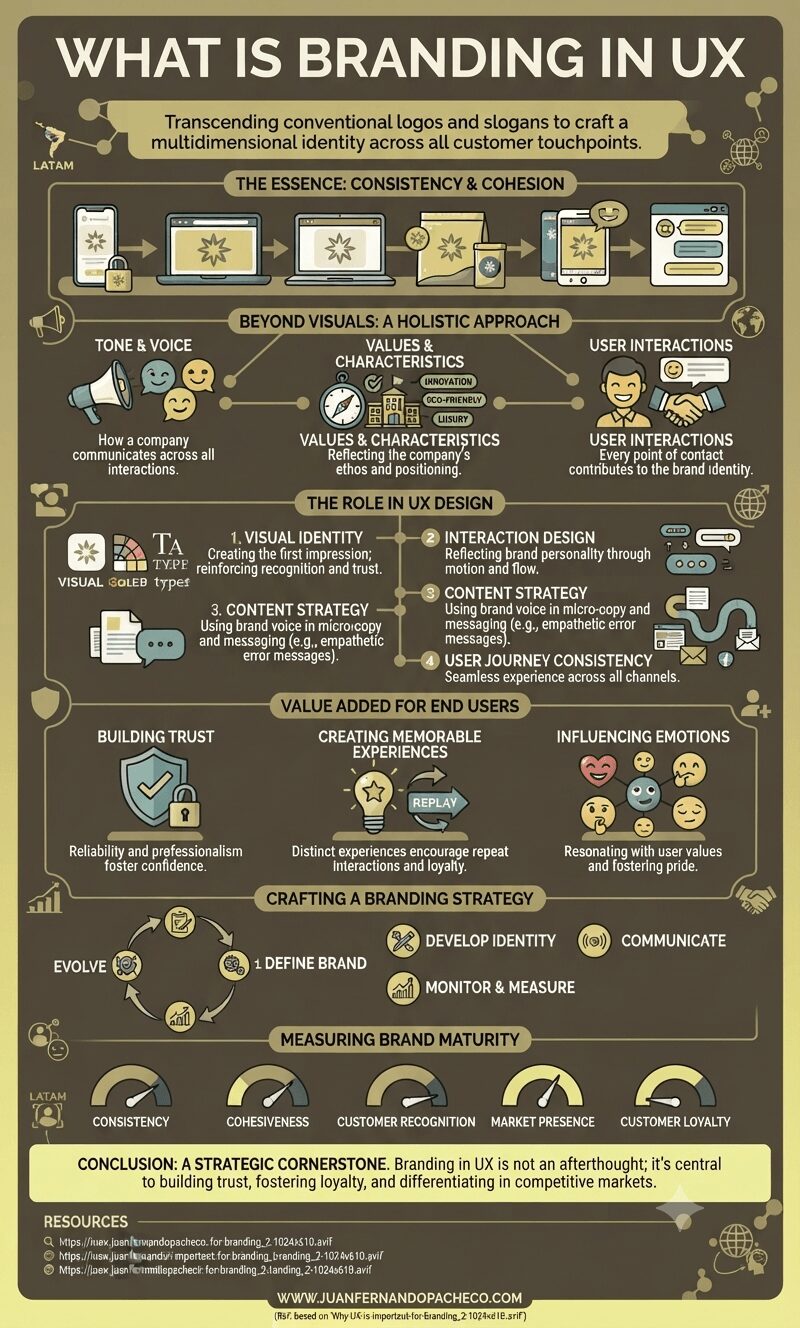
Branding from a UX perspective is a strategic endeavor that goes beyond visuals. It’s about creating a consistent, cohesive, and memorable experience that resonates with users at every touchpoint. By integrating branding into UX design, companies can build trust, foster loyalty, and differentiate themselves in competitive markets.
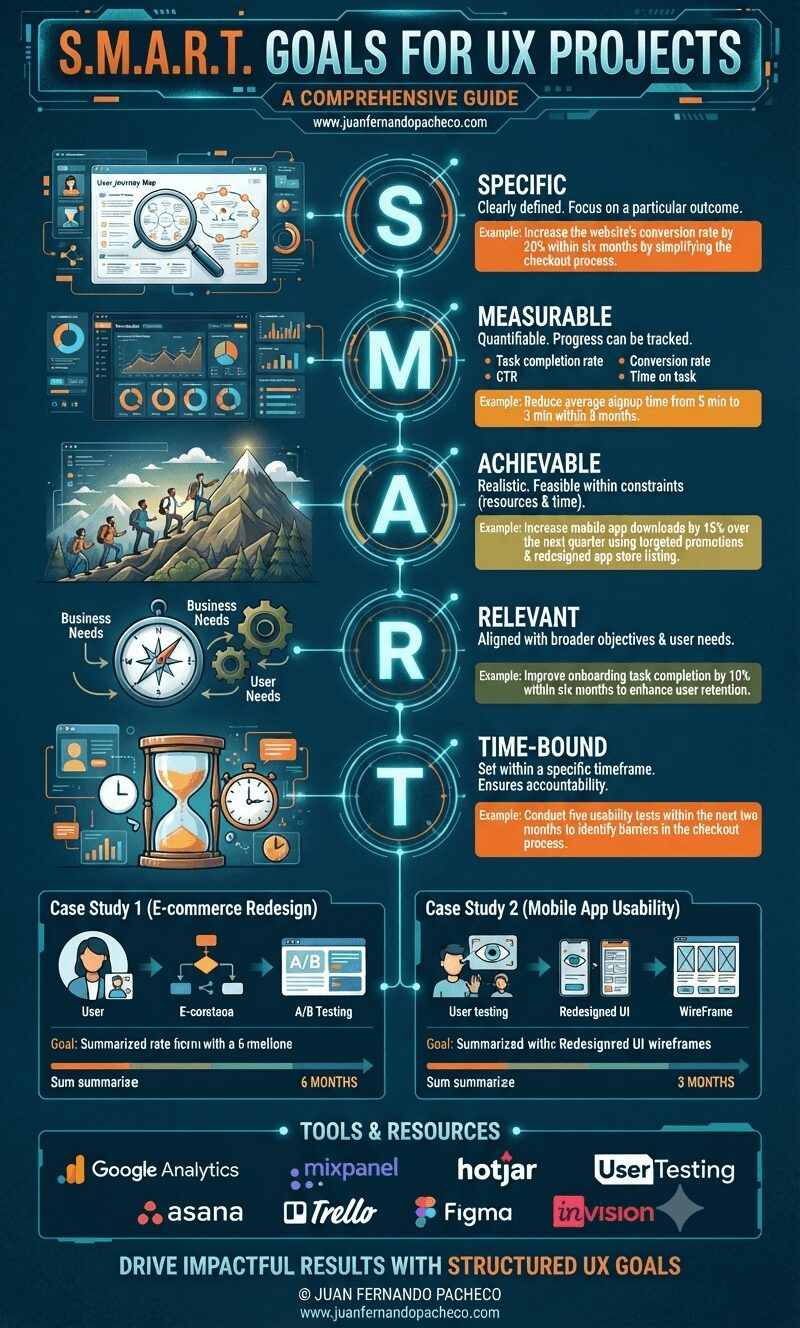
Setting clear, actionable, and achievable goals is critical to the success of any UX project.
Without defined objectives, measuring progress, evaluating outcomes, or ensuring alignment with user and business needs becomes challenging.
That’s where the S.M.A.R.T. framework comes in. In this post, we’ll explore how to write S.M.A.R.T. goals for UX projects and why this approach can dramatically improve project outcomes.
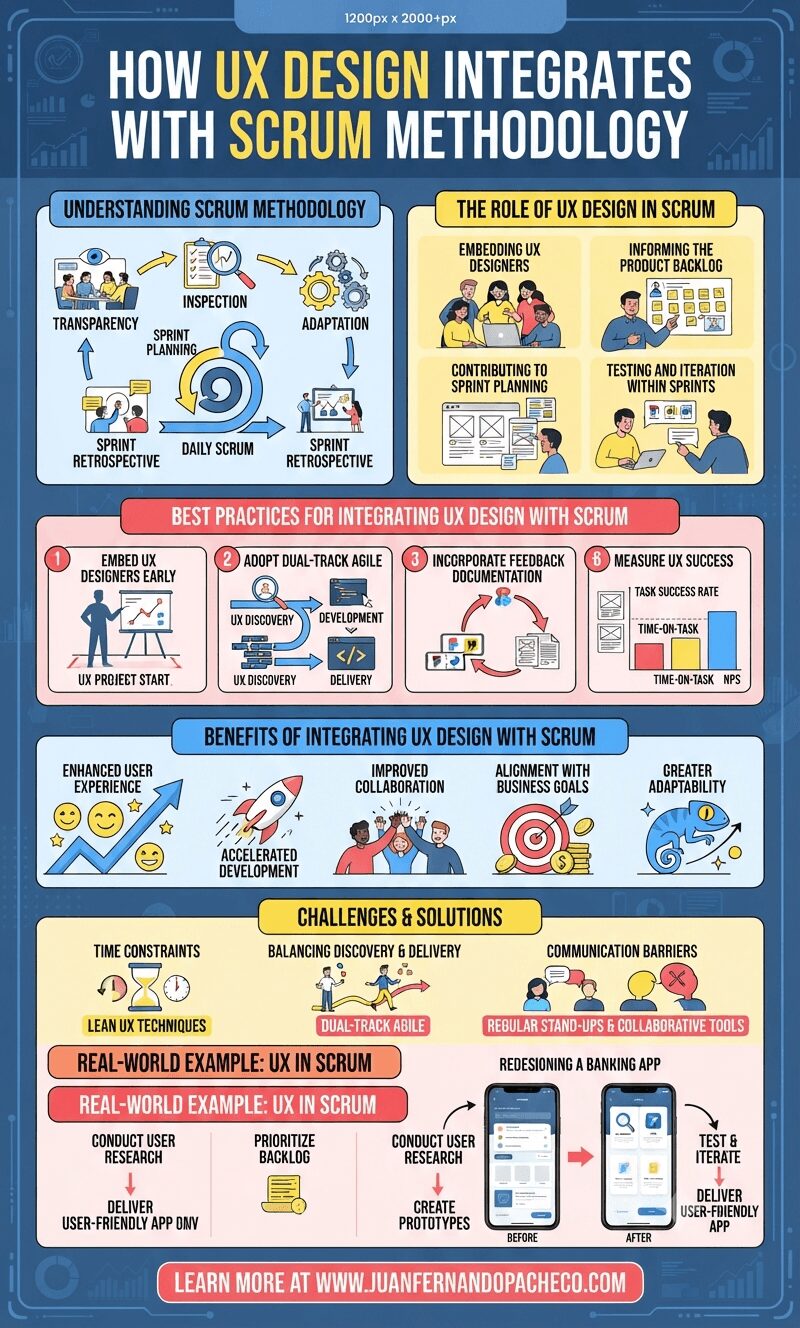
Integrating UX design into Scrum is more than a best practice; it’s a necessity for delivering products that resonate with users. By embedding UX designers in teams, leveraging agile design methods, and prioritizing user feedback, organizations can achieve faster development cycles, improved collaboration, and superior user experiences.
As the demand for user-centric products grows, mastering the integration of UX design with Scrum will remain a critical skill for successful product teams.