The Evolution of Customer Journey Mapping
For decades, businesses have relied on customer journey maps to visualize interactions between brands and consumers. But traditional maps often lack the analytical rigor needed to predict behavior in today’s data-driven world.
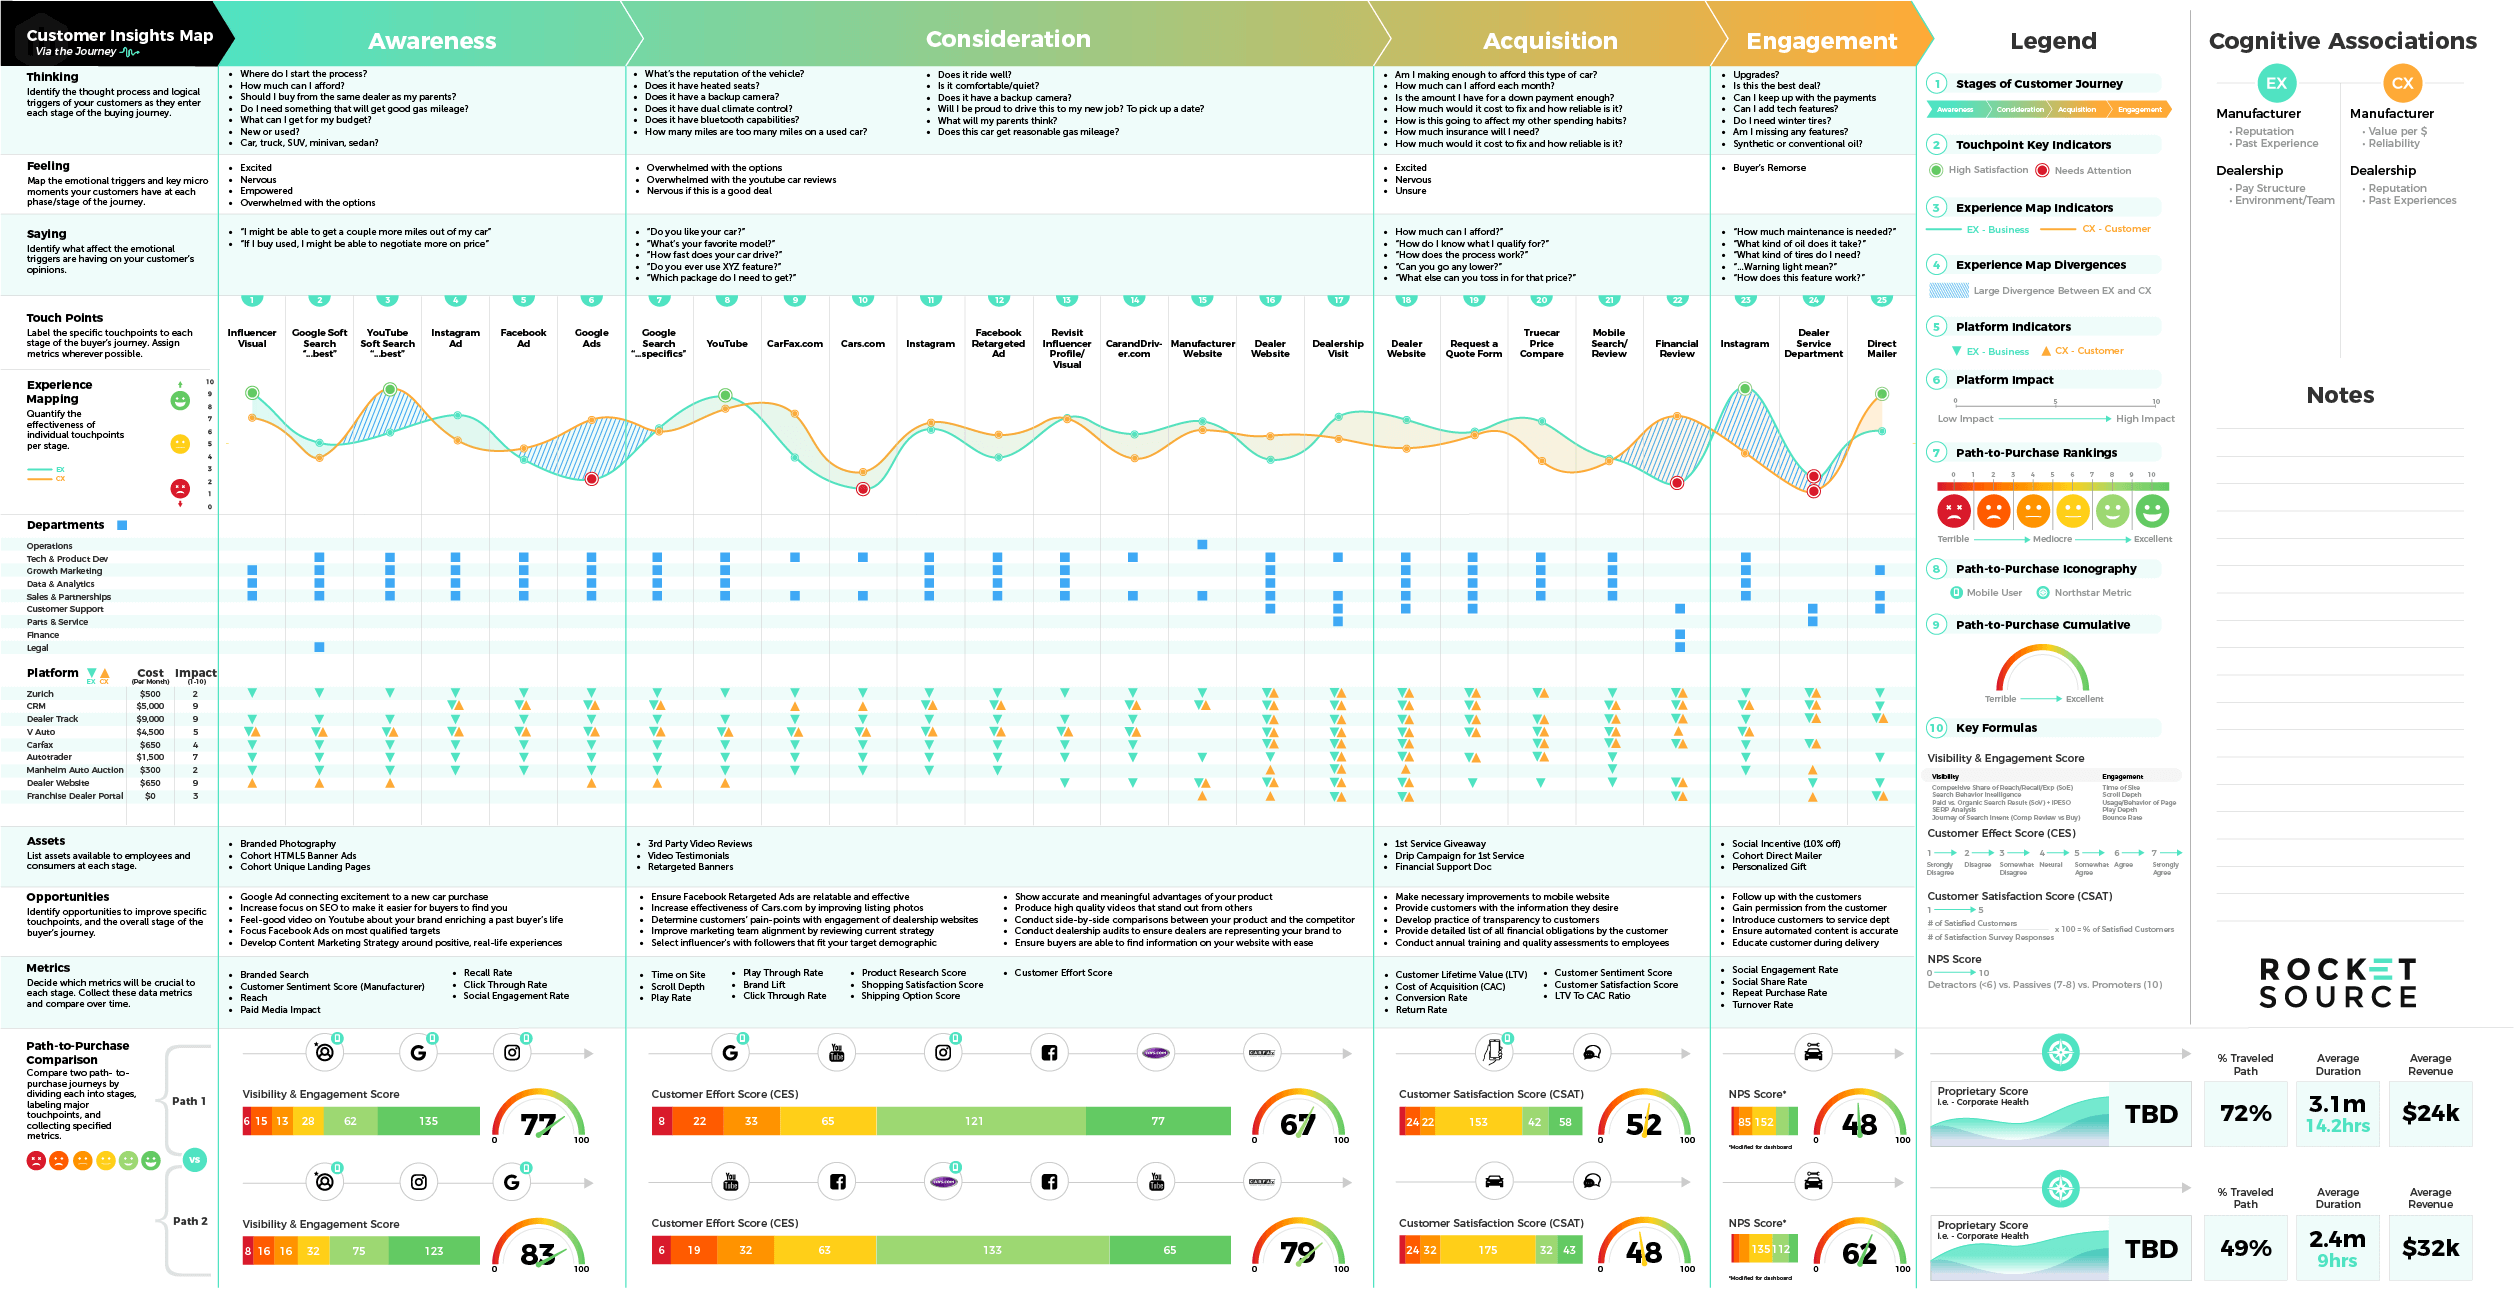
Enter the Customer Insights Map—a fusion of qualitative empathy, quantitative analytics, and strategic frameworks like StoryVesting and Hoshin methodology.
Developed over 17+ years and previously reserved for RocketSource clients and training alumni (including Microsoft solution architect Clayton Barlow), this tool bridges the gap between intuition and evidence.
In this deep dive, we’ll unpack its anatomy, applications, and why it’s a game-changer for modern enterprises.
Why Traditional Journey Maps Fall Short
Customer journey maps have long been criticized for oversimplifying complex buyer behavior. They often:
- Rely on assumptions rather than data.
- Ignore post-purchase experiences.
- Fail to connect touchpoints to business outcomes.
A 2021 Gartner report highlights that 80% of CX projects fail due to fragmented data and siloed teams. The Customer Insights Map addresses these gaps by integrating empathy mapping, Convergence/Divergence bands, and cross-departmental metrics.
Anatomy of the Customer Insights Map
Let’s dissect the 12 core components that transform this from a static map into a dynamic “digital twin” of your customer experience:
1. Thinking: The Logical Triggers
Identify the rational drivers at each stage (e.g., price comparisons, feature research). For example, McKinsey’s Consumer Decision Journey Model emphasizes that 60% of consumers conduct online research before purchasing.
2. Feeling: Emotional Triggers & Micro-Moments
Emotions drive 95% of purchasing decisions, per Harvard Business School. Map moments like frustration during checkout or delight at unboxing.
3. Saying: Voice-of-Customer (VoC) Insights
Leverage tools like Qualtrics to capture verbatim feedback. Example: “The checkout process took too long.”
4. Touchpoints: Quantified Interactions
Assign metrics (e.g., bounce rates, conversion rates) to each touchpoint. Forrester’s CX Index can benchmark performance.
5. Experience Mapping: Employee & Customer Alignment
Use dual-axis scoring to align internal workflows with external perceptions. Microsoft’s Employee Experience Platform offers tools to bridge this gap.
6. Departments: Breaking Silos
Highlight teams involved at each stage (e.g., Marketing → Sales → Support). Salesforce’s State of Service Report reveals that 71% of service agents feel siloed from other departments.
7. Platforms: Cost vs. Impact Analysis
Audit tools like Shopify (pre-purchase) vs. Zendesk (post-purchase). Gartner’s Cost Optimization Framework can guide ROI decisions.
8. Assets: Resource Inventory
List content, training materials, or tech stack components available. HubSpot’s Content Hub exemplifies asset centralization.
9. Opportunities: Friction-to-Flow Gaps
Apply JTBD (Jobs-to-Be-Done) theory to identify unmet needs.
10. Metrics: KPIs Aligned to Business Goals
Prioritize metrics like NPS, CES, or churn rate. Bain & Company’s loyalty research ties NPS to revenue growth.
11. Path-to-Purchase Comparison: A/B Testing at Scale
Compare journeys (e.g., mobile vs. desktop) using tools like Google Optimize.
12. Legend: Universal Clarity
Standardize symbols and scales to avoid misinterpretation.
Reading the Map: Horizontal vs. Vertical Analysis
Horizontal View: The Buyer’s Chronological Journey
Track left-to-right progression to spot friction (e.g., cart abandonment). Adobe’s Digital Economy Index shows mobile abandonment rates as high as 85%.
Vertical View: Stage-Specific Deep Dives
Analyze top-to-bottom metrics at a single stage (e.g., Consideration). For instance, if “Feeling” scores dip here, investigate if Marketing’s messaging misaligns with customer emotions.
The Bow-Tie Funnel: Beyond Acquisition to Loyalty
The Customer Insights Map isn’t complete without its post-purchase counterpart—the path-to-loyalty. While traditional funnels end at conversion, the bow-tie model emphasizes retention:
Key Differences in Post-Purchase Mapping:
- Focus: Onboarding, support, and community-building.
- Metrics: Churn rate, CLV (Customer Lifetime Value), and referral rates.
- Tools: Platforms like Gainsight for customer success analytics.
A CMO Council study found 60% of consumers rate post-purchase experiences as “underwhelming”, while ThinkJar notes 67% leave due to poor service.
Case Study: Microsoft’s Higher Education Transformation
Clayton Barlow, a Microsoft solution architect, applied the Customer Insights Map alongside Hoshin Kanri (a Japanese strategic planning method) to unify university CIOs’ tech stacks. By mapping both student acquisition (path-to-purchase) and alumni engagement (path-to-loyalty), institutions reduced attrition by 22% in 18 months.
Conclusion: The Future of Intelligent CX
The Customer Insights Map isn’t just a tool—it’s a mindset shift. By blending empathy with analytics, businesses can:
- Predict churn before it happens.
- Align departments under a shared vision.
- Turn customers into advocates.
As you implement this map, remember: loyalty isn’t won at checkout. It’s earned through every post-purchase interaction. Ready to transform your CX? Explore RocketSource’s training programs or dive deeper with Hoshin Kanri methodologies.