TAM, SAM, SOM, and early evangelists: market sizing that helps you win, not just dream
Every business conversation eventually arrives at the same question:
How big is this opportunity?
And most answers are wrong in one of two directions. Either the number is so huge that it means nothing, or it is so small that nobody wants to invest. After more than twenty years in technology, first designing user experiences and later leading business development and complex RFx processes across Latin America, I have learned one reliable pattern:
The quality of the market sizing conversation predicts the quality of the deal.
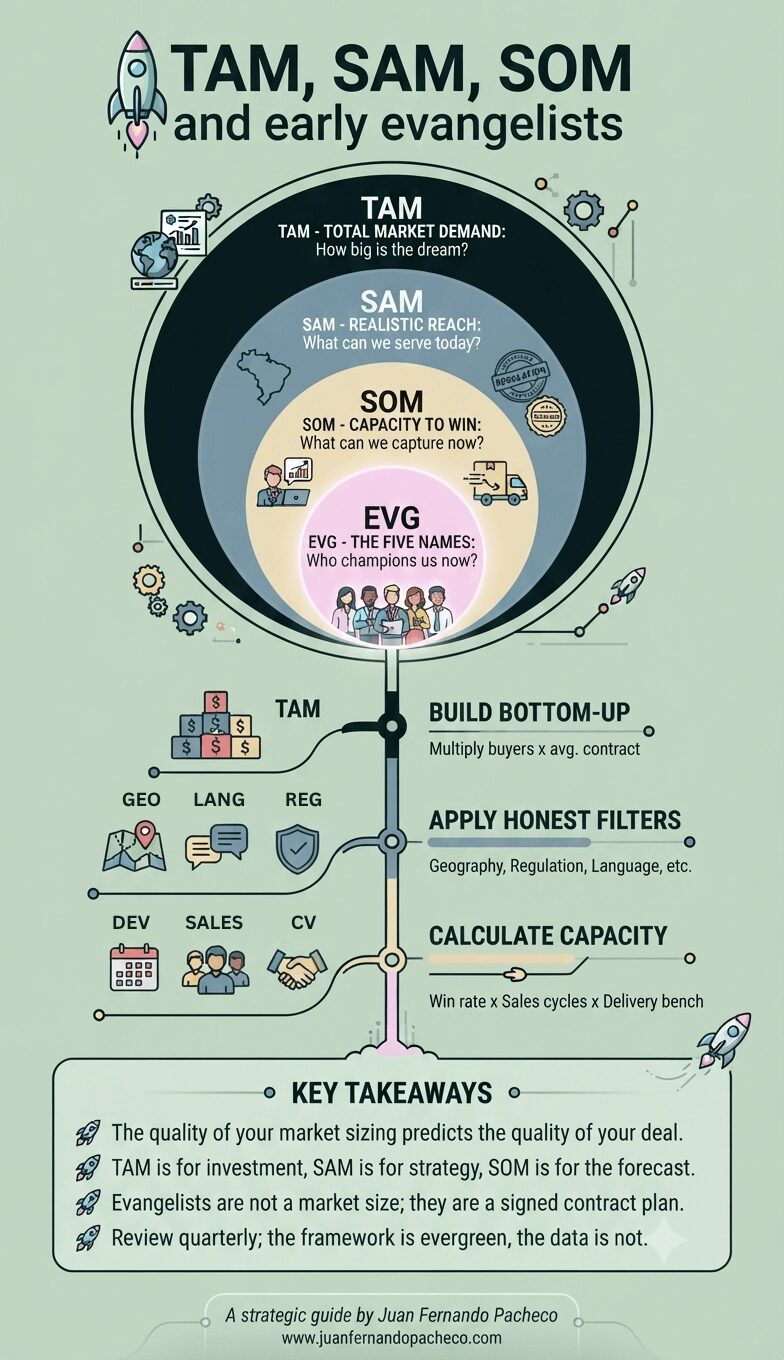
The framework that keeps that conversation honest is the one shown in the diagram at the top of this post: TAM, SAM, SOM, and a small red circle that most teams ignore: the early evangelists.
This post explains each layer the way I use them in real commercial work, how to estimate them without fooling yourself, and how to keep them useful for years, not just for one slide deck.
The three circles, in plain language
The total addressable market, or TAM
Is the widest view. It is the total demand for the kind of solution you offer, everywhere, assuming no constraints at all. If you sell digital banking platforms, your TAM is every bank, credit union, fintech, and lender that could reasonably need such a platform, multiplied by what they would pay in a year. The TAM answers the question in the diagram: How big is the largest market? Its job is not to be precise. Its job is to tell you whether the space is worth your time and your investment.
The serviceable available market, or SAM
Is the part of that demand your product and model can actually serve today. This is where reality enters: geography, language, regulation, channel, technology fit. A solution certified for one country’s data sovereignty rules does not serve another country just because the map says so. The SAM answers a harder question: how big is the market you could reach now?
The serviceable obtainable market, or SOM
Is the slice of SAM you can realistically capture with the resources you currently have: salespeople, delivery teams, partners, budget, brand. The SOM answers the only question that pays salaries: what can we win, not in theory, but with the team we have? This is the number that should drive your target, your forecast, and your hiring.
EVG: early evangelists
And inside the SOM sits the circle the diagram labels EVG: early evangelists. They are not a market size. They are the few specific customers who feel the problem most intensely, already look for a fix, and can buy and champion you. We will come back to them, because they are the difference between a sized market and a signed contract.
Why this framework does not expire
Tools change, channels change, even business models change, but the logic of concentric circles does not. Any serious commercial decision, whether you are launching a product, answering an RFP, opening a country, or choosing between two segments, is a decision about where demand is real, where you can compete, and what you can win with what you have.
That is exactly TAM, SAM, SOM. Read this post today or in five years, and the definitions still hold; only your numbers should change.
That is what evergreen means in strategy: the discipline survives, the data refreshes.
How to estimate each layer without fooling yourself
There are two classic routes:
- Top-down starts from industry reports and applies percentages. It is fast, and it is dangerous, because the percentages hide assumptions you did not make.
- Bottom-up starts from countable units: how many companies fit your ideal customer profile, how many of them have the trigger that creates demand, and what a realistic annual contract looks like.
I always build bottom-up first and use top-down only as a sanity check. If the two disagree by an order of magnitude, one of them is lying, and it is usually the comfortable one.
For the TAM, multiply the count of potential buyers by a defensible average annual value.
In enterprise technology, I prefer to express that value as a contract, not as a license seat, because contracts are what pay salaries. Keep the assumptions visible and write them next to the number: how many institutions, what average deal, which source for each. A TAM without visible assumptions is decoration.
For the SAM, apply honest filters
Geography where you can legally and practically deliver, regulation you can comply with, language and support you can provide, company sizes your product truly fits, and channel access you actually have. Each filter should cut the number, and if a filter cuts nothing, you are not filtering. In Latin America, these filters matter more than people outside the region expect: banking regulation, data sovereignty, and public procurement rules change the SAM from one country to the next, sometimes inside the same country.
For the SOM, switch from market logic to capacity logic.
- How many deals can your sales motion carry at the same time?
- What is your win rate in comparable deals?
- How long is the cycle?
A simple and honest SOM is parallel opportunities times win rate times average value, bounded by what delivery can absorb. If your SOM says you will win more projects than your teams can staff, it is a fantasy with extra steps. The SOM should feel a little uncomfortable: small enough to be credible, big enough to matter.
A worked example, close to my daily life
Imagine a company that offers a digital banking platform and wants to grow in Latin America. The numbers below are illustrative, but the shape is real.
TAM
The region has hundreds of banks, thousands of regulated financial entities, and a long tail of fintech. Multiplying plausible buyers by a plausible annual platform fee produces a nine-figure number. Impressive, and useless for decisions.
SAM
The company operates in Spanish-speaking markets, holds compliance evidence for banking regulation in a handful of countries, and its product fits mid-size institutions better than global giants. After the filters, the SAM shrinks to a few countries, a few hundred institutions, a two-digit million figure. Now the conversation is real.
SOM
The commercial team can run a dozen serious opportunities a year, the win rate in competitive processes is around one in three, and delivery can onboard only a limited number of new platforms at once. The SOM becomes the value of the wins your capacity allows, not the value of the market you admire. That number sets the quota, the plan and the conversation with the board.
EVG
Inside that SOM, the team names five institutions where a mandate, a deadline, or a regulator is pushing digital transformation now, where an internal sponsor already speaks about the problem in public, and where budget exists. Those five names, not the three circles, are where the year’s revenue comes from.
The layer most teams skip: early evangelists
The term comes from lean startup thinking, and it survives because it names something every seller knows intuitively. An early evangelist is a customer with a burning problem, who knows they have it, has tried to fix it before, and has the budget and the internal will to move now.
In enterprise sales, we usually call them the sponsor with pain and budget, but the evangelist idea adds one more ingredient: solving this problem makes them look good, so they champion you internally. You find them where pressure shows up: regulatory changes, failed internal projects, public commitments made by executives, and referrals from people who already trust you.
In RFx work, early evangelists are gold.
A tender where the client truly feels the pain produces better questions, better evaluation criteria, and a fairer fight, because the client rewards substance. A tender where nobody inside really cares produces price wars. When I evaluate whether to invest weeks in a proposal, I look for evangelist signals: a client team that asks intelligent questions, that shares context beyond the formal documents, that has a deadline tied to a real business consequence. If I find them, I invest. If I do not, I protect my team and walk away.
The mistakes I keep seeing, year after year
- The first mistake is the vanity TAM. A slide that opens with billions makes the founder feel big, and the buyer feel nothing. Boards and investors have seen the trick; the huge number reads as naivety, not ambition.
- Second is a SAM without filters. Claiming as SAM every company in an industry, when your product only fits one segment, one size, and one regulatory regime, inflates the middle circle until it equals the outer one. When SAM equals TAM, somebody skipped work.
- Third is a SOM without capacity. The market may be willing, but if your delivery bench, your legal team, or your cash flow cannot absorb the wins, the SOM is not obtainable by definition. I have watched companies win deals that later hurt them, because the real bottleneck was never demand.
- The fourth mistake is treating the circles as static. Markets move: regulation changes, competitors enter, budgets freeze. The framework is evergreen; your numbers are not. The discipline is to revisit them on a rhythm: quarterly for SOM, at least annually for SAM and TAM, and every time a big external event shakes your region.
- Fifth, the one that hurts most, is never naming the evangelists. A market size without named customers is a hypothesis. A market size with five named evangelists is a plan.
Using the circles inside RFx and account strategy
In complex deals, TAM SAM SOM is not only a marketing exercise; it is a prioritization tool.
- TAM tells me which industries deserve a long-term play in the region.
- SAM tells me where to build compliance evidence, partnerships, and references, because that is where I can compete.
- SOM tells my team where to place the quarter’s energy. And
- The evangelist layer tells me which specific accounts get executive time, proof-of-concept budget, and my own calendar.
The same logic works in the opposite direction when a client runs an RFP.
Understanding how the client sized their own market helps me shape a proposal that speaks to their real SOM, the customers they can actually obtain, instead of repeating generic value propositions.
Proposals win when they mirror the client’s constraints- regulatory, legal, operational- and that mirroring starts with understanding their circles, not only yours.
A simple habit that keeps this evergreen
Write your assumptions down in one page, with dates and sources: number of buyers, average value, filters, capacity, win rate, and the named evangelists.
Review that page every quarter and change what changed.
After a few cycles, you will have something more valuable than a market study: a living map of your commercial reality, and the humility to update it. That habit, more than any single number, separates teams that forecast well from teams that hope well.
Closing thought
The diagram at the top of this post looks like a beginner’s tool, and that is exactly why it works. It forces the three questions every commercial leader must answer honestly:
- How big is the dream,
- How much of it is real for us, and
- How much can we win with what we have? Then it adds the question that turns analysis into revenue:
- Who, specifically, will buy first and fight for us inside their organization?
Answer those four questions with visible assumptions and named customers, and you will make better decisions than most of your competition, this year and in every year to come.