The GE-McKinsey nine-box matrix: how to decide where to invest, hold, and exit
Every leader eventually faces the same quiet question. Not “is this opportunity good?” but “good compared to what, and at whose expense?” I have sat in pipeline reviews where three attractive deals competed for one delivery team, and in product councils where five roadmaps competed for two budgets.
The hard part is never evaluating a single bet. The hard part is evaluating all bets against each other. That is exactly the job the GE-McKinsey nine-box matrix was built to do.
Born inside General Electric with McKinsey & Company decades ago, the matrix survives every management fashion because it answers a permanent question:
Where should limited capital, talent, and attention go?
In this post, I will walk through what the matrix is, how to read its nine boxes, the five benefits it delivers, and how I apply it to technology portfolios and deal pipelines across Latin America.
If you manage products, services, markets, or accounts, this is one tool you will keep using for the rest of your career.
What the matrix is, in one screen
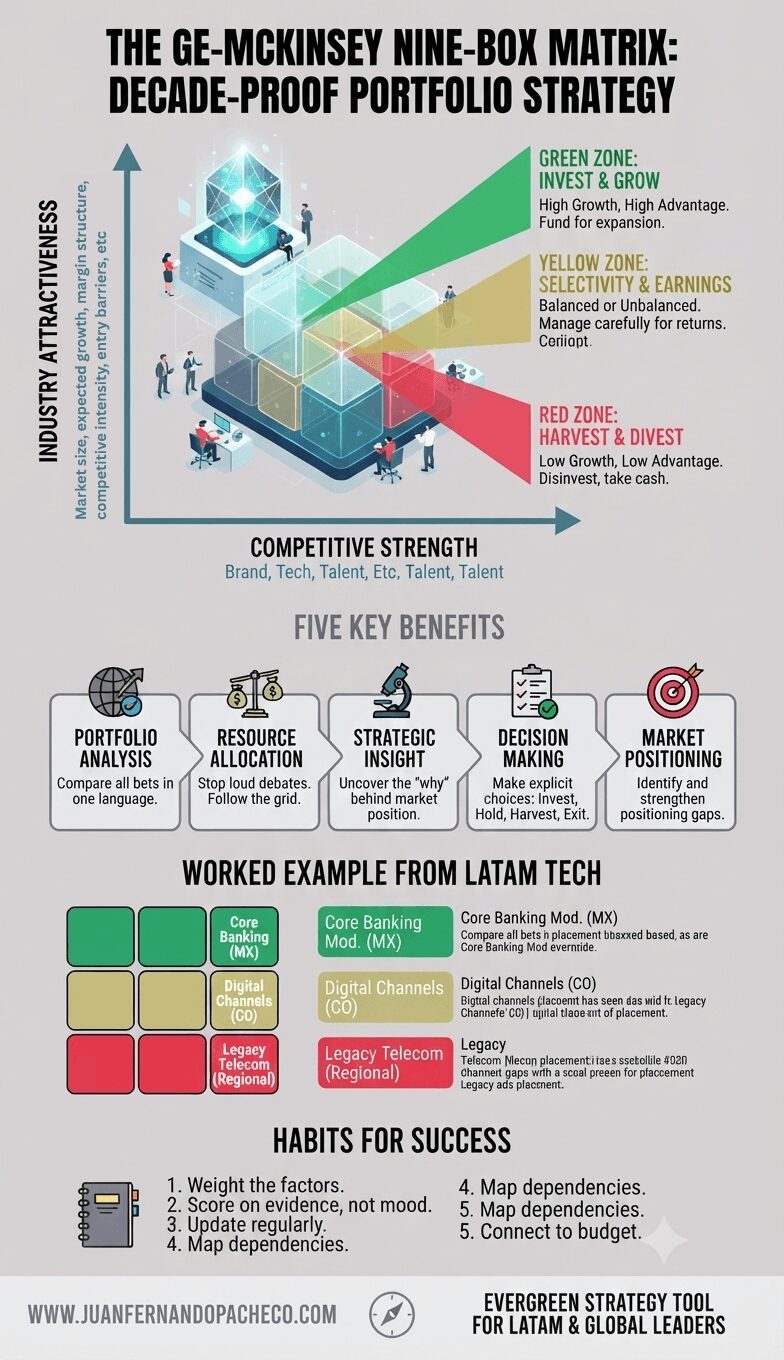
The GE-McKinsey nine-box matrix plots every business unit, product, service line, or market on two axes.
- The vertical axis measures industry attractiveness: how much profit and growth the market itself offers, regardless of who plays in it.
- The horizontal axis measures competitive strength: how well positioned your unit is to win in that market.
Each axis is divided into high, medium, and low, which creates nine cells.
Those nine cells collapse into three strategy zones.
- The green zone, invest/grow, sits where attractiveness and strength are both healthy: you fund these units to expand.
- The yellow zone, selectivity/earnings, sits on the diagonal middle: you proceed carefully, earn returns, and invest only where a clear path exists.
- The red zone, harvest/divest, sits where the story is weak on both dimensions: you minimize new investment, take the cash the unit still generates, and plan a disciplined exit.
Compare this with the older BCG growth-share matrix, which uses only market growth and relative share. The GE-McKinsey version replaces those two narrow numbers with composite judgments built from many factors, which is why it still holds up in complex, regulated, or slow-growth industries where share alone tells you very little.
The two axes, unpacked
Industry attractiveness is not just growth.
A complete reading blends market size, expected growth, margin structure, competitive intensity, entry barriers, supplier and buyer power, regulatory burden, and exposure to macroeconomic shocks. A large, slow market with loyal customers and high switching costs can be more attractive than a fast market where five rivals burn cash to buy share.
Competitive strength is not just market share either.
It blends brand and reputation, cost position, proprietary technology, talent depth, customer loyalty, channel access, and the quality of your delivery. In services businesses, strength often lives in people and references: a small team with trusted references in core banking can be stronger than a large team with no proof points.
Two habits make the axes honest.
- First, weight the factors. Growth may matter twice as much as size in one industry, and half as much in another. Agree the weights before scoring anything.
- Second, score on evidence, not mood. Use a simple one-to-five scale and require a fact for every score: a number, a contract, a win rate, a margin.
When a score has no evidence behind it, mark it as an assumption and test it later. The matrix should feel like a summary of what you know, not a mirror of what you hope.
How to read the nine boxes
The grid reads naturally once you remember that both axes matter at the same time.
- Units with high or medium competitive strength in highly attractive industries fall in the green invest/grow cells. These are your engines. Fund them, staff them first, and tolerate short-term cost for long-term position.
- Units in the yellow selectivity/earnings cells need a more surgical conversation. A unit in a very attractive market but with low strength is a question mark with a price tag: invest only if you can name the specific capabilities that will move you to strength, and set a deadline to prove it. A unit with high strength in an unattractive market is a cash machine in decline: earn from it, resist reinvesting everything it produces, and let it fund your green zones. The center cell, medium on both axes, is where discipline matters most: selective investment aimed at pushing the unit toward green, with earnings funding the journey.
- Units in the red harvest/divest cells deserve clarity, not neglect. Harvesting means pricing for cash, automating what you can, and avoiding new bets. Divesting means finding a buyer, a partner, or an orderly wind-down. The kindest thing a leader can do for a red unit is decide, because undecided red units consume management time far beyond their economic value.
The five benefits that make it worth the effort
Portfolio analysis.
The matrix gives you one frame to look at everything you run side by side, in the same language. Units that never get compared suddenly sit on the same page, and hidden imbalances become visible: most portfolios discover they are overinvested in yellow and underinvested in green.
Resource allocation.
Budgets and hiring plans stop being negotiations between the loudest voices and start following the grid. Green units get growth capital, yellow units get conditional capital, red units get harvest targets.
Strategic insight.
Because the axes are built from many factors, the matrix surfaces why a market is attractive or why a unit is strong. That “why” is where strategy lives, and it is what a single financial metric can never show.
Decision making.
The matrix turns vague debates into explicit choices: invest, hold selectively, harvest, or exit. Even when leaders disagree with a placement, arguing about a box is far more productive than arguing about vibes.
Market positioning.
Plotted honestly, the grid shows which units need positioning work: perhaps the product is fine, but the story is weak, or perhaps strength rests on a single customer and is more fragile than it feels. That insight feeds directly into marketing, sales, and proposal strategy.
Building your first matrix in five steps
Step one
Define the units. Compare things that genuinely compete for the same resources: product lines, service offerings, country markets, customer segments, or deal types. Keep the set small enough to discuss deeply, usually between five and ten units.
Step two
Agree the factors and weights for each axis, with voices from sales, delivery, finance, and product in the room. Write them down. These weights are your strategy expressed as numbers.
Step three
Score each unit on each factor from one to five, with one owner per score and one piece of evidence attached. Multiply by weights and total each axis.
Step four
Plot the units and challenge the picture in a second session. Ask what would change each score by one point. Units that sit on a border between boxes get a decision rule in advance, so the map does not become a debate club.
Step five
Convert boxes into actions and money. A matrix without budget consequences is decoration. Green gets investment cases, yellow gets conditions and checkpoints, red gets harvest plans and exit criteria. Then put a review date in the calendar, quarterly for fast markets, twice a year for stable ones.
A worked example from Latin American technology services
Imagine a regional IT services firm deciding where to place its bets across segments. Core banking modernization in Mexico scores high on attractiveness, large budgets, regulatory tailwinds, long contracts, and the firm scores high on strength, deep references and a proven delivery factory. That lands in green: invest and grow, hire ahead, build accelerators.
Digital channels for retail banking in Colombia may show high attractiveness but medium strength: real demand, yet the firm is still proving itself against local players. That is a yellow conversation: selective investment, perhaps a partnership to close the gap, with a checkpoint in two or three quarters.
Meanwhile, legacy maintenance for a saturated telecom segment may show low attractiveness, price wars, shrinking scope, even with medium strength from old contracts. That is red logic: harvest, automate, avoid new fixed investment, and let the margin fund the banking practice.
Nothing about this example depends on a particular year. The names of the segments may change; the discipline does not. That is the test of an evergreen tool: the inputs age, the method does not.
Using the matrix to choose which deals to chase
The same logic works one level down, at the deal pipeline.
Before committing a bid team to a complex RFP, ask which box the underlying segment occupies. Green segments deserve your best people, sharpest pricing creativity, and executive sponsorship. Yellow segments deserve selective bids: pursue only when the client fits your strengths, the risks are capped, and the margin floor holds. Red segments deserve a polite no, or a minimal-effort bid at a price that would surprise you upward, because winning a bad deal is just losing money more slowly.
This is where portfolio thinking protects delivery.
Every bid consumes architects, lawyers, and sellers who could be serving clients or building green offers. Saying no to red deals is not pessimism; it is how teams keep a record of on-time delivery and how margins survive contact with procurement.
The mistakes that quietly kill the matrix
- The most common failure is the consensus squeeze to avoid conflict; everyone scores medium, and the portfolio lands in the yellow fog. Force dispersion by requiring evidence and by comparing units against each other, not against memory.
- The second failure is treating the matrix as a one-off workshop artifact, printed once and forgotten. The grid is a living instrument; scores decay as markets move.
- The third is ignoring interdependencies. A red unit may host the platform a green unit depends on, or a low-attractiveness market may hold the reference logo that unlocks a green one. Map dependencies before you cut.
- The fourth is scoring hopes instead of facts, especially strength. Leaders fall in love with their units; evidence is the antidote.
- The fifth is running the exercise without connecting it to budget and hiring. If the output does not change where money and people go, it was theater.
Habits that keep it useful for years
Keep the factor list stable so scores remain comparable over time, and change weights only when your strategy genuinely changes. Document the evidence behind each score so a future reader can audit the picture.
Review on a fixed cadence, and re-score only one axis at a time if time is short; a half-updated matrix beats an abandoned one.
Finally, pair the grid with simple financials: revenue, margin, and cash per unit. The matrix tells you direction; the financials tell you speed and fuel.
Conclusion: the conversation is the tool
People often ask whether the GE-McKinsey nine-box matrix still matters in a world of agile planning and constant uncertainty. In my experience, the faster the world moves, the more you need a calm frame to decide what not to do.
The matrix will never decide for you, and that is its honesty. What it guarantees is that every unit, market, and deal stands in the same light, scored by the same rules, argued in the same language.
Put your portfolio on the grid this quarter.
Bring the evidence, invite the dissent, and let the green, yellow, and red do what they have done for generations of operators: make the hard choices visible, because visible choices are half made.