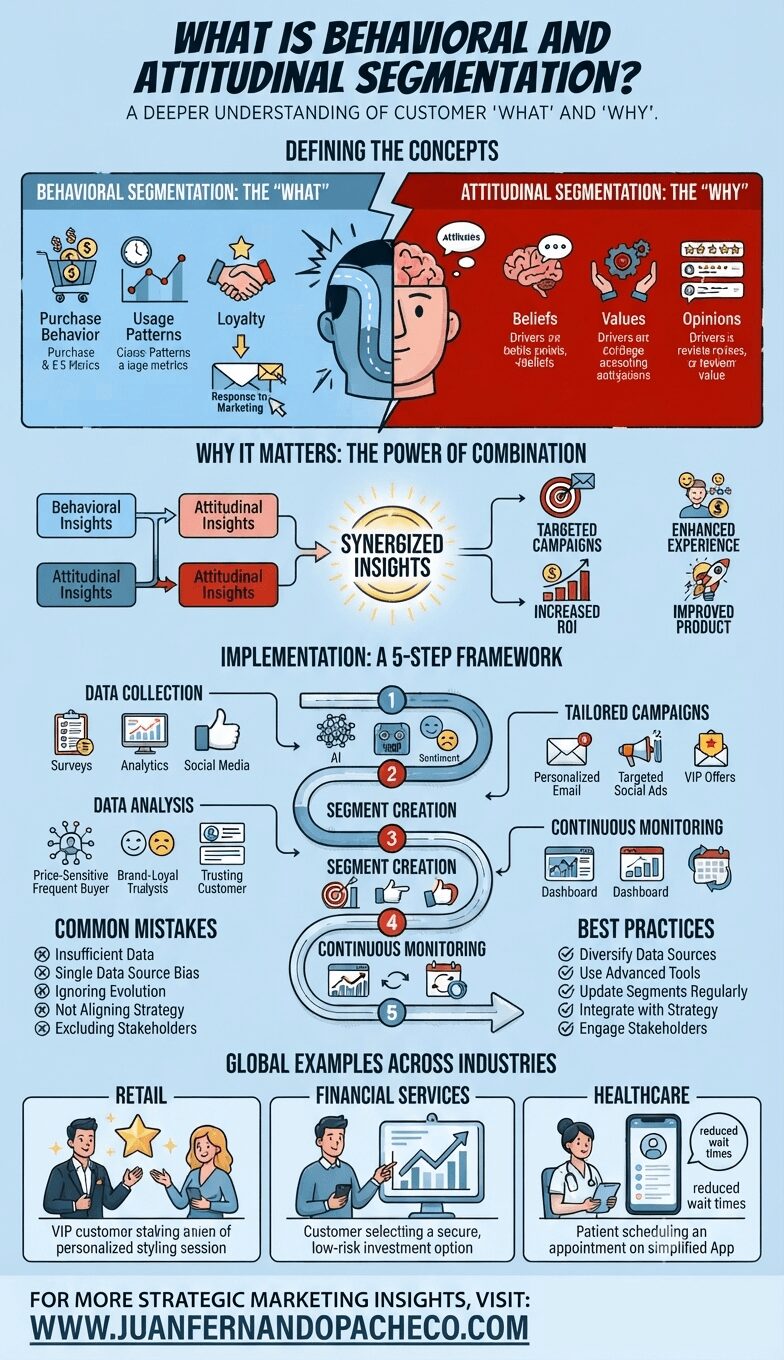
An infographic titled 'What is Behavioral and Attitudinal Segmentation?' illustrating a comprehensive marketing framework. It defines behavioral segmentation (the 'What') and attitudinal segmentation (the 'Why'), shows their combined power for 'Synergized Insights,' outlines a five-step implementation framework, details common mistakes and best practices, and provides global industry examples for retail, financial services, and healthcare. The infographic concludes with a call-to-action for WWW.JUANFERNANDOPACHECO.COM.

Behavioral and attitudinal segmentation is a powerful strategy for marketers aiming to connect with their audience on a deeper level. By understanding both what customers do and why they do it, businesses can craft personalized experiences that drive engagement and loyalty. By avoiding common pitfalls and following best practices, organizations can maximize the effectiveness of their segmentation efforts, ultimately leading to stronger customer relationships and improved ROI.

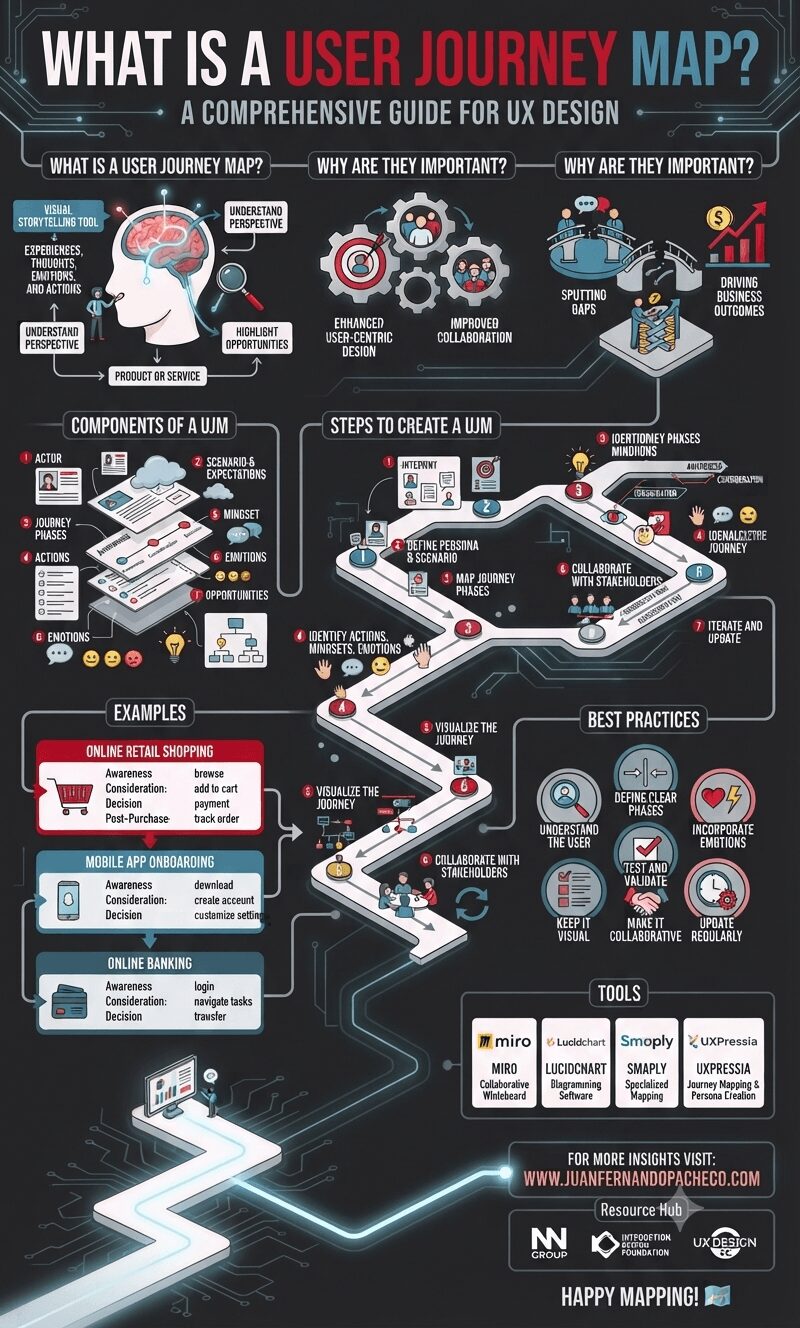
A detailed infographic titled "What is a User Journey Map?" set against a dark background with a glowing, circuit-like path. The infographic is structured in vertical sections, starting with the definition and importance of User Journey Maps. It then details the core components (Actor, Scenario, Phases, Actions, Mindset, Emotions, Opportunities, Visualization) and outlines a 7-step creation process. Following this, it provides three distinct examples (Online Retail Shopping, Mobile App Onboarding, Online Banking) and lists best practices and popular tools (Miro, Lucidchart, Smaply, UXPressia). The bottom section includes the URL "WWW.JUANFERNANDOPACHECO.COM" and resource logos.

A User Journey Map is an indispensable tool in UX design, enabling teams to create user-centric products and services. By capturing the user’s actions, emotions, and pain points, it provides valuable insights that drive innovation and improve overall user satisfaction.

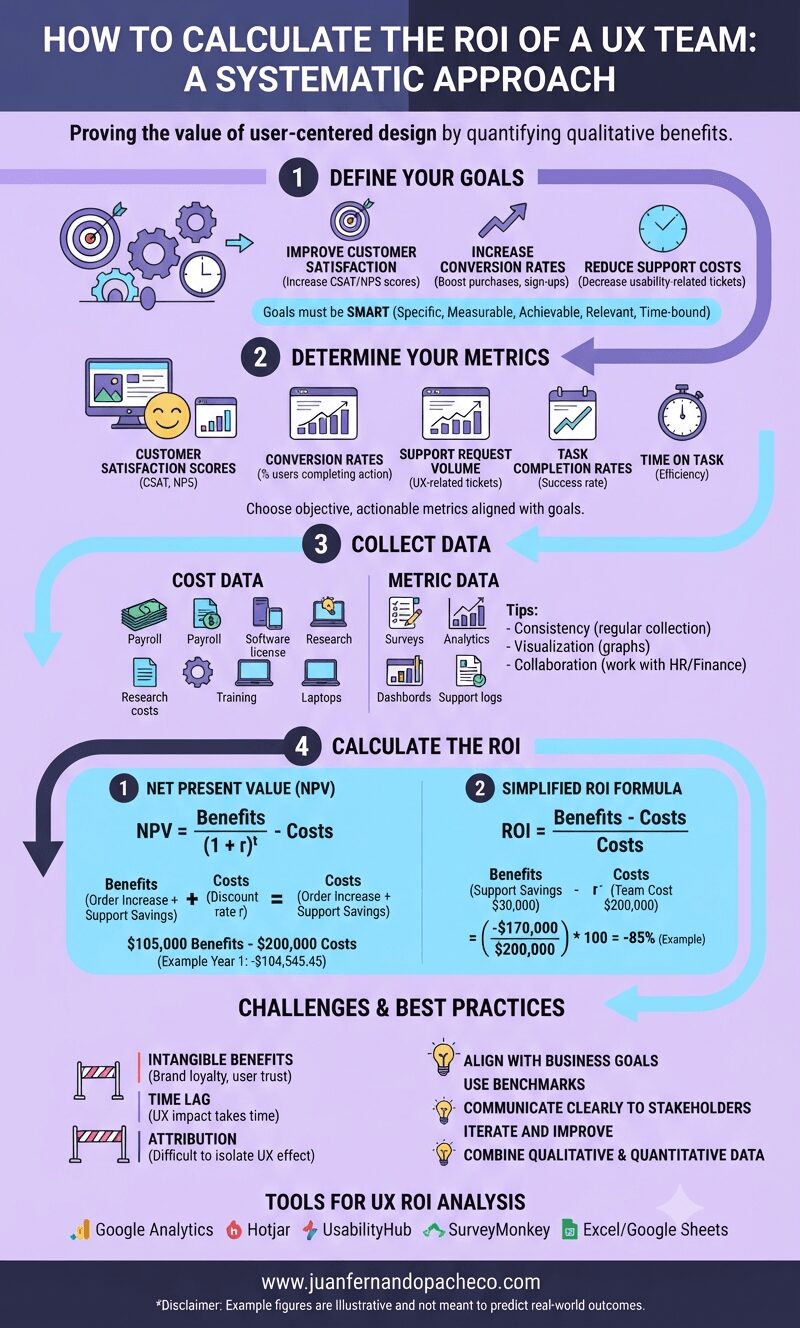
An infographic titled "How to Calculate the ROI of a UX Team: A Systematic Approach" against a light purple background. It outlines a four-step process: 1. Define Your Goals (SMART goals), 2. Determine Your Metrics (NPS, Conversion Rates, etc.), 3. Collect Data (Cost Data and Metric Data), and 4. Calculate the ROI (using NPV and simplified ROI formulas with examples). The graphic also includes sections for Challenges, Best Practices, and Tools, ending with the URL www.juanfernandopacheco.com.

Understanding the return on investment (ROI) of a UX team is critical for organizations aiming to justify and optimize their investment in user-centered design practices.
While calculating ROI in a UX context can be challenging because quantifying qualitative benefits is difficult, a systematic approach can reveal the value a UX team provides to an organization.

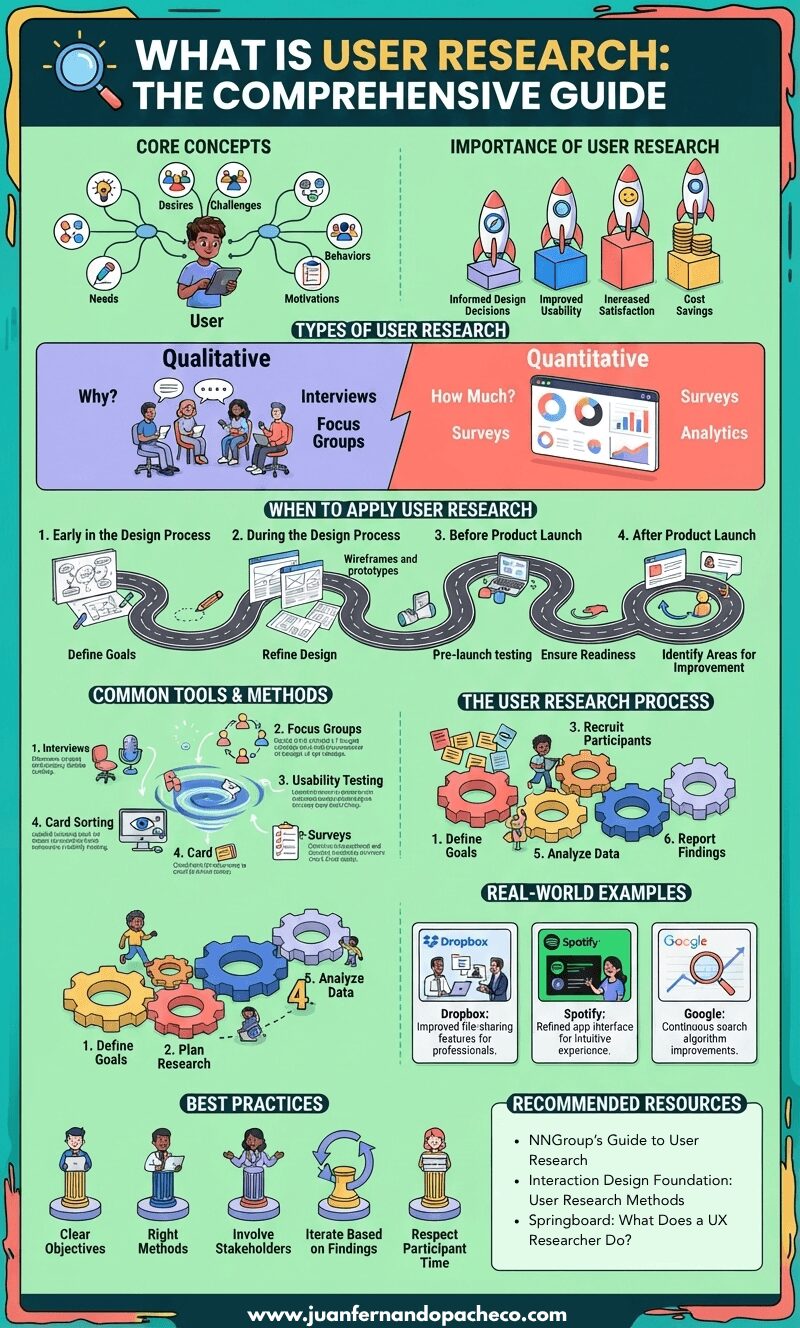
Infographic titled "What is User Research: The Comprehensive Guide" featuring sections on core concepts, importance, qualitative and quantitative types, a timeline of when to apply research, common tools, the research process, real-world examples, best practices, and recommended resources, all grounded in a user-centered design approach.

User research is the process of analyzing, studying, and understanding the needs, desires, challenges, behaviors, and motivations of the people who use a product or service.

It’s typically conducted to inform the design of new products or features or to improve an existing product. By uncovering how real users interact with a product, user research ensures that your designs are grounded in reality rather than assumptions.