The Feature Overload Problem
You’re staring at 18 proposed features for your product. Deadlines loom, resources are tight, and stakeholders demand a “game-changer.” Yet, your gut says none of these features will move the needle. Sound familiar? This is where the Kano Model—a decades-old framework rooted in customer psychology—saves the day.
Developed in the 1980s by Japanese researcher Noriaki Kano, this model categorizes features based on how they influence user satisfaction. By applying it, teams can cut through noise, prioritize strategically, and invest in innovations that foster loyalty. Let’s break down how it works.
The Kano Model Explained
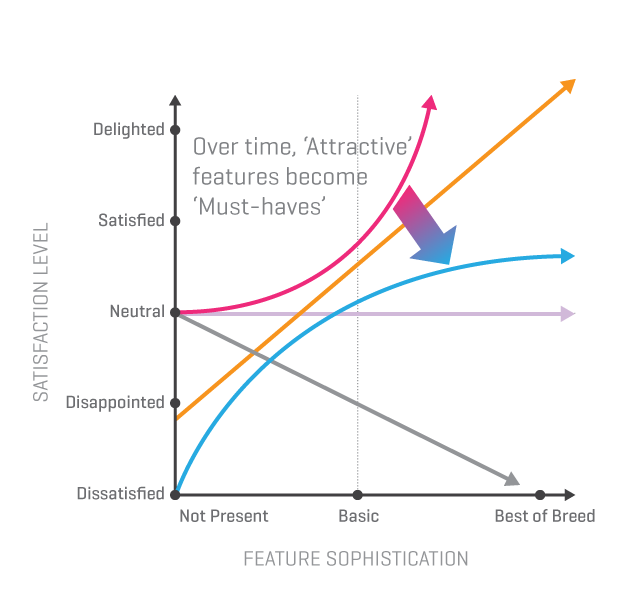
Kano’s core insight: Not all features impact satisfaction equally. He identified five emotional responses to features, mapped on a graph where the y-axis represents emotional intensity (from dissatisfaction to delight) and the x-axis tracks feature sophistication (from “not present” to “best-in-class”):
1. Attractive Features
- Unexpected delights (e.g., Apple’s MagSafe chargers).
- Users won’t miss them if absent, but their presence creates buzz.
- Over time, these evolve into “Must-Haves” (think smartphone touchscreens).
2. One-Dimensional Features
- Satisfaction scales with quality (e.g., speed, ease of use).
- Absence causes dissatisfaction (e.g., slow load times).
3. Must-Have Features
- Basic expectations (e.g., brakes in a car).
- No loyalty earned here—just baseline compliance.
4. Unimportant Features
- Users don’t care if they’re included or not.
5. Undesired Features
- Harm satisfaction (e.g., cluttered UI elements).
Why Kano Matters in 2024
The Evolution of Features
Kano’s most critical insight: Delight decays into expectation. Yesterday’s innovations (e.g., GPS in cars) become today’s must-haves. This “feature creep” demands continuous research to stay ahead.
ROI of Generative Research
Attractive features often stem from observing unmet needs in real-world contexts. For example:
- Airbnb’s “Experiences” feature emerged from ethnographic studies of travelers seeking local immersion.
- Slack’s threaded conversations addressed collaboration pain points observed in teams.
As Nielsen Norman Group notes, generative research is the key to uncovering these opportunities.
Conducting a Kano Study: A Step-by-Step Guide
- Define Features & Hypotheses
List features and predict their Kano category (e.g., “We believe ‘dark mode’ is Attractive”). - Design Paired Questions
For each feature, ask:- How would you feel if this feature were present?
- How would you feel if it were absent?
Use a 5-point scale (Delighted → Dissatisfied).
- Recruit Strategically
Include 12–24 participants representing target personas. Tools like User Interviews streamline recruitment. - Analyze & Visualize
- Map responses to Kano categories using evaluation tables.
- Highlight differences across personas (e.g., “Power users vs. casual adopters”).
- Prioritize with Data
Focus on One-Dimensional and Attractive features. For example:- Dropbox prioritized file-syncing speed (One-Dimensional).
- Duolingo’s gamification (Attractive) drove viral growth.
Kano in Action: Case Studies
Case 1: Apple’s MagSafe
- Category: Attractive (initially).
- Impact: Reduced laptop damage, creating a loyal fanbase.
- Evolution: Now a Must-Have in MacBooks.
Case 2: Zoom’s Virtual Backgrounds
- Category: Attractive during the pandemic.
- Impact: Differentiated Zoom from competitors.
Avoiding Common Pitfalls
- Don’t Skip Personas: Segment users (e.g., “First Adopters” vs. “Late Majority”) to avoid misprioritizing features.
- Beware of False Positives: Use statistical tools (e.g., MeasuringU’s Kano Analysis) to validate significance.
- Balance Innovation and Basics: As Harvard Business Review warns, over-indexing on delight risks neglecting must-haves.
Kano + Net Promoter Score (NPS)
Kano directly ties to NPS by linking features to customer advocacy. For example:
- A hotel chain boosted NPS by 22% after adding free late checkouts (Attractive).
- A SaaS tool’s NPS dropped due to a poorly executed AI chatbot (Undesired).
Final Takeaway
The Kano Model isn’t just a prioritization tool—it’s a mindset. By relentlessly seeking features that surprise and solve, you’ll build products users love today and depend on tomorrow. Start small: Pick 3 features, run a micro-study, and let data—not hunches—guide your roadmap.
For further reading, explore Kano’s original paper or delve into case studies at Interaction Design Foundation.


