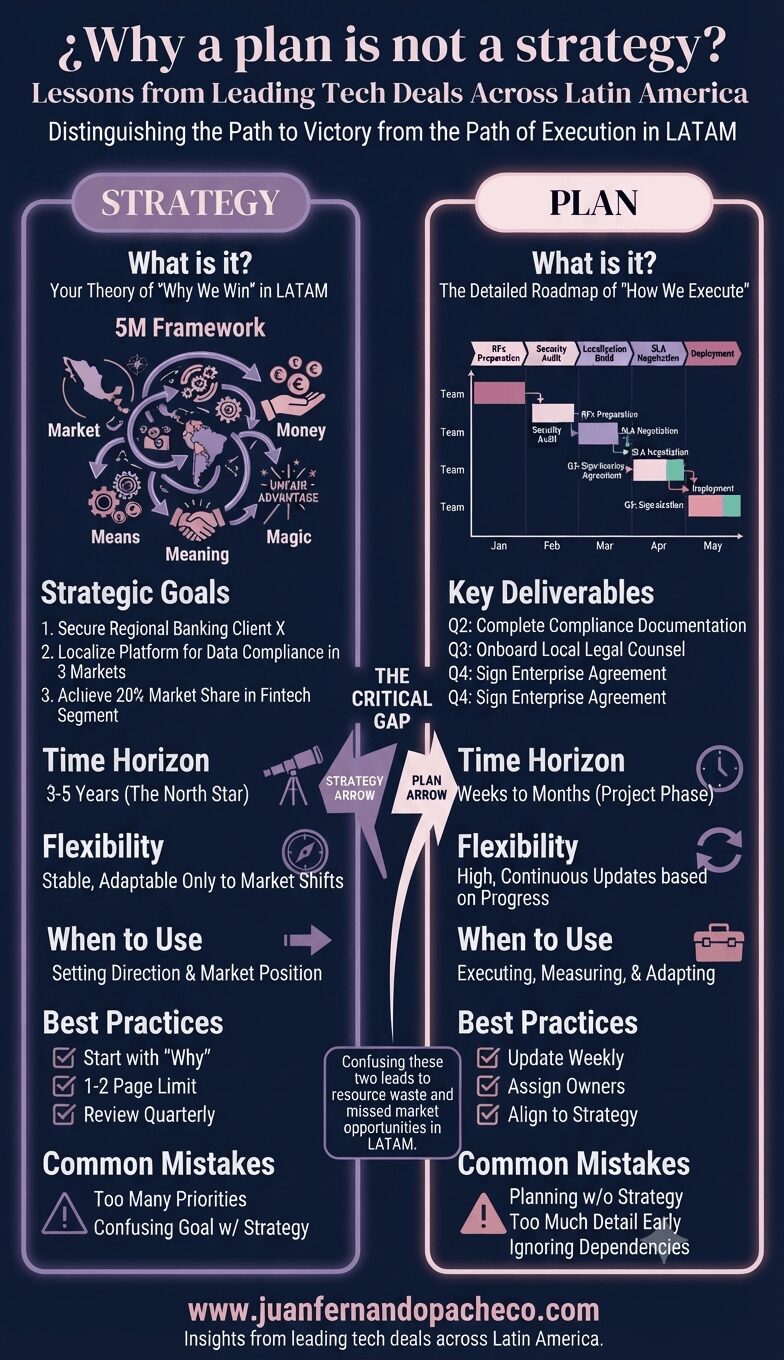
Many executives confuse detailed plans with winning strategies. Learn the critical distinction and how to build both to scale technology revenue across complex markets.
Tag: Design Thinking
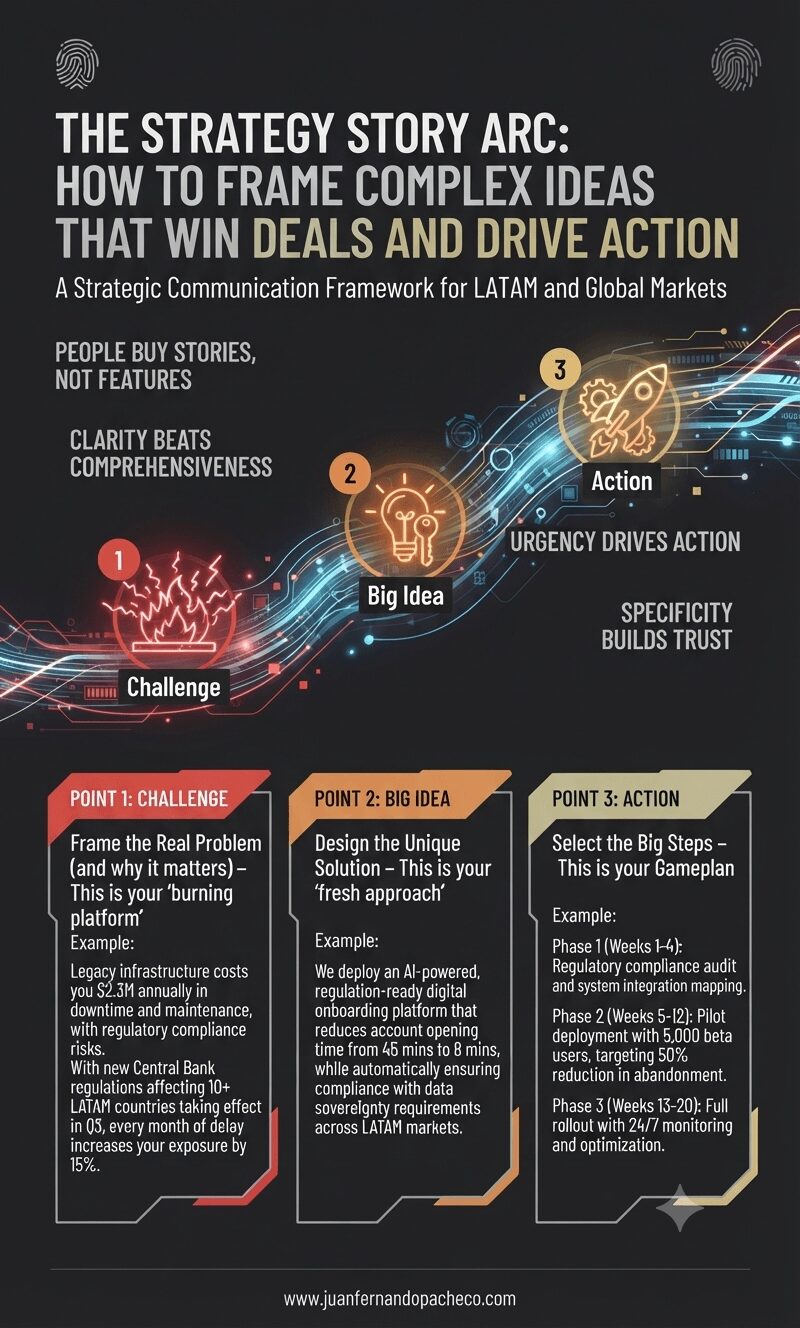
Master the three-part Strategy Story Arc framework to transform complex business challenges into compelling narratives that secure stakeholder buy-in, win multi-million dollar deals, and drive strategic execution across LATAM markets.
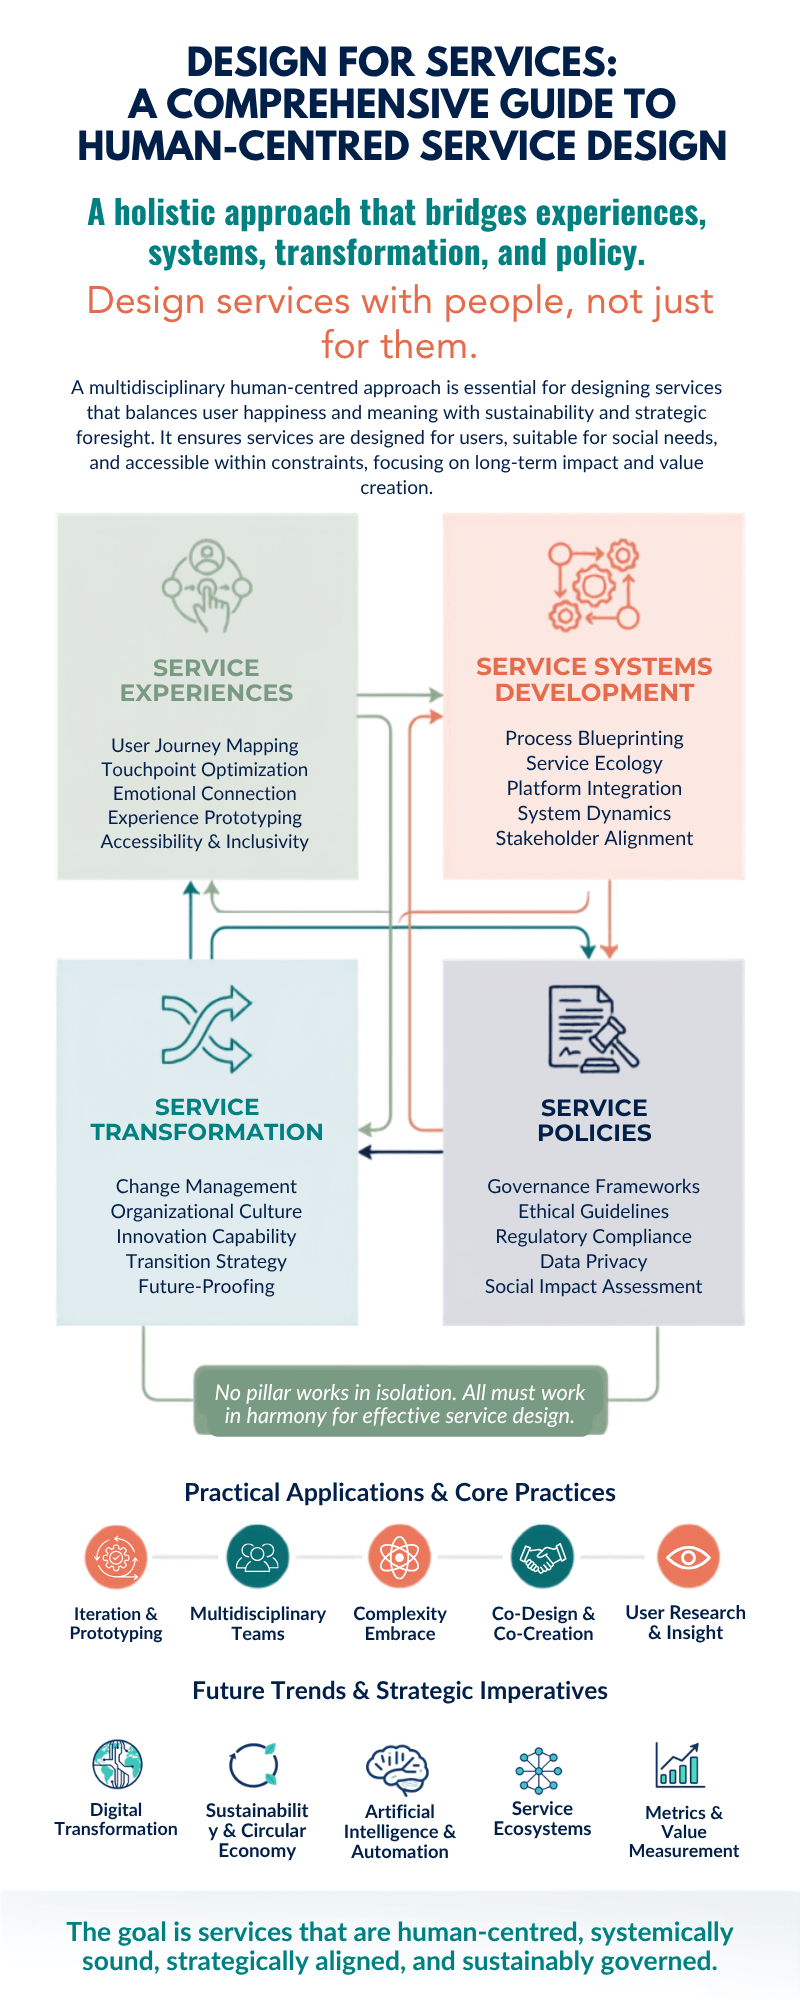
xplore the comprehensive framework of design for services through a human-centred lens. Learn how the four pillars of service design—experiences, systems development, transformation, and policies—integrate multiple disciplines to create meaningful, sustainable solutions that put people at the heart of innovation.
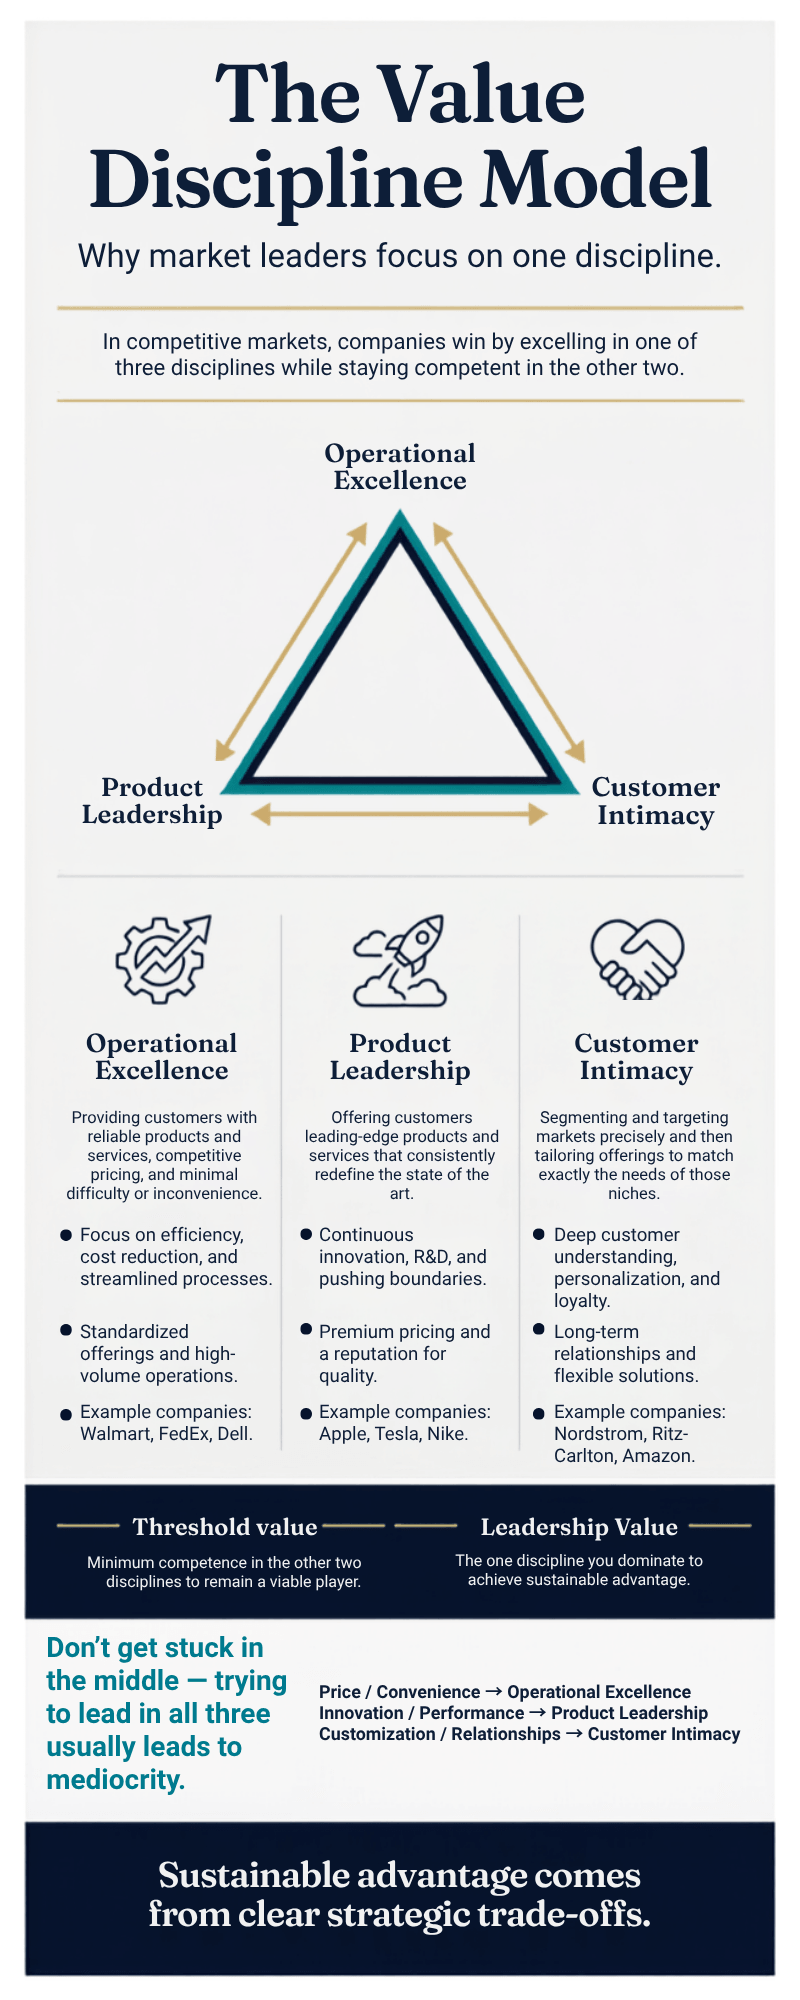
Discover how the Value Discipline Model helps organizations achieve market leadership by excelling in one of three strategic areas: Operational Excellence, Product Leadership, or Customer Intimacy. Learn which path fits your business and how to dominate your industry.
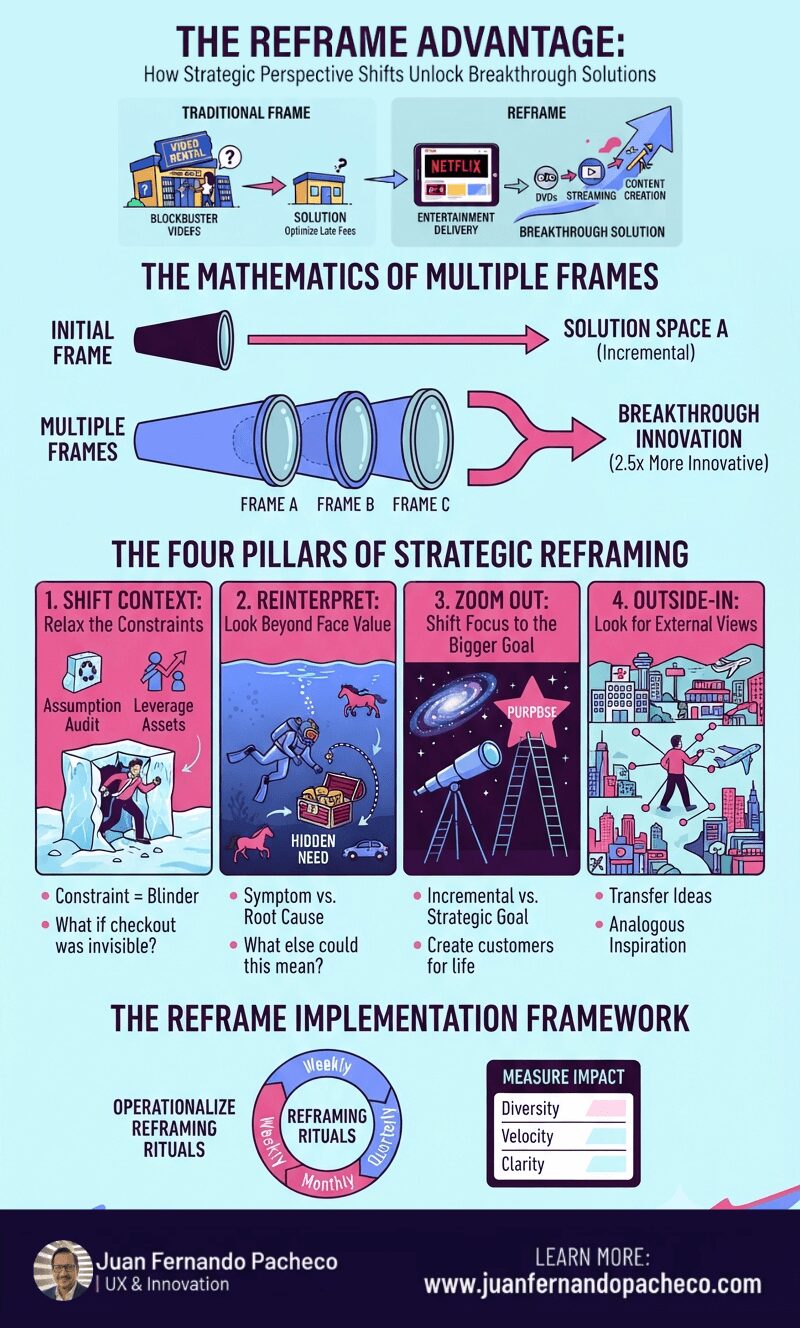
In a world where competitors can copy features, replicate processes, and hire away talent, your ability to see problems differently remains a sustainable competitive advantage. Reframing isn’t just a technique—it’s a strategic capability that compounds over time.
The teams and leaders who master reframing don’t just solve problems better; they solve better problems. They escape the trap of incremental optimization and unlock breakthrough innovation. They achieve more with less because they’re working on the right challenges from the start.
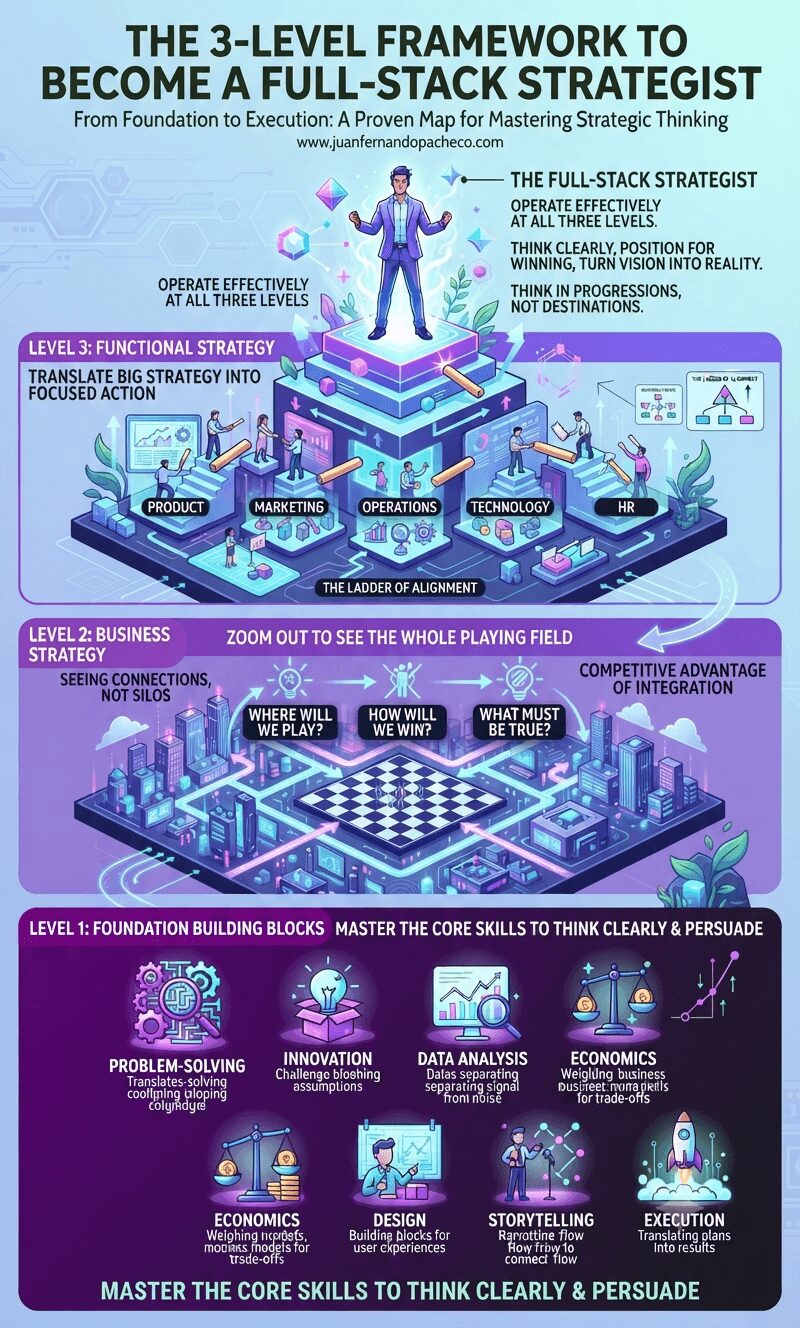
Strategy doesn’t have to be a mystery. Discover the proven 3-level framework that breaks down strategic thinking into foundation building blocks, business strategy, and functional strategy—transforming you into a full-stack strategist who can think clearly, position for winning, and translate vision into action.
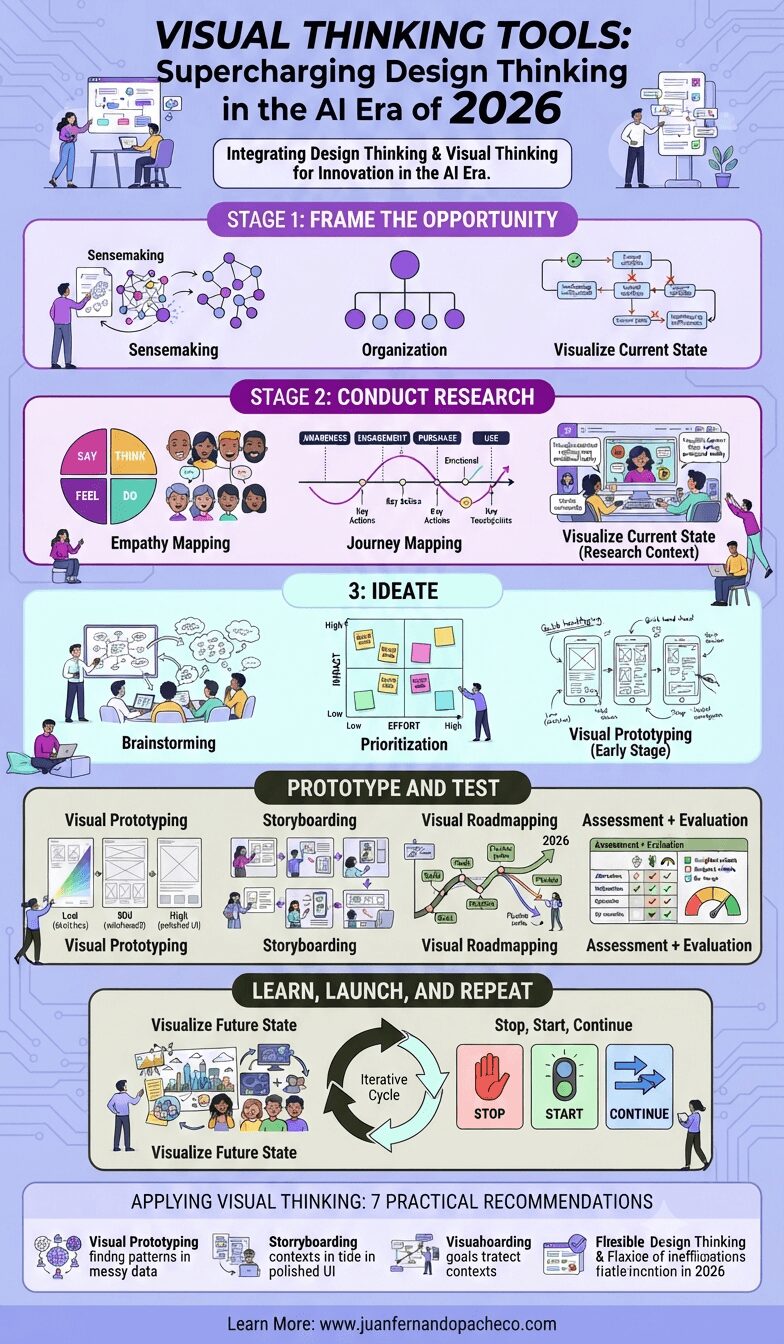
The design thinking methodology with visual thinking tools I’ve outlined here represents more than just a process—it’s a mindset shift toward collaborative, iterative, human-centered innovation. In 2026, where complexity is the norm and user expectations continue to rise, this approach isn’t optional; it’s essential.
Whether you’re a seasoned designer, a business leader driving digital transformation, or an entrepreneur launching your first product, these visual thinking tools can elevate your work. They’ll help you see problems more clearly, generate better solutions, and create experiences that truly resonate with users.
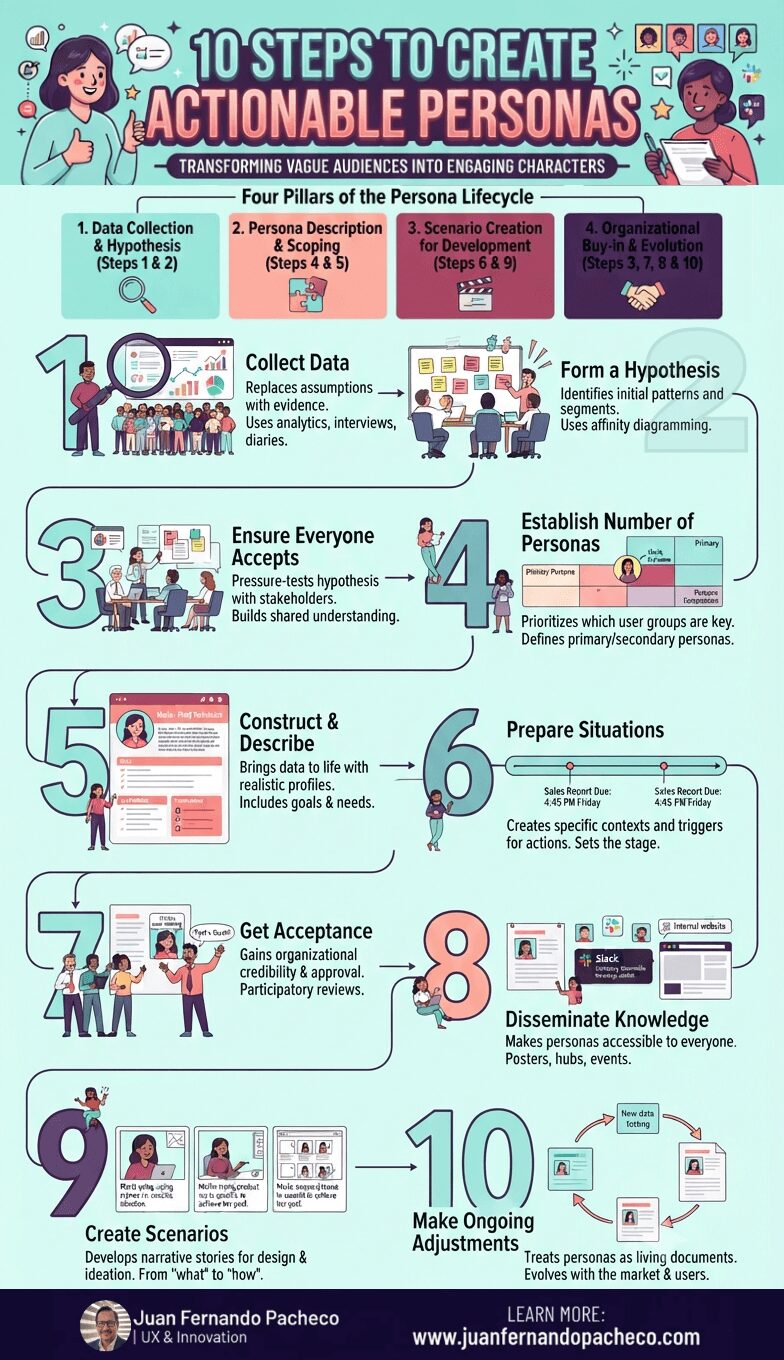
Creating engaging personas is not a one-week exercise to be filed away and forgotten. It is a strategic commitment to human-centered design. This 10-step process provides a robust framework, but its success hinges on a cultural shift within your organization—a shift from building for “the user” to designing for “Maria,” “John,” and “Akira.”
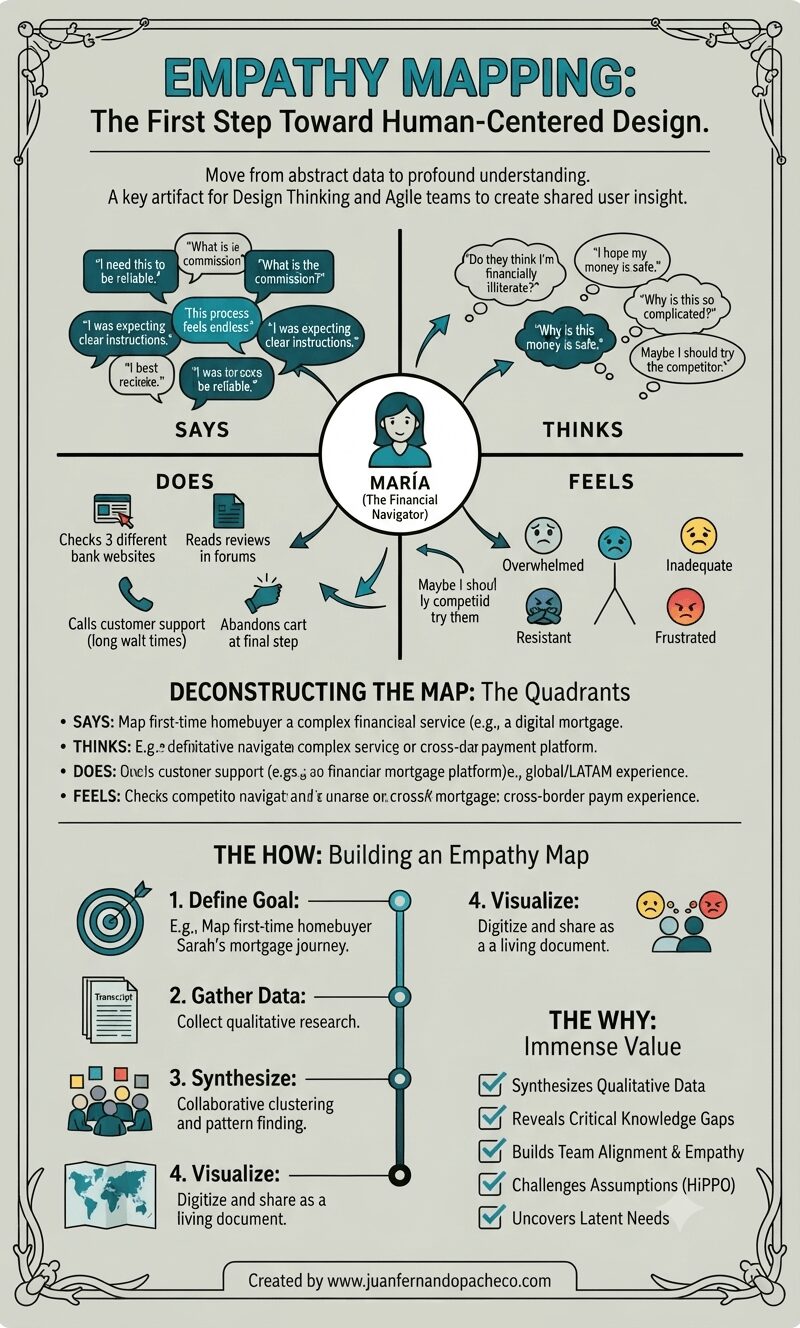
An empathy map is more than just a diagram on a wall. It is a practice, a mindset, and a commitment to seeing the world through someone else’s eyes. It transforms the abstract “user” into a human with hopes, frustrations, and a complex inner world.
By systematically capturing what our users Say, Think, Do, and Feel, we move beyond building mere features.
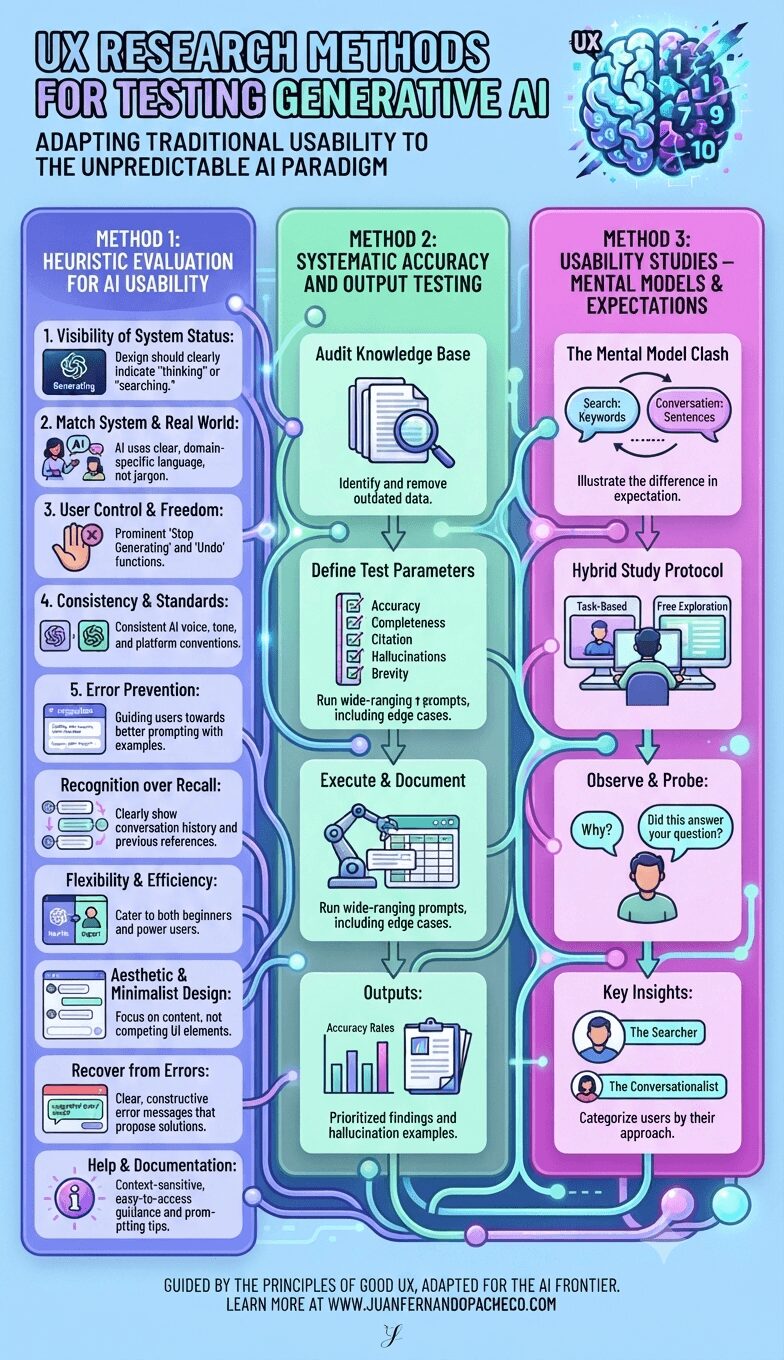
Testing generative AI requires us to expand our UX research toolkit. We can no longer rely solely on prototyping predictable flows. Instead, we must adopt a multi-pronged strategy that assesses not just the interface’s usability but also the quality of its output and its alignment with deeply ingrained user mental models.