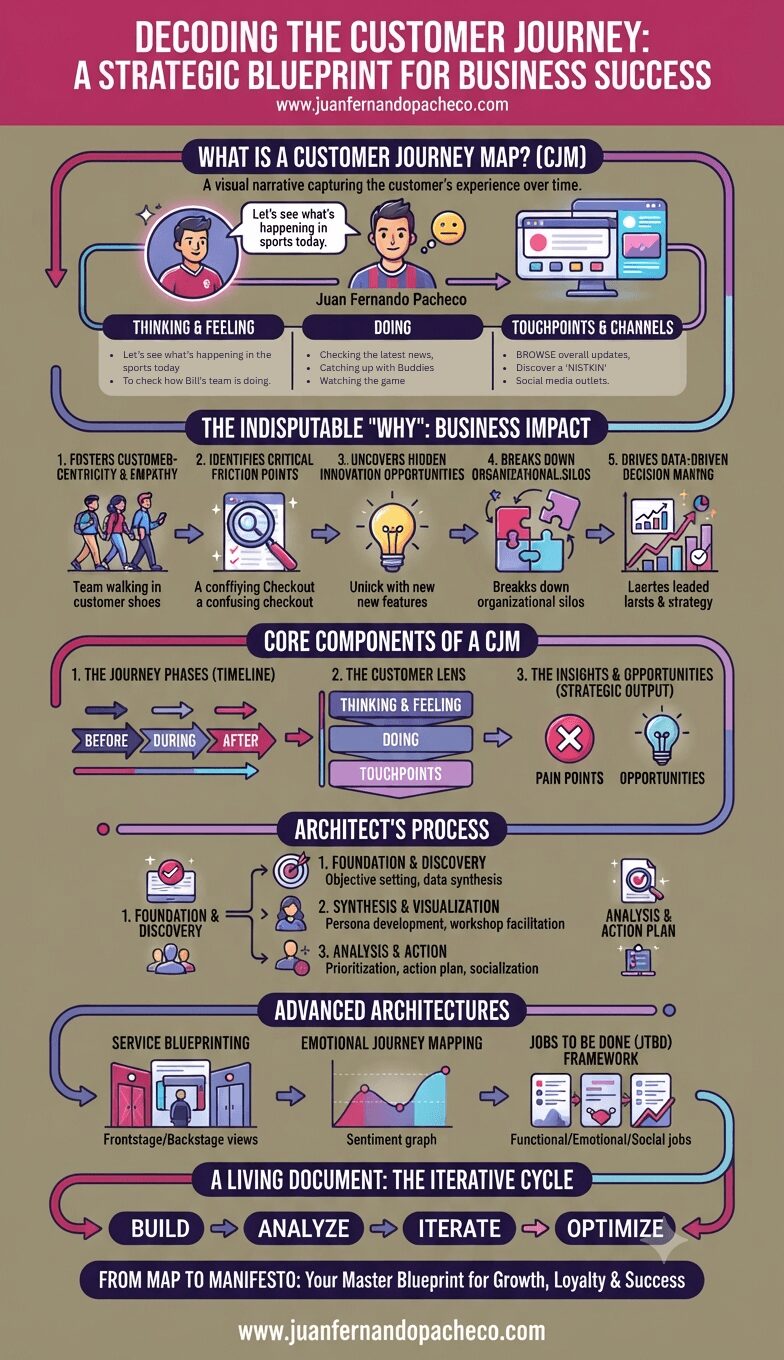
Decoding the customer journey is the first, most critical step in building a truly customer-centric organization. The map of Juan Fernando Pacheco is more than a diagram; it’s a manifesto. It declares that the company’s success is inextricably linked to his success in achieving his goals—be they finding community, proving his knowledge to his buddies, or simply enjoying the thrill of the game.
Tag: customer journey
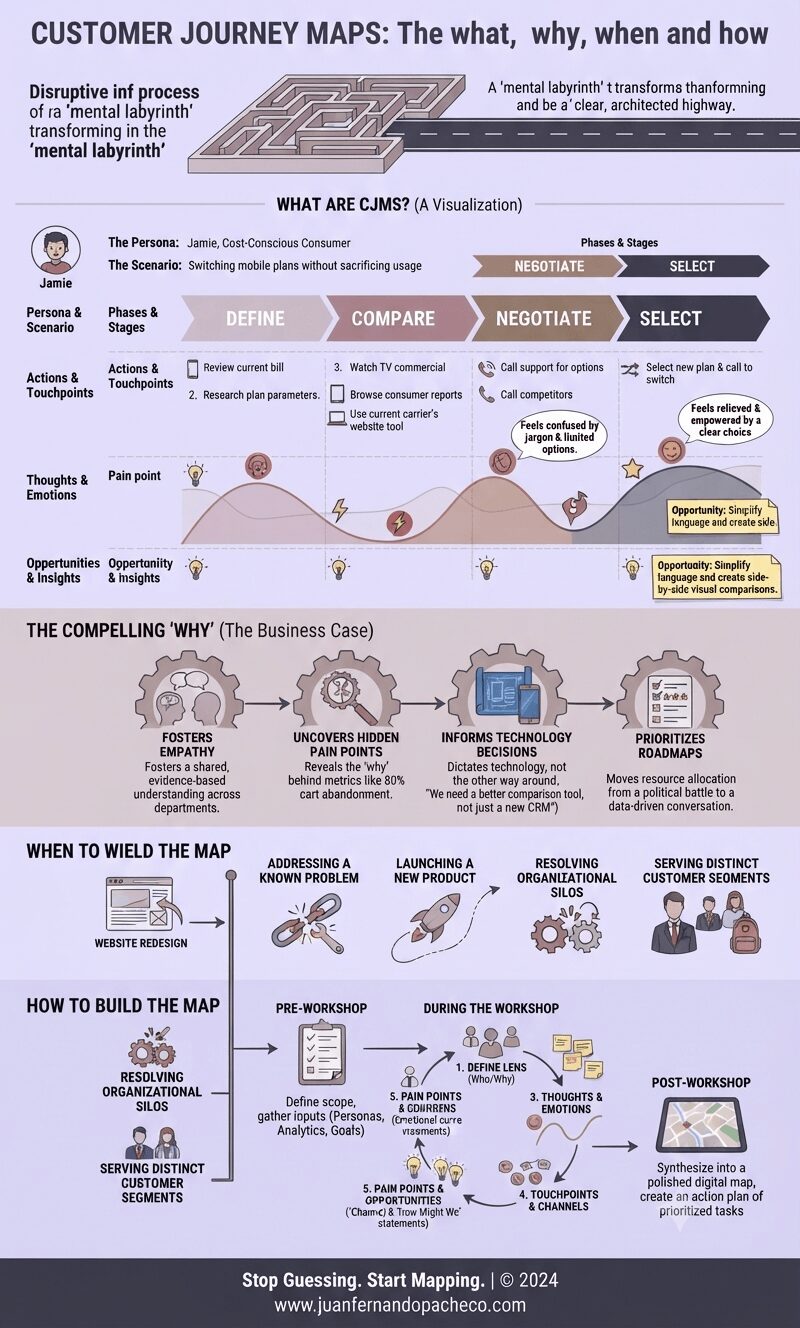
A Customer Journey Map is more than a diagram; it’s a strategic compass. It aligns your organization’s internal machinery with the external reality of your customer’s experience. It transforms abstract data into human stories, and those stories into a clear, actionable blueprint for improvement.
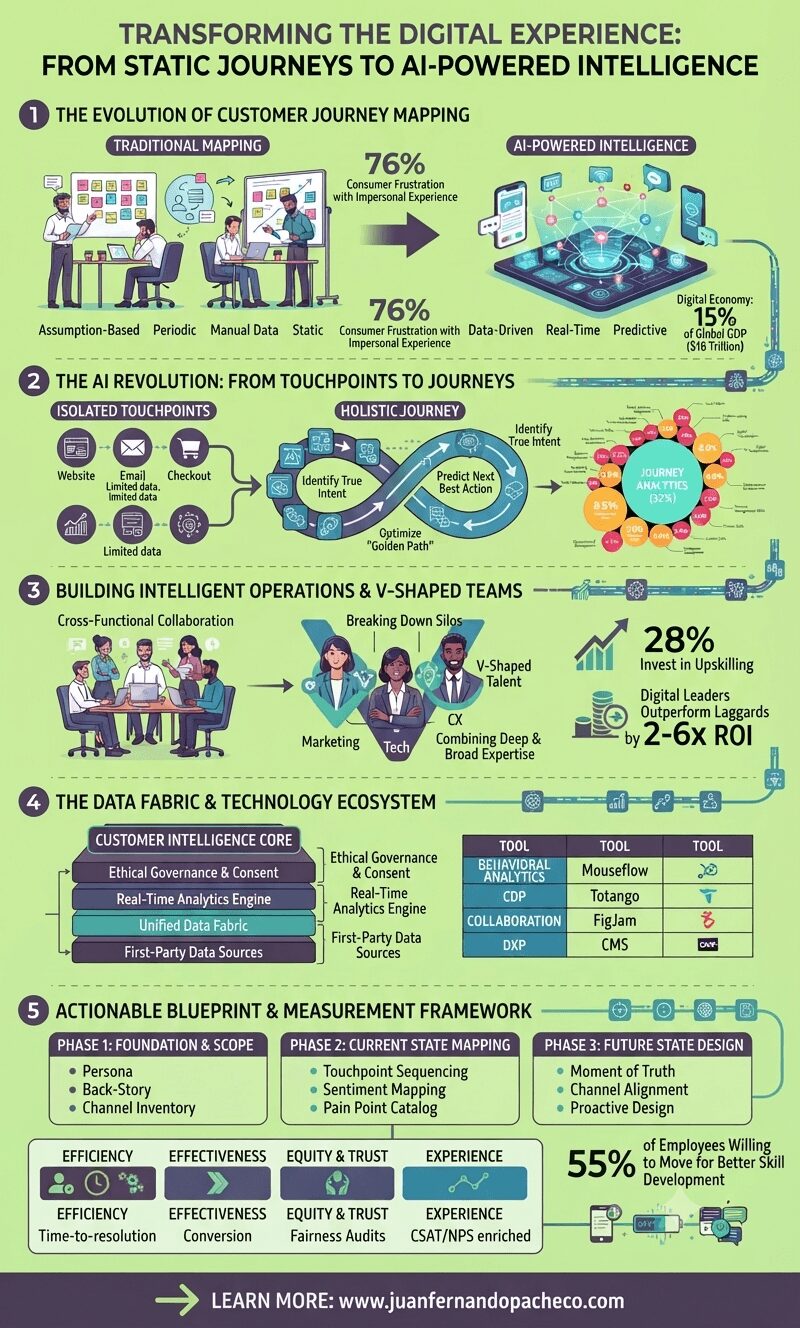
The future of customer journey mapping lies in creating dynamic, self-updating systems that not only reflect current customer behaviors but also predict future needs and preferences. This requires investment in both technology and talent—particularly in developing V-shaped employees who can bridge functional silos and translate data insights into human-centered experiences.
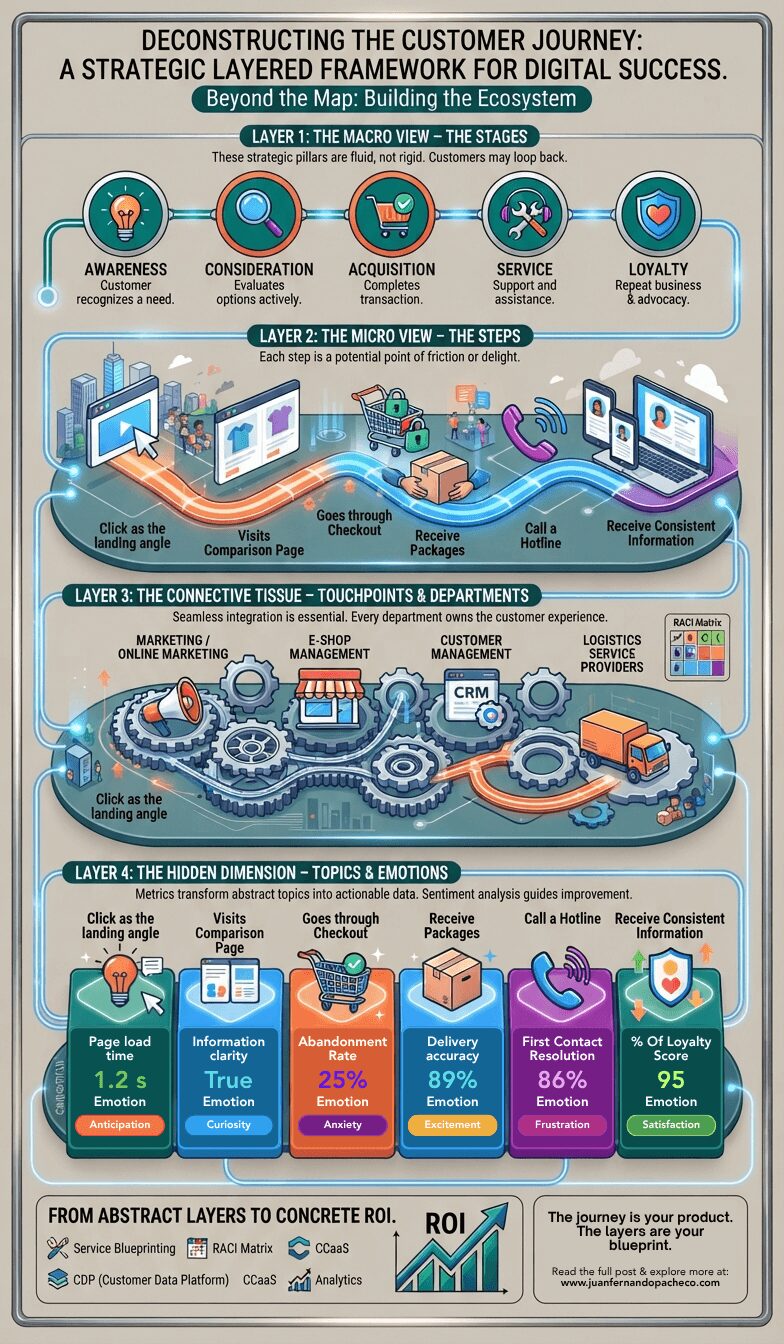
Customer Journey Layers is more than a diagram; it’s a philosophical shift from a customer-centric mindset to a customer-centric operating model. It acknowledges that every digital experience is a manifestation of your internal architecture—your technology, your processes, and your organizational alignment.
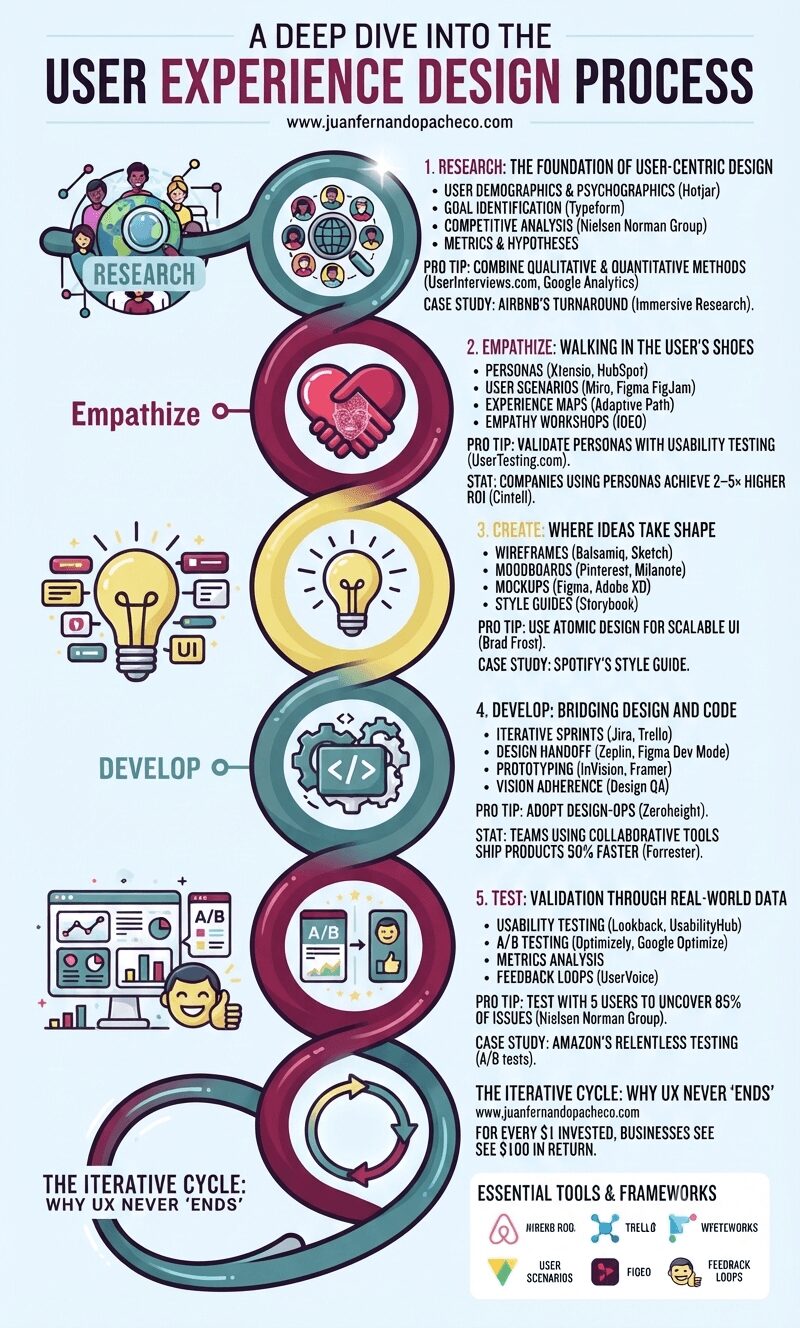
Neglecting UX risks obsolescence. Brands like Apple and Tesla dominate by embedding user-centricity in their DNA. Start small: interview 5 users today. Map one customer journey. Test one button. The process compounds—each iteration deepens empathy, refines solutions, and ultimately, builds products humans love.
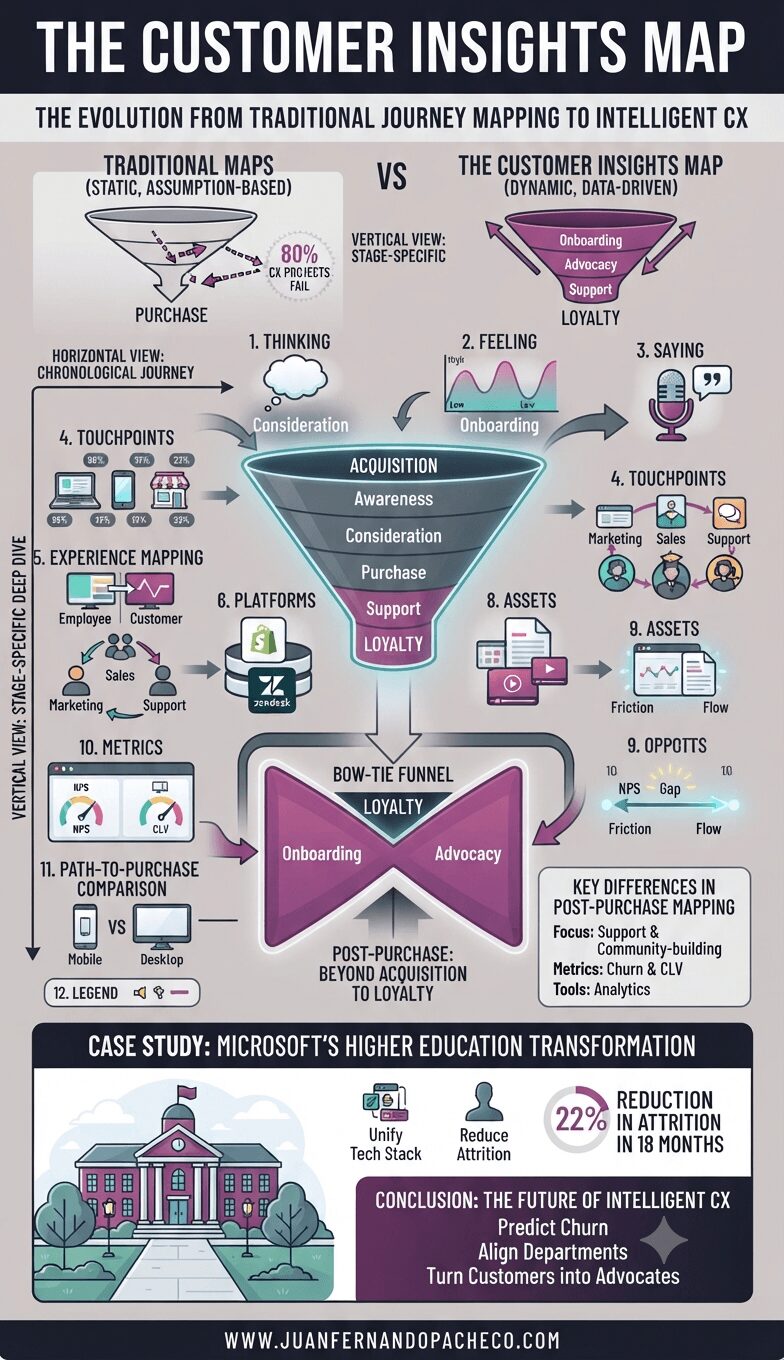
Enter the Customer Insights Map—a fusion of qualitative empathy, quantitative analytics, and strategic frameworks like StoryVesting and Hoshin methodology.
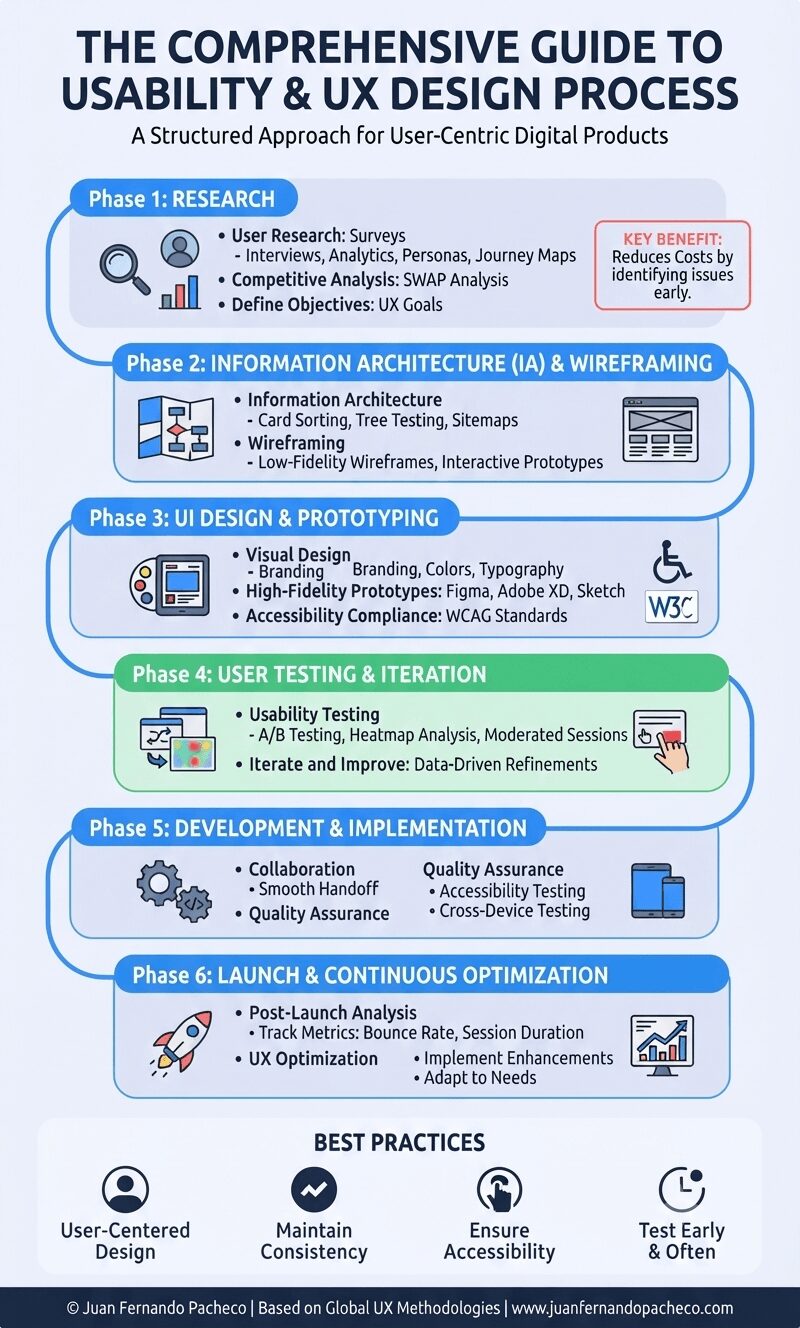
The UX design process is essential for creating user-friendly, effective digital experiences. By following structured methodologies, leveraging research, and continuously improving based on feedback, businesses can enhance user satisfaction and drive success.
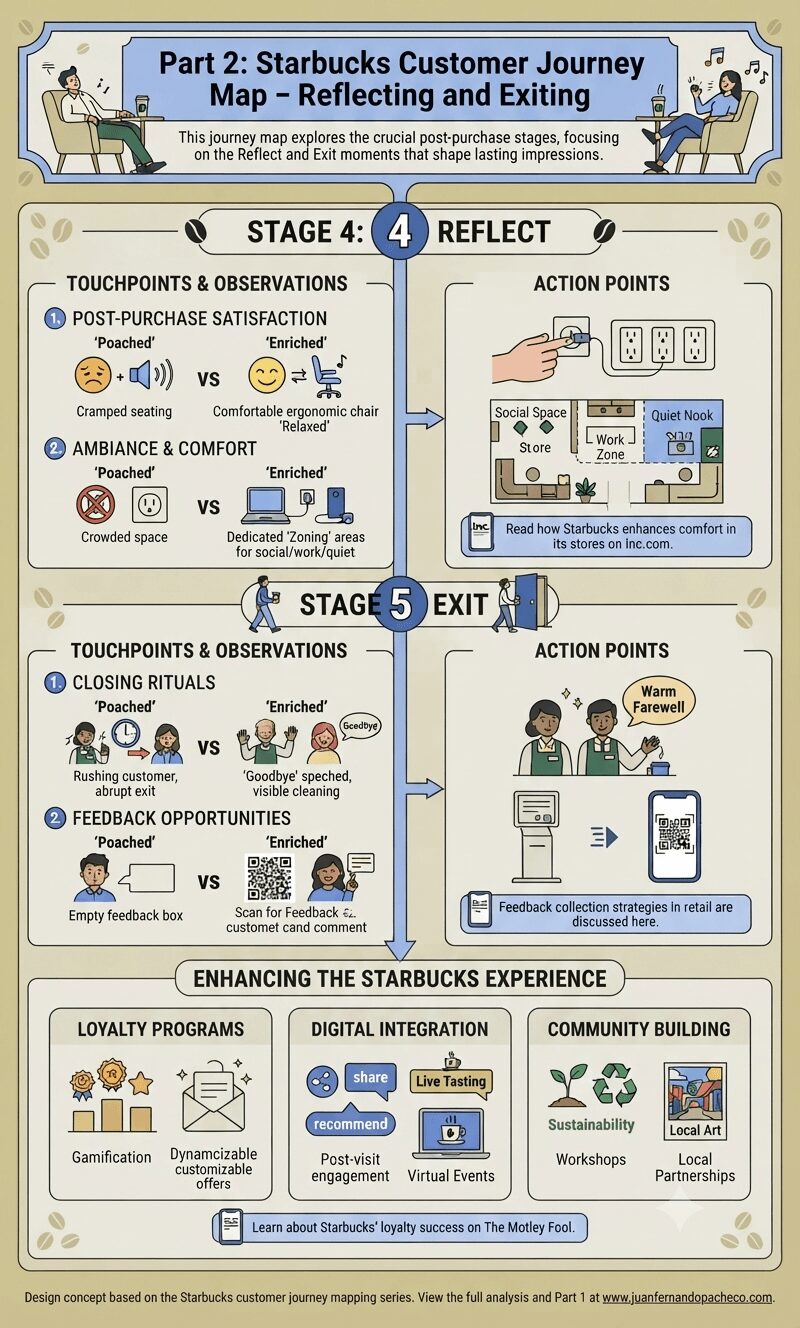
The second half of the Starbucks customer journey map focuses on post-purchase experiences, including the Reflect and Exit stages.
These stages are critical in leaving a lasting impression and influencing future visits.
Here, we delve into touchpoints, identify areas for improvement, and propose actionable strategies to ensure customer experience satisfaction remains high.
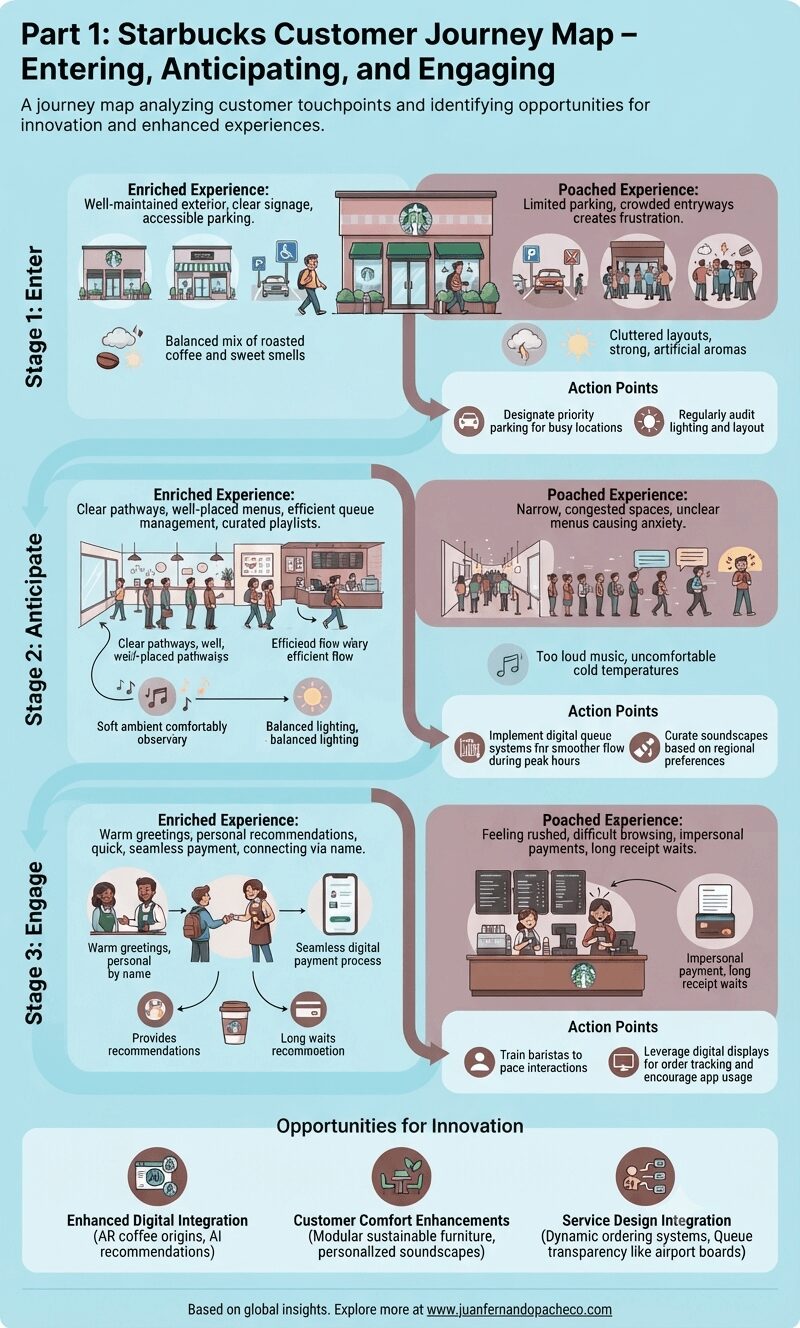
The Starbucks customer journey is more than just a coffee run; it’s a dynamic interaction of sensory, emotional, and functional elements. Each stage has distinct touchpoints that shape perceptions and satisfaction levels. Here, we’ll unpack the journey’s early stages.
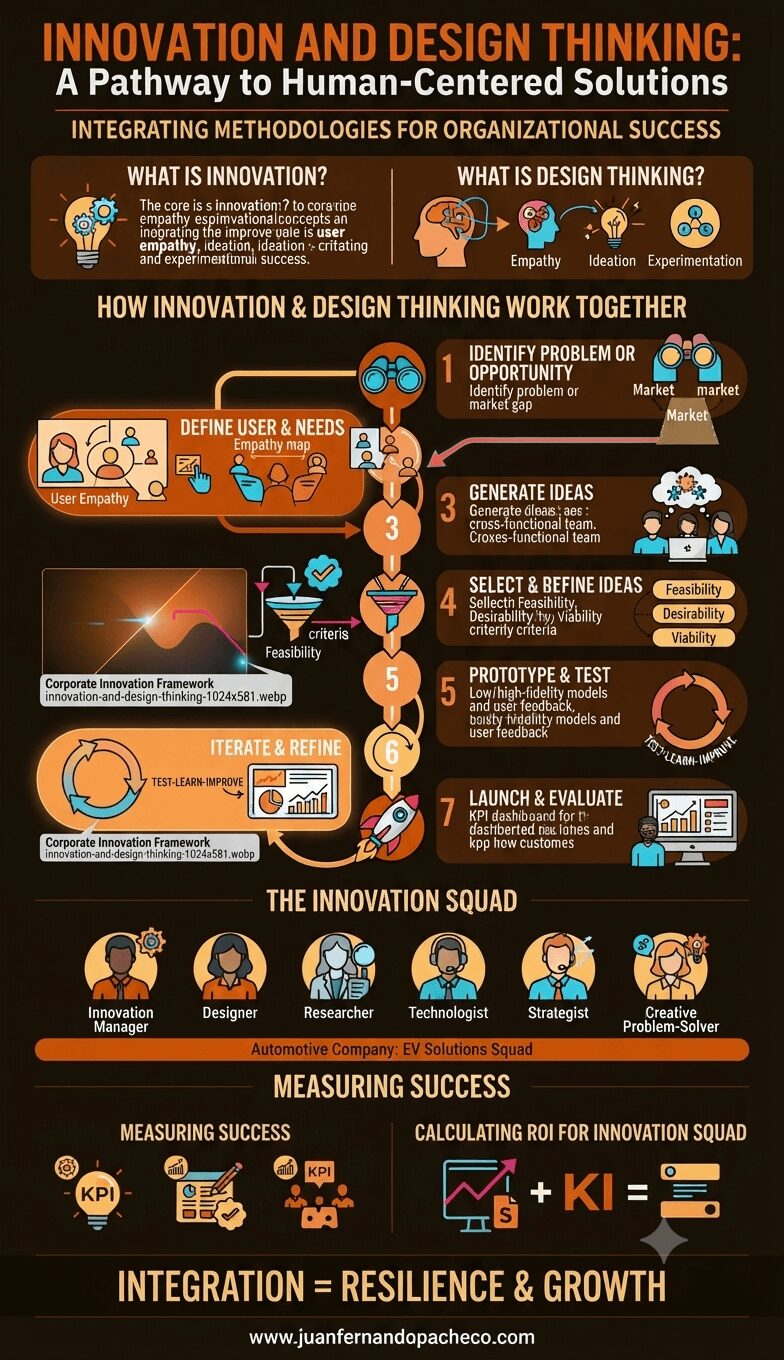
Integrating Innovation and Design Thinking is not just a methodology but a mindset. By fostering creativity, empathy, and experimentation, organizations can: