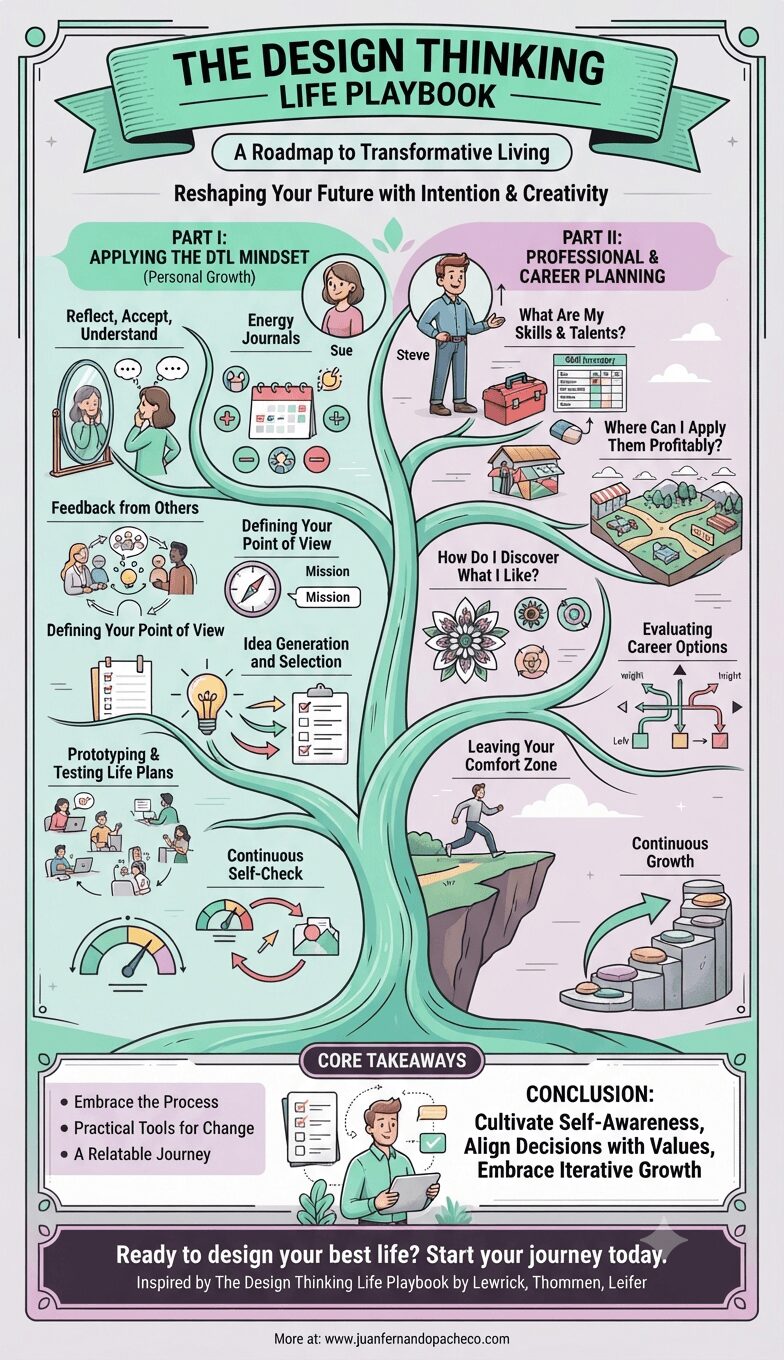
An infographic titled "The Design Thinking Life Playbook" presented as a branching tree diagram. The left side, "Applying the DTL Mindset," shows a character named Sue using methods like energy journals and prototyping life plans. The right side, "Professional and Career Planning," shows a character named Steve evaluating options and seeking growth. The base lists "Core Takeaways" and the URL www.juanfernandopacheco.com.

Navigating personal and professional transitions can feel overwhelming. The Design Thinking Life Playbook by Michael Lewrick, Jean-Paul Thommen, and Larry Leifer offers a groundbreaking guide to managing these shifts.

Rooted in design thinking principles, the book provides actionable strategies to reshape your future with intention and creativity. This blog post delves into the essence of the book, exploring its methodologies, insights, and transformative potential.

An infographic titled "What Is Fluent Design System?" featuring sections on its core principles, design toolkit, SWOT analysis, and best practices, all using a warm, orange-to-brown color palette.

Fluent Design is more than just a design system—it is a philosophy that prioritizes user satisfaction through innovation, inclusivity, and consistency. By creating interfaces that are both functional and aesthetically pleasing, Fluent Design helps Microsoft stand out in a competitive digital landscape.

An infographic titled "What is Ant Design?" presented in a warm, vintage-inspired color palette of creams and browns. The infographic uses a flow-chart and diagram style to explain the design system, starting with its origin from Ant Financial. It covers Key Principles, The Ant Design Language System, Best Practices, a SWOT Analysis with illustrated sections, Real-World Applications like Alipay and DingTalk, and concludes with links to learn more at juanfernandopacheco.com.

Ant Design, is a robust design system developed by Ant Financial, a subsidiary of the Alibaba Group. The design system has rapidly gained traction among designers and developers for its ability to simplify the design process while ensuring superior user experiences.

A detailed vertical infographic titled "WHAT IS A DESIGN SYSTEM?" presented on a sage-green background with a custom color palette. The image is organized into three main sections: "THE CORE," "BUILDING YOUR SYSTEM: BEST PRACTICES," and "INDUSTRY-LEADING EXAMPLES."

A design system is a powerful tool that drives consistency, efficiency, and innovation in product design. By adopting a design system, organizations can deliver cohesive and intuitive user experiences while streamlining their workflows.

Whether you’re developing your first system or refining an existing one, following the principles and best practices outlined in this guide will set you on the path to success.

An infographic titled 'What is Behavioral and Attitudinal Segmentation?' illustrating a comprehensive marketing framework. It defines behavioral segmentation (the 'What') and attitudinal segmentation (the 'Why'), shows their combined power for 'Synergized Insights,' outlines a five-step implementation framework, details common mistakes and best practices, and provides global industry examples for retail, financial services, and healthcare. The infographic concludes with a call-to-action for WWW.JUANFERNANDOPACHECO.COM.

Behavioral and attitudinal segmentation is a powerful strategy for marketers aiming to connect with their audience on a deeper level. By understanding both what customers do and why they do it, businesses can craft personalized experiences that drive engagement and loyalty. By avoiding common pitfalls and following best practices, organizations can maximize the effectiveness of their segmentation efforts, ultimately leading to stronger customer relationships and improved ROI.

An infographic titled "What is Demographic Segmentation," designed with a dark background and yellow/blue accents. The chart visually explains the concept of dividing an audience based on shared characteristics like age, gender, and income. It covers key principles, importance, best practices, common mistakes, real-world examples (such as luxury vs. affordable cars and TikTok vs. traditional media), and future trends like AI analytics. The footer includes the URL www.juanfernandopacheco.com.

Demographic segmentation is a powerful tool for marketers aiming to understand their audience and craft effective campaigns. By following best practices and avoiding common pitfalls, businesses can achieve better results, foster customer loyalty, and gain a competitive edge. Start implementing demographic segmentation today and watch your marketing efforts soar!

A detailed infographic illustrating the journey of digital transformation across a vertical, flowing timeline, featuring sections on core technologies, foundational pillars, best practices, and the four key stages, with illustrative icons and the URL www.juanfernandopacheco.com at the base.

Digital transformation is no longer optional but essential for organizations that wish to stay competitive in today’s fast-paced, technology-driven market. By understanding the core pillars, best practices, stages, and common mistakes, organizations can navigate the complexities of digital transformation and drive long-term success. As companies embrace these changes, they will enhance their customer experiences, optimize operations, and create new growth opportunities that will propel them forward in the digital age.

An infographic titled "WHAT ARE THE UX DESIGN BEST PRACTICES – PART 02" from www.juanfernandopacheco.com, presented in a vertical timeline format against a muted, professional background. It details six strategic steps: 1. Iterating based on feedback (with Hotjar and Nielsen Norman Group resources); 2. Ensuring accessibility (following WCAG/ADA standards and including a diverse group of users); 3. Optimizing for various devices (using fluid grids and tools like Tailwind CSS and BrowserStack); 4. Creating visually appealing designs (referencing Material Design and visual hierarchy); 5. Providing clear guidance (including microcopy and error recovery); and 6. Avoiding common mistakes (skipping research, ignoring accessibility, and information overload).

Adhering to UX design best practices ensures the creation of intuitive, inclusive, and visually compelling digital experiences. By embracing continuous iteration, prioritizing accessibility, optimizing for diverse devices, crafting intuitive designs, and providing clear guidance, designers can deliver products that delight users and drive engagement.

A detailed vertical infographic titled "WHAT IS USABILITY IN UX" illustrating the definition, importance, principles, key areas, and best practices of usability. It uses a muted color palette of beige, green, and dark gray against a light background, featuring icons, wireframes, and a shopping website case study.

Usability is the backbone of exceptional UX design, ensuring products are intuitive, efficient, and satisfying to use.

By focusing on simplicity, clarity, and consistency, and addressing critical areas like navigation, forms, and mobile responsiveness, designers can craft experiences that delight users.

A detailed infographic titled "What is a User Journey Map?" set against a dark background with a glowing, circuit-like path. The infographic is structured in vertical sections, starting with the definition and importance of User Journey Maps. It then details the core components (Actor, Scenario, Phases, Actions, Mindset, Emotions, Opportunities, Visualization) and outlines a 7-step creation process. Following this, it provides three distinct examples (Online Retail Shopping, Mobile App Onboarding, Online Banking) and lists best practices and popular tools (Miro, Lucidchart, Smaply, UXPressia). The bottom section includes the URL "WWW.JUANFERNANDOPACHECO.COM" and resource logos.

A User Journey Map is an indispensable tool in UX design, enabling teams to create user-centric products and services. By capturing the user’s actions, emotions, and pain points, it provides valuable insights that drive innovation and improve overall user satisfaction.