Supercharging Design Thinking in the AI Era of 2026
Why visual thinking matters more than ever
As we navigate the complexities of 2026, where artificial intelligence, rapid technological change, and evolving user expectations reshape how we work and innovate, the need for clear, collaborative problem-solving has never been more critical.
After years of crafting user-centered experiences and driving innovation through design, I’ve witnessed firsthand how visual thinking tools transform abstract ideas into tangible solutions that resonate with users and drive business success
Design thinking has long been established as a cornerstone methodology for tackling complex problems and fostering innovation across various fields.
However, the true power of design thinking emerges when we combine it with visual thinking—the practice of using diagrams, sketches, maps, and visual frameworks to make complex ideas more digestible and actionable.
The framework I’m sharing with you today represents a comprehensive toolkit that bridges the gap between design thinking methodology and visual thinking practices. This isn’t just theory; it’s a practical, battle-tested approach that I’ve used to help organizations navigate digital transformation, create innovative products, and build experiences that truly matter to users.
Understanding the Design Thinking Methodology Framework
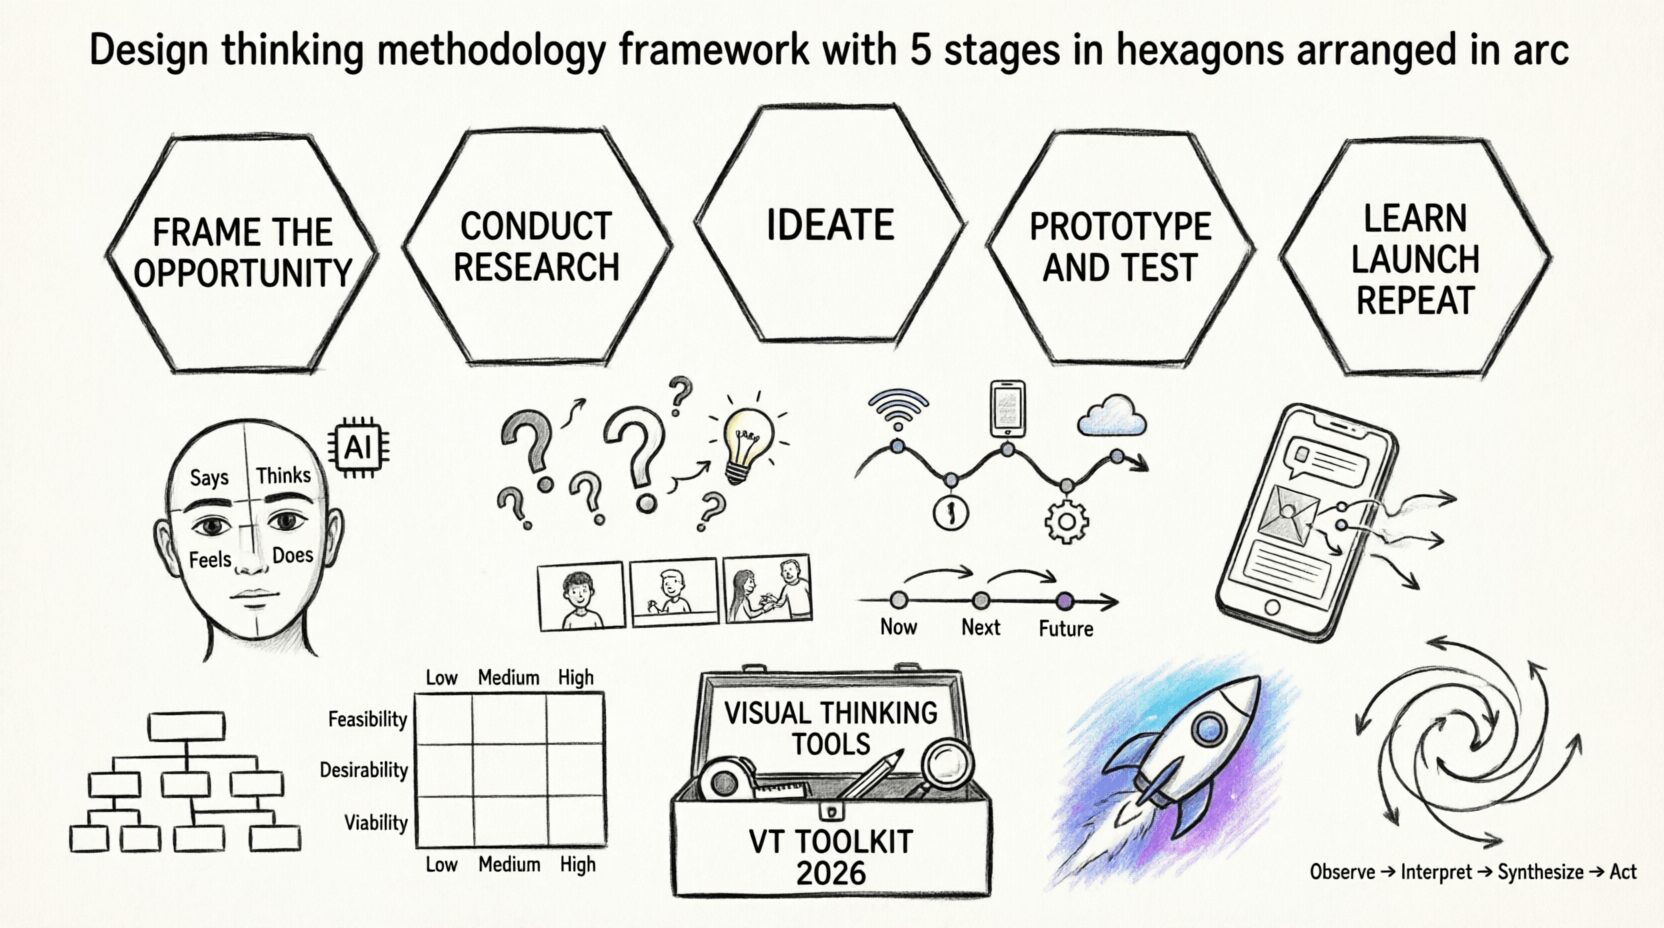
The visual framework before you illustrates a complete innovation cycle, organized around five interconnected stages that form the backbone of effective design thinking:
1. Frame the Opportunity
2. Conduct Research
3. Ideate
4. Prototype and Test
5. Learn, Launch, and Repeat
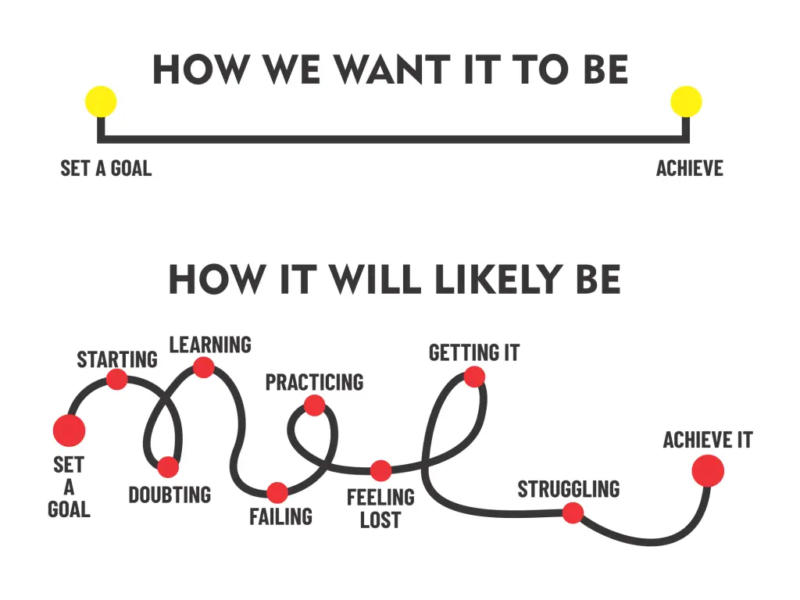
What makes this approach particularly powerful in 2026 is its iterative, non-linear nature. Unlike traditional waterfall methodologies, this framework acknowledges that innovation is messy, cyclical, and requires constant refinement based on real user feedback.
Let me walk you through each stage and the visual thinking tools that bring them to life.
Stage 1: Frame the Opportunity – Setting the Foundation for Success
Before diving into solutions, we must clearly understand the problem space. This initial stage is where many teams fail—they rush to solve the wrong problem. The visual thinking tools available at this stage help you create clarity and alignment.
Sensemaking
In our information-overloaded world, sensemaking is the art of finding patterns in chaos. This visual tool helps you organize complex data, identify connections, and create meaning from disparate information sources. Whether you’re analyzing market research, user interviews, or competitive landscapes, sensemaking diagrams help you see the forest through the trees.
In 2026, with AI generating vast amounts of data and insights, sensemaking becomes even more crucial. We need human judgment to interpret what AI surfaces, to question assumptions, and to identify the signals that truly matter for our specific context.
Organization
The organization tool helps you structure information hierarchically, creating visual representations of how different elements relate to one another. This might involve clustering similar ideas, creating affinity diagrams, or mapping stakeholder ecosystems.
When working with distributed teams across time zones—a reality for most organizations today—these visual organizational tools create a shared reference point that asynchronous collaboration depends on.
Visualize Current State
You can’t chart a course forward without understanding where you are today. The current state visualization captures the existing user experience, business processes, or service delivery model. This baseline is essential for measuring progress and identifying specific pain points that need addressing.
I’ve found that current state visualizations often reveal inefficiencies and opportunities that stakeholders didn’t realize existed. When you make the invisible visible, transformation becomes possible.
Stage 2: Conduct Research – Building Deep Empathy
Research in design thinking goes beyond traditional market studies. It’s about developing genuine empathy for users, understanding their behaviors, motivations, and unmet needs. The visual thinking tools at this stage transform raw research data into actionable insights.
Empathy Mapping
Empathy maps are deceptively simple yet incredibly powerful. They help you synthesize qualitative research by organizing what users say, think, feel, and do. This four-quadrant framework forces you to move beyond surface-level observations and dig into the emotional and cognitive dimensions of user experience.
In 2026, as we design for increasingly diverse, global audiences, empathy mapping helps us avoid cultural blind spots and create truly inclusive solutions. It reminds us that users are complex humans, not just data points or personas.
Journey Mapping
Customer journey maps visualize the complete end-to-end experience users have with your product or service. They capture every touchpoint, emotion, pain point, and moment of delight across the entire user journey.
What makes journey mapping particularly valuable today is its ability to reveal gaps between different channels, departments, or service components. In an era where users expect seamless omnichannel experiences, journey maps help you identify where those experiences break down.
Modern journey mapping has evolved to include:
- Emotional arcs showing how users feel at each stage
- Behind-the-scenes processes that enable or hinder the experience
- Digital and physical touchpoints in integrated ecosystems
- Time-based metrics showing how long each stage takes
Visualize Current State (Research Context)
While we mentioned current state visualization in the framing stage, it takes on new depth during research. Here, you’re not just mapping processes—you’re capturing the emotional reality, the workarounds users have created, and the hidden frustrations that never make it into formal feedback channels.
Stage 3: Ideate – Generating Breakthrough Solutions
With deep user understanding established, we move into the creative phase. Ideation is where we generate a wide range of possible solutions, challenging assumptions, and exploring possibilities.
Brainstorming
Traditional brainstorming gets a visual upgrade in this framework. Instead of just talking ideas out, visual brainstorming involves sketching, diagramming, and creating quick visual representations of concepts. This approach has several advantages:
- Faster idea generation – Drawing is often quicker than describing
- Better retention – Visual ideas stick in memory longer
- Increased participation – Visual formats engage different thinking styles
- Reduced ambiguity – Pictures clarify what words might obscure
In 2026, brainstorming often happens in hybrid environments, with some participants in the room and others joining virtually. Digital whiteboarding tools like Miro, Mural, and FigJam have made visual brainstorming accessible to distributed teams, though they require facilitation skills to be effective.
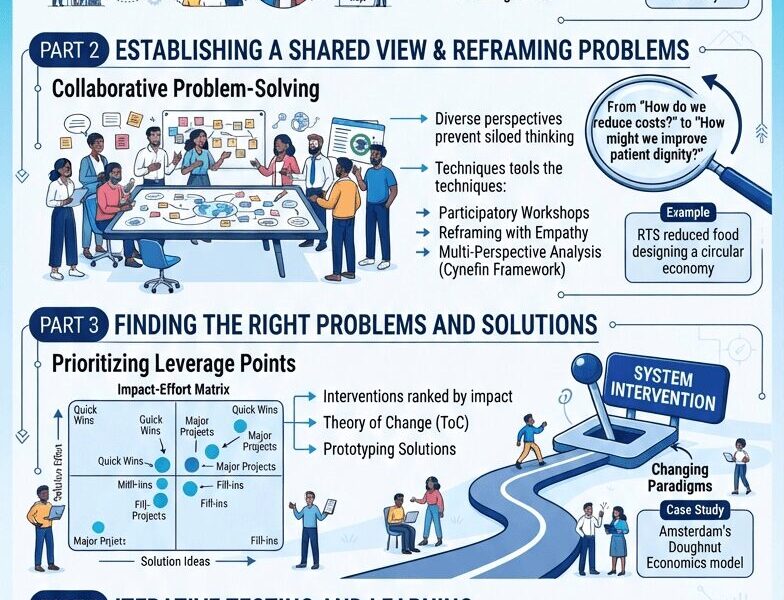
Prioritization
Not all ideas are created equal. Prioritization frameworks help you evaluate and rank potential solutions based on criteria like:
- Impact vs. Effort – Quick wins vs. major projects
- User Value vs. Business Value – Balancing stakeholder needs
- Feasibility vs. Desirability – What’s possible vs. what’s wanted
- Time to Market – Urgency and competitive pressure
Visual prioritization makes the decision-making process transparent and collaborative. When everyone can see how decisions are being made, buy-in increases and second-guessing decreases.
Visual Prototyping (Early Stage)
While prototyping is its own stage, early visual prototypes often emerge during ideation. Quick sketches, storyboards, and concept visualizations help teams explore ideas more fully and get immediate feedback on whether a concept has legs.
Stage 4: Prototype and Test – Making Ideas Tangible
This is where abstraction becomes concrete. Prototyping and testing transform promising ideas into tangible artifacts that users can interact with, providing the feedback necessary to refine and improve.
Visual Prototyping
Visual prototypes range from low-fidelity sketches to high-fidelity interactive mockups. The key is matching the fidelity to your learning goals:
- Low-fidelity – Quick, cheap, focused on concepts and flow
- Mid-fidelity – More detailed, testing specific interactions
- High-fidelity – Polished, testing visual design and micro-interactions
In 2026, AI-powered design tools will have dramatically accelerated prototyping. Tools can now generate multiple design variations, suggest improvements based on best practices, and even create interactive prototypes from sketches. However, human judgment remains essential in deciding what to prototype, what to test, and how to interpret results.
Storyboarding
Storyboards show how users interact with your solution over time, capturing the narrative of the experience. They’re particularly useful for:
- Service design – Showing how different touchpoints connect
- Complex workflows – Illustrating multi-step processes
- Emotional journeys – Capturing how users feel at each stage
- Context of use – Showing where and when interactions happen
Storyboards help teams think beyond individual screens or moments to consider the complete experience narrative.
Visual Roadmapping
Roadmaps visualize the path from concept to launch, showing what will be built, in what sequence, and why. Effective roadmaps balance:
- Strategic vision – Where we’re going
- Tactical execution – What we’re doing now
- Stakeholder communication – Keeping everyone aligned
- Flexibility – Adapting to new learnings
In today’s fast-paced environment, roadmaps have evolved from fixed, date-driven plans to flexible, outcome-focused guides that can pivot based on user feedback and market changes.
Assessment + Evaluation
Before launching, we need a rigorous evaluation. Visual assessment tools help you:
- Compare alternatives – Side-by-side evaluation of options
- Score against criteria – Objective evaluation frameworks
- Identify risks – Visualizing potential failure points
- Measure readiness – Are we truly ready to launch?
This stage prevents the common mistake of launching prematurely, before solutions have been adequately validated.
Stage 5: Learn, Launch, and Repeat – The Iterative Cycle
The final stage acknowledges that launch is not the end—it’s the beginning of a new learning cycle.
Visualize Future State
While we started by visualizing the current state, we now articulate the future state we’re creating. This vision serves multiple purposes:
- Alignment – Ensuring everyone understands the goal
- Motivation – Inspiring teams with a compelling destination
- Measurement – Creating a baseline for tracking progress
- Communication – Helping stakeholders understand the change
Future state visualizations should be ambitious yet achievable, inspiring yet grounded in research.
Stop, Start, Continue
This simple but powerful framework helps teams reflect on what they’ve learned and decide what to do differently:
- Stop – What isn’t working and should be abandoned
- Start – New approaches to try based on learnings
- Continue – What’s working and should be maintained
Regular stop-start-continue retrospectives create a culture of continuous improvement and learning.
The Cycle Repeats
Notice the circular arrows in the framework. This isn’t accidental. Design thinking is inherently iterative. Each launch generates new learnings, which inform the next cycle of innovation. In 2026, this iterative approach is essential for staying competitive in rapidly evolving markets.
Applying Visual Thinking Tools in 2026: Practical Recommendations
After two decades of practicing and teaching these methods, here are my key recommendations for applying visual thinking tools effectively in today’s environment:
1. Start Simple, Scale Gradually
Don’t try to implement every tool at once. Begin with one or two that address your most pressing challenge—perhaps empathy mapping if you lack user understanding, or journey mapping if you’re experiencing siloed experiences. Master these before expanding your toolkit.
2. Make It Collaborative
Visual thinking tools are most powerful when created collaboratively. Bring together diverse perspectives—users, frontline employees, executives, technologists. The magic happens in the conversation, not just in the final artifact.
3. Embrace Hybrid Facilitation
In 2026, most teams are hybrid. Invest in learning digital facilitation skills and tools. But don’t abandon physical workshops entirely—sometimes the energy of in-person collaboration is irreplaceable. Choose the format that best serves your goals.
4. Balance Speed and Rigor
AI tools can accelerate many aspects of visual thinking—generating journey map templates, suggesting empathy map insights, and creating prototype variations. Use these capabilities, but don’t skip the human sensemaking. The insights that matter most require human interpretation and judgment.
5. Create Visual Literacy
Not everyone is comfortable drawing or interpreting visual frameworks. Invest in building visual literacy across your organization. Offer training, create templates, celebrate visual communication. Make it safe for people to sketch rough ideas rather than demanding polished deliverables.
6. Connect to Business Outcomes
Visual thinking tools aren’t just creative exercises—they must drive business results. Always connect your visualizations to measurable outcomes: improved user satisfaction, reduced friction, increased conversion, faster time to market. This accountability ensures your visual thinking drives real impact.
7. Document and Share
Create a visual thinking repository. Capture your maps, diagrams, and frameworks in accessible formats. This institutional memory accelerates future projects and helps onboard new team members. In distributed organizations, these artifacts become crucial knowledge repositories.
The Intersection of AI and Visual Thinking
As we navigate 2026, artificial intelligence is transforming how we apply visual thinking tools. Here’s how to leverage AI while maintaining the human-centered essence of design thinking:
AI as an Accelerator, Not a Replacement
AI can generate journey map templates, suggest empathy map categories, and create prototype variations. But AI cannot replace the deep empathy, creative insight, and ethical judgment that human designers bring. Use AI to handle the mechanical aspects, freeing you to focus on strategic thinking and human connection.
Enhanced Pattern Recognition
AI excels at identifying patterns in large datasets. Use machine learning to analyze user research at scale, then apply human judgment to interpret what those patterns mean and how to act on them.
Personalization at Scale
Visual thinking tools help you design for specific user segments. AI enables you to personalize experiences for individuals while maintaining the coherence of the overall experience. The combination is powerful.
Ethical Considerations
As you apply visual thinking to AI-powered products and services, use these tools to surface ethical considerations: bias, privacy, transparency, and human agency. Empathy maps should include concerns about AI interactions. Journey maps should capture moments where users need human support versus automated service.
Conclusion: Your Visual Thinking Journey Starts Now
The design thinking methodology with visual thinking tools I’ve outlined here represents more than just a process—it’s a mindset shift toward collaborative, iterative, human-centered innovation. In 2026, where complexity is the norm and user expectations continue to rise, this approach isn’t optional; it’s essential.
Whether you’re a seasoned designer, a business leader driving digital transformation, or an entrepreneur launching your first product, these visual thinking tools can elevate your work. They’ll help you see problems more clearly, generate better solutions, and create experiences that truly resonate with users.
Remember, mastery comes through practice. Start with one tool. Apply it to a real challenge. Learn from the experience. Iterate. Over time, you’ll build the visual thinking muscles that will transform how you approach innovation.
The future belongs to those who can make complexity simple, who can align diverse stakeholders around shared visions, and who can turn insights into action. Visual thinking tools give you that superpower.