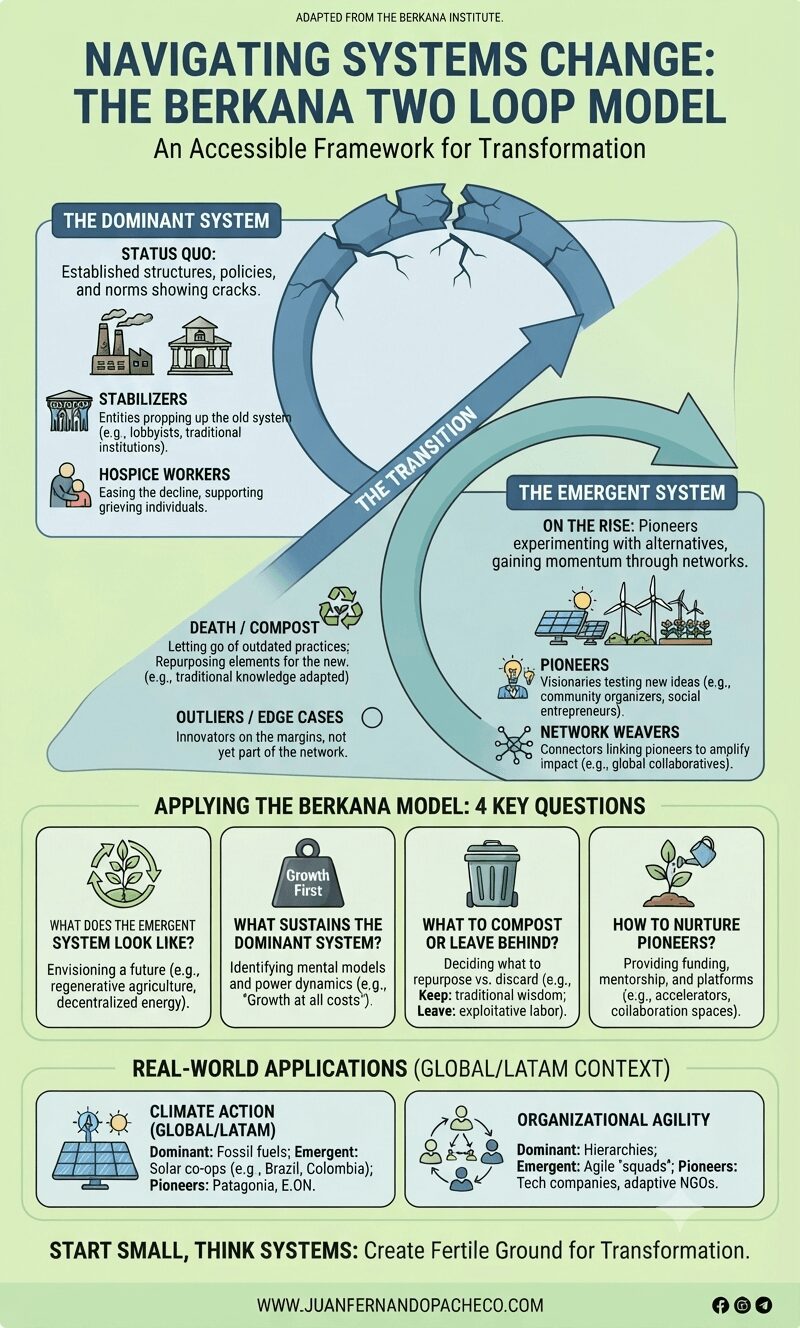
The Berkana Two Loop Model demystifies systems change. By naming pioneers, building networks, and composting the old, we create fertile ground for transformation.
Tag: Product Design
Product design is the process of identifying a market opportunity, clearly defining the problem, developing a proper solution for that problem and validating the solution with real users.
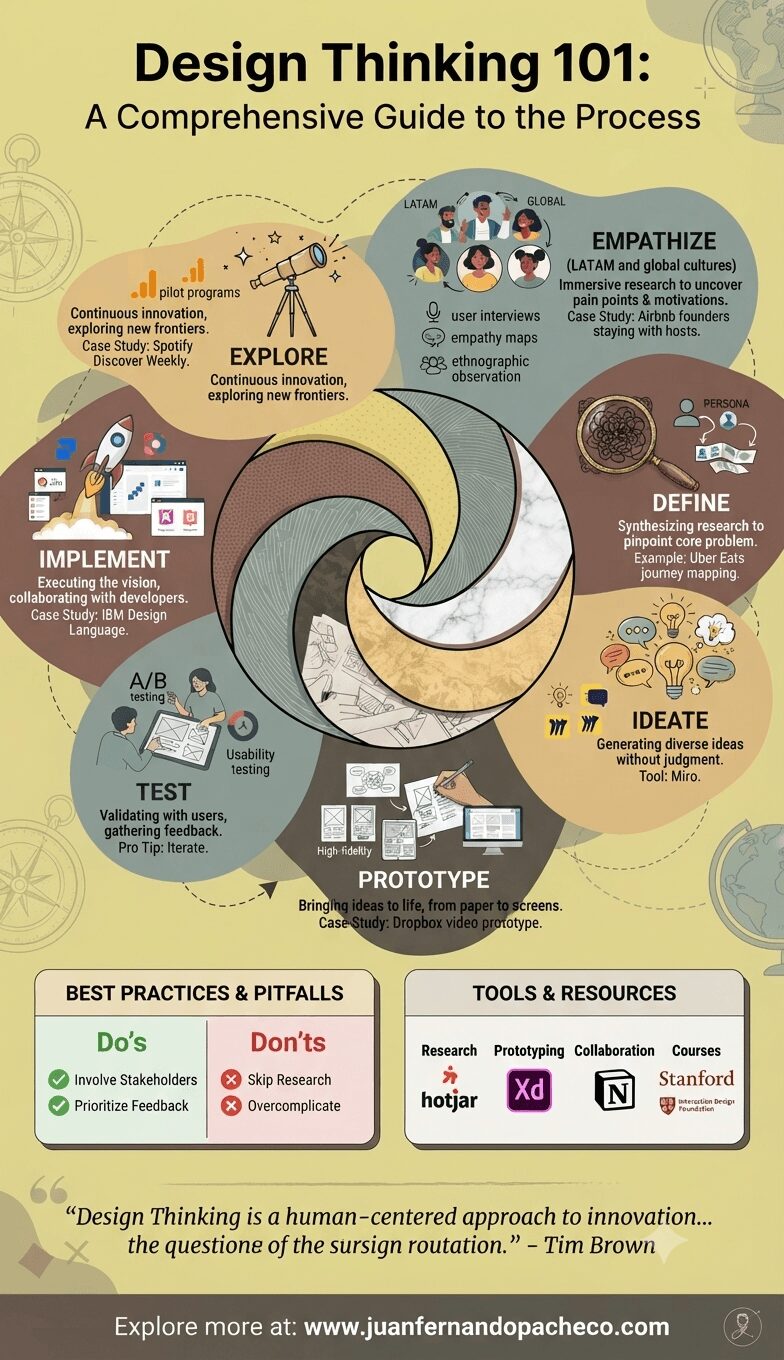
Design Thinking is a human-centered methodology that empowers teams to solve complex problems through creativity, empathy, and iterative learning.
Rooted in disciplines like UX design and systems thinking, it bridges the gap between user needs and business goals. According to the Stanford d.school, Design Thinking is “a methodology for innovation that combines creative and analytical approaches.”
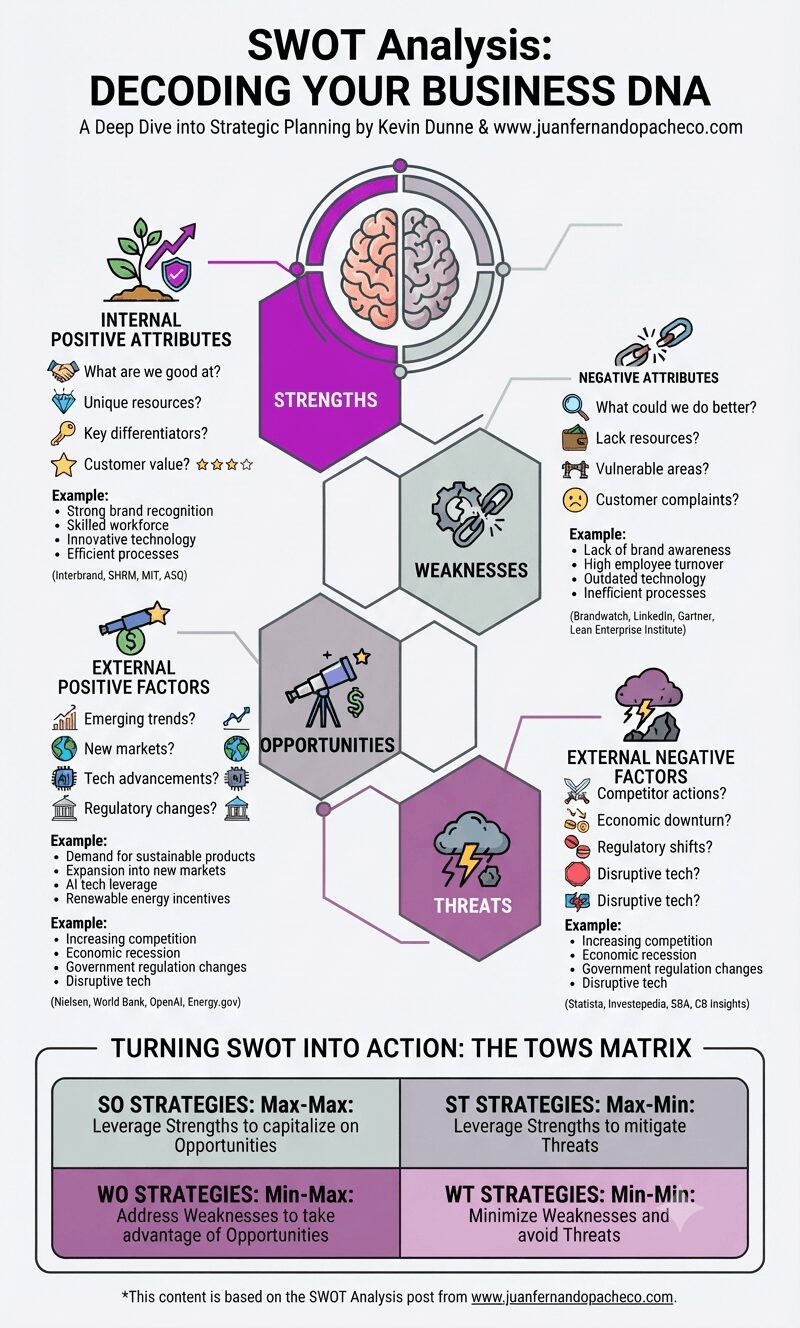
A SWOT analysis is a powerful tool for understanding your organization’s current position and charting a course for future success. By systematically analyzing your strengths, weaknesses, opportunities, and threats, you can develop targeted strategies that leverage your competitive advantages and mitigate potential risks.
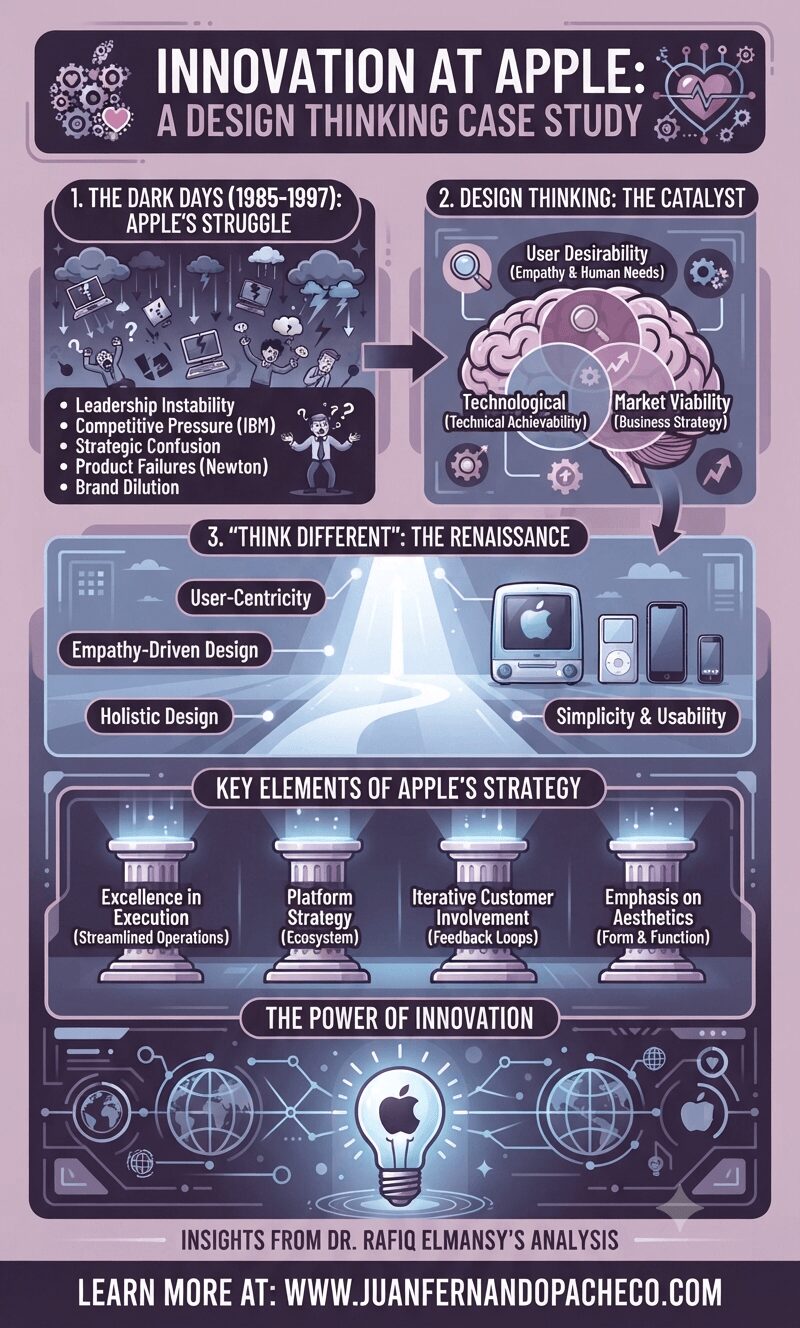
Apple’s resurgence is a compelling case study in the power of Design Thinking. By embracing a user-centric approach, prioritizing simplicity and usability, and fostering a culture of innovation, Apple has transformed itself from a struggling company to a global leader.
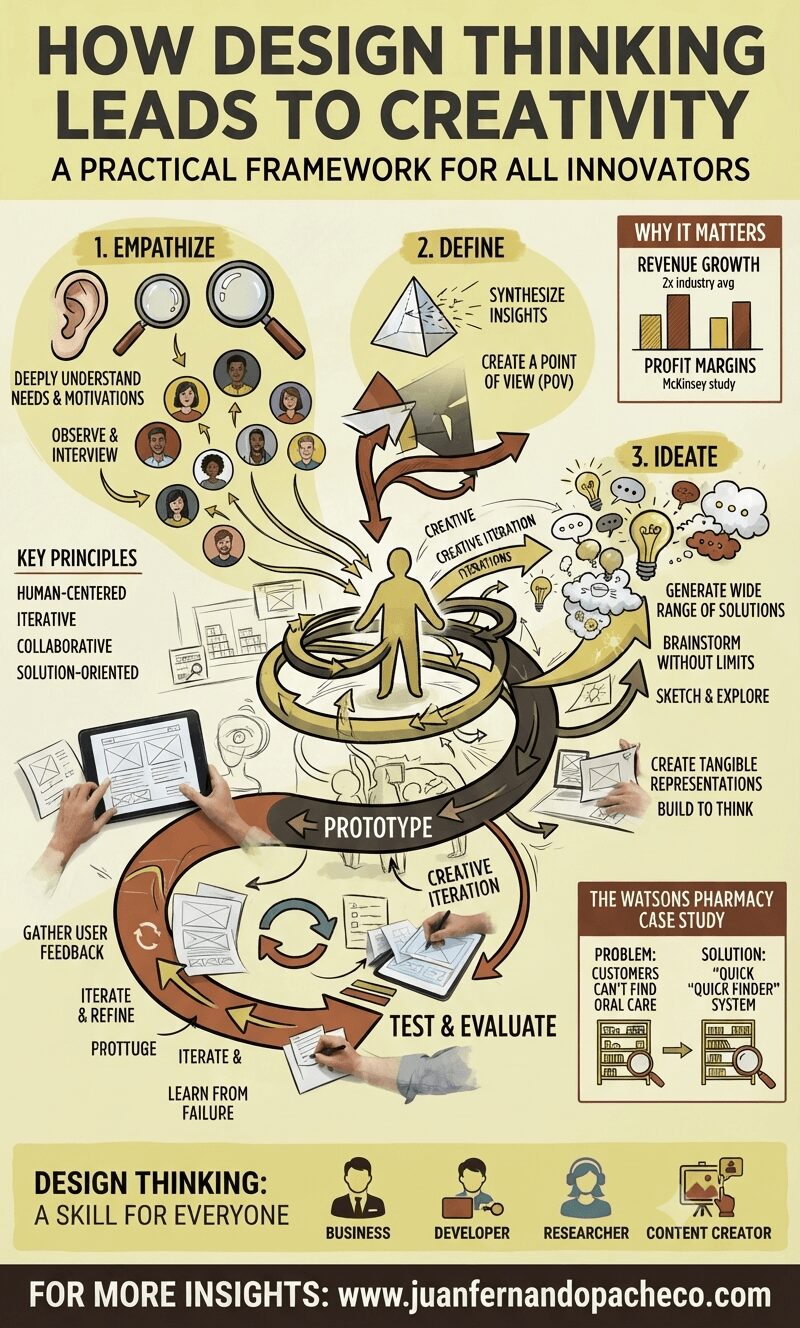
Design Thinking isn’t limited to professional designers. It’s a valuable skill for anyone who wants to solve problems creatively and drive innovation. By adopting a human-centered approach and embracing the iterative nature of design thinking, individuals and organizations can unlock their creative potential and achieve remarkable results.
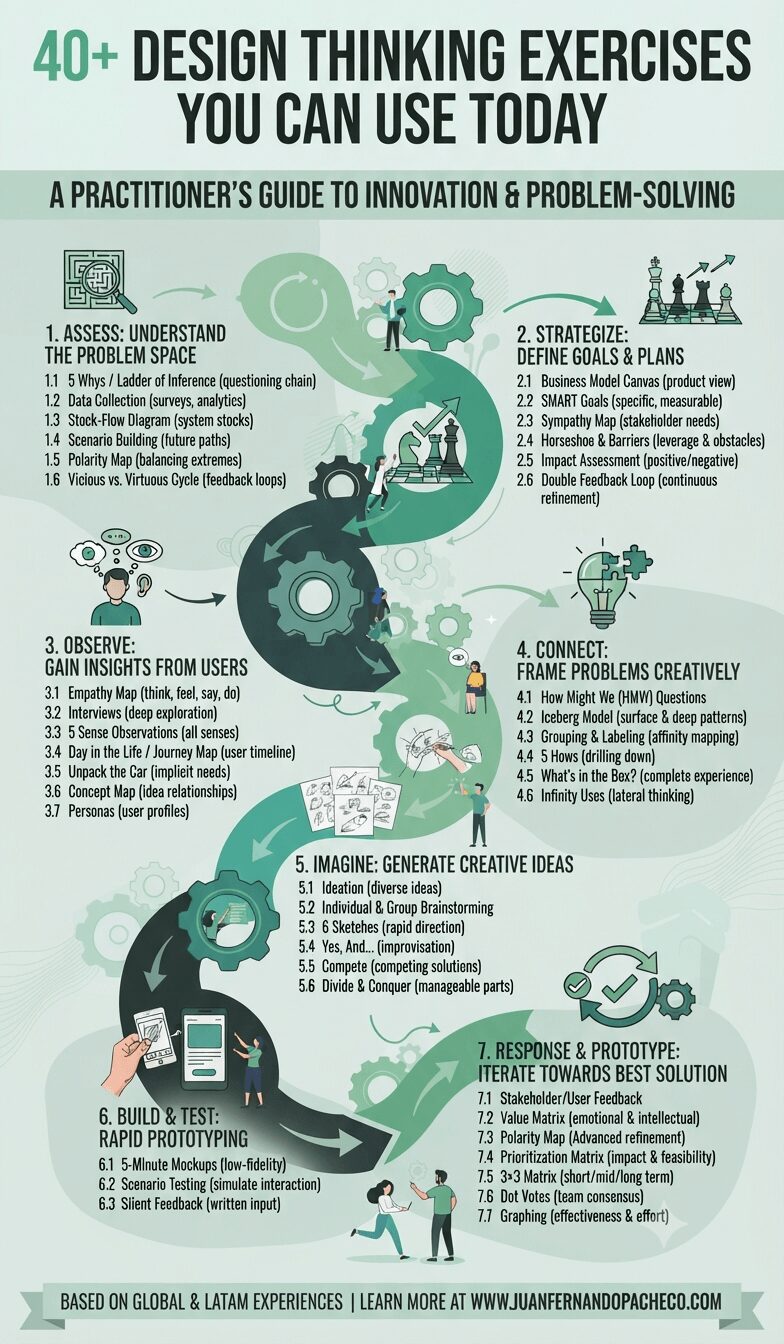
These 45+ design thinking exercises provide a practical and structured approach to problem-solving.
By incorporating these exercises into your UX practice, you can foster creativity, enhance user understanding, and drive impactful results.
Remember that design thinking is an iterative process, so don’t be afraid to experiment and adapt these exercises to fit your specific needs.
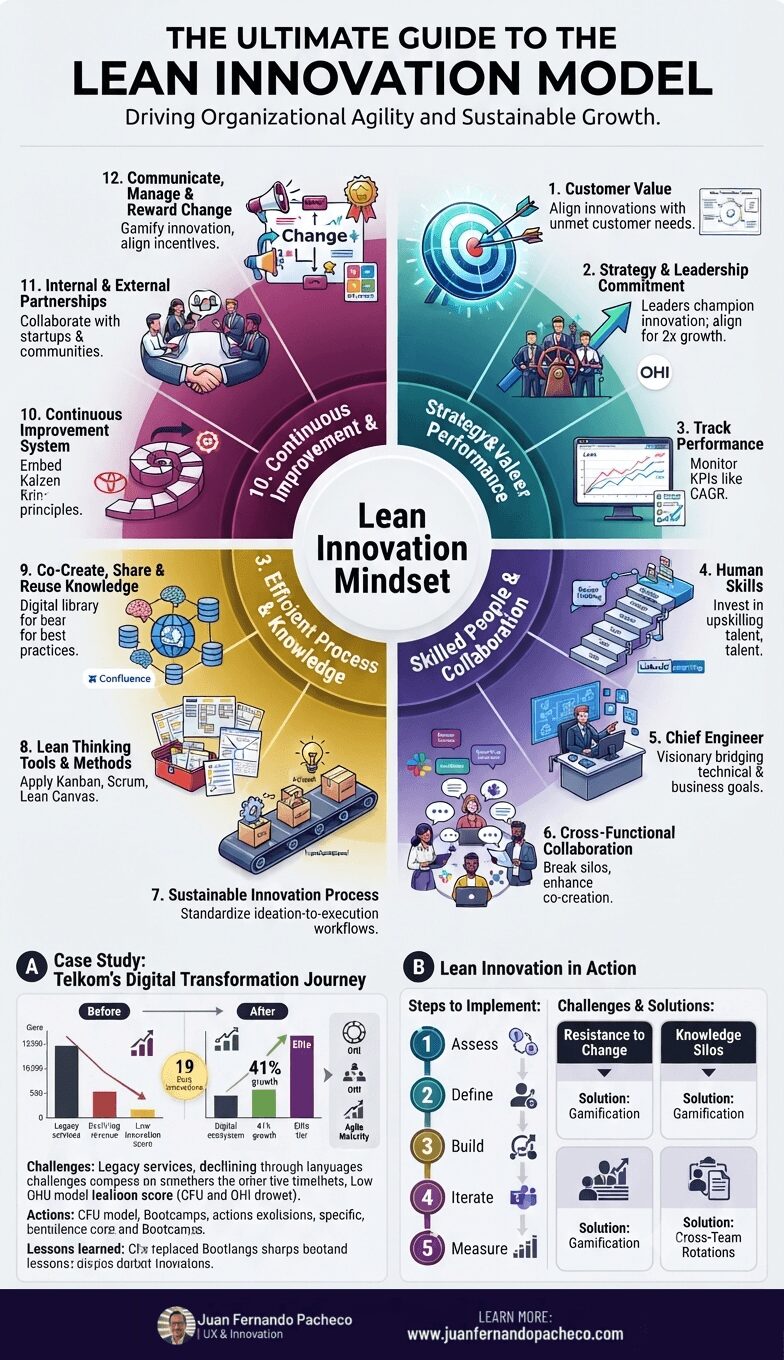
The Lean Innovation Model isn’t just a framework—it’s a mindset. By integrating customer value, agile structures, and continuous learning, organizations like Telkom can thrive in disruption.
Start your journey by auditing organizational health and embedding lean principles into every process.
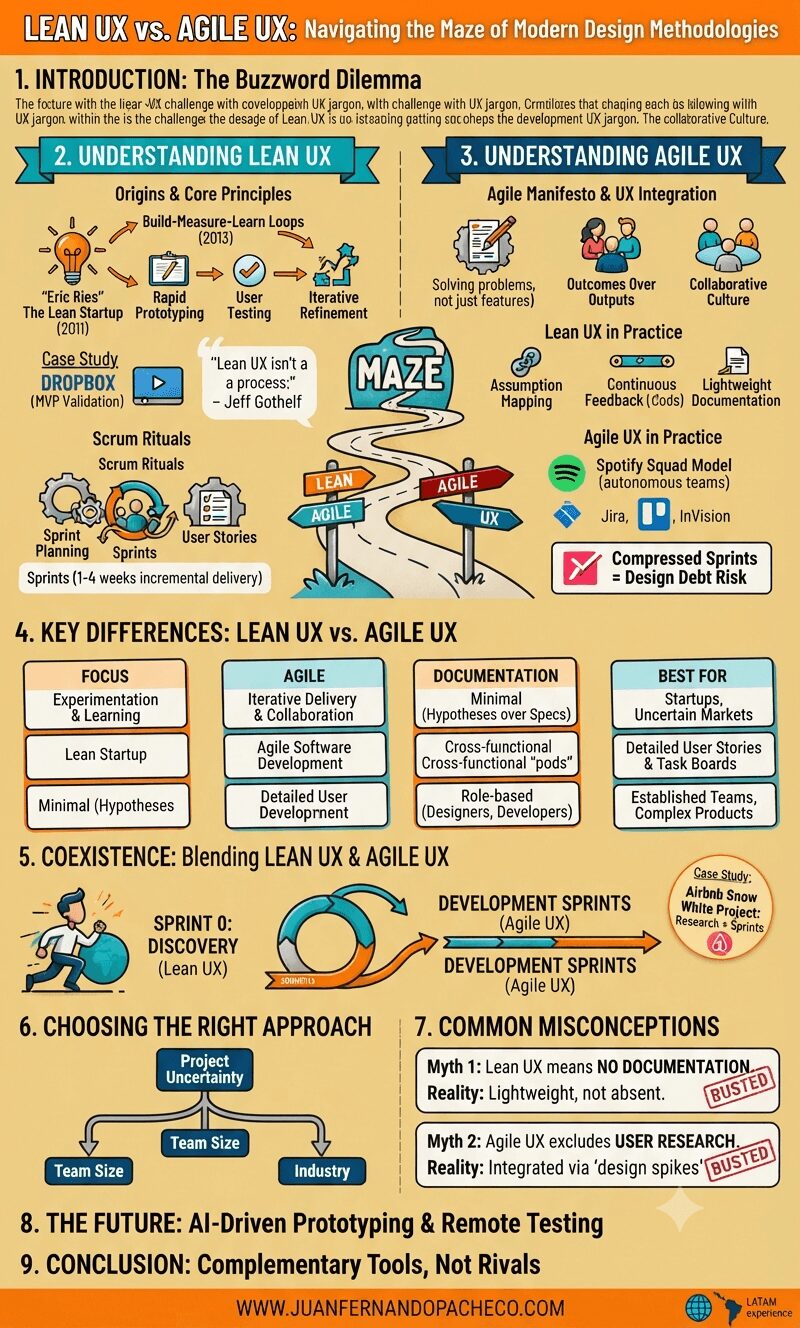
Lean UX and Agile UX are complementary tools, not rivals. By understanding their strengths, teams can navigate the buzzword labyrinth and deliver impactful user experiences.
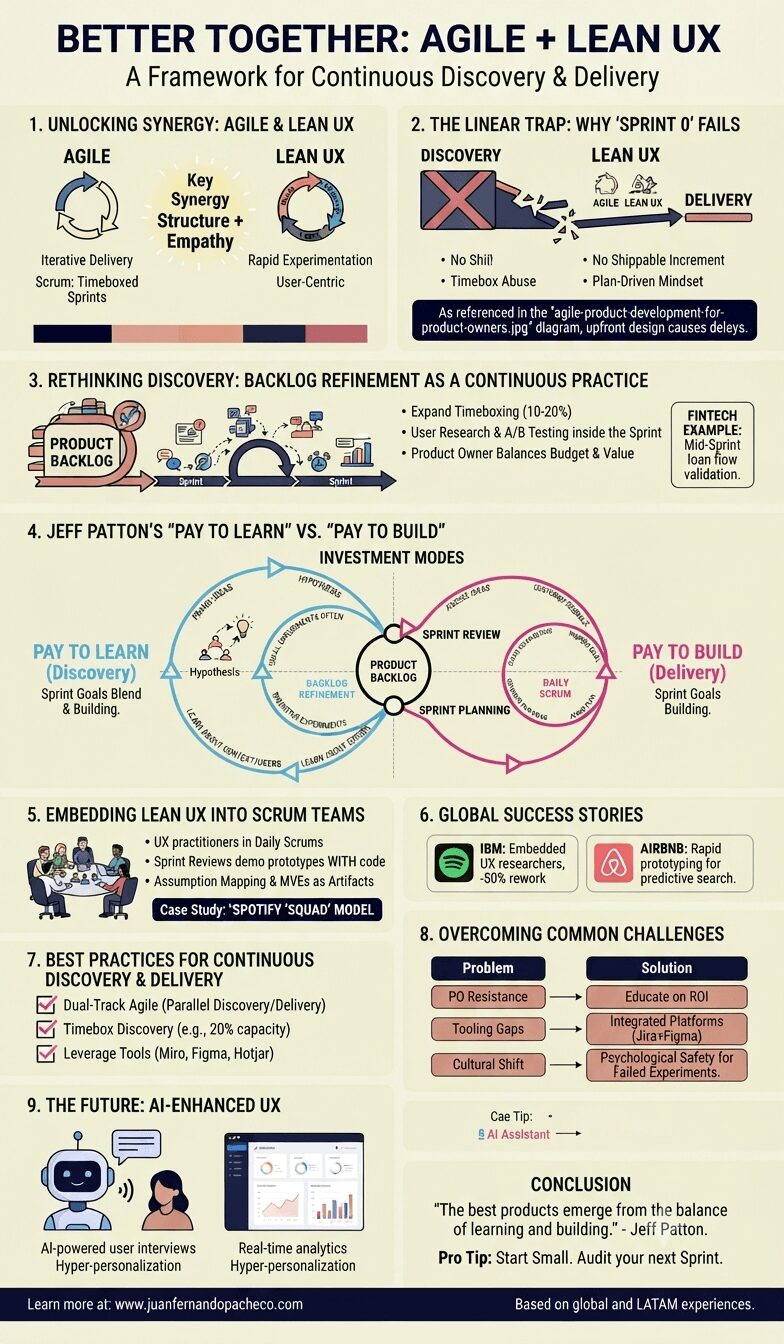
Agile + Lean UX are not competing frameworks—they’re complementary forces. By embedding continuous discovery into Sprints, teams can deliver value faster while staying user-centric. As Jeff Patton says, “The best products emerge from the balance of learning and building.”
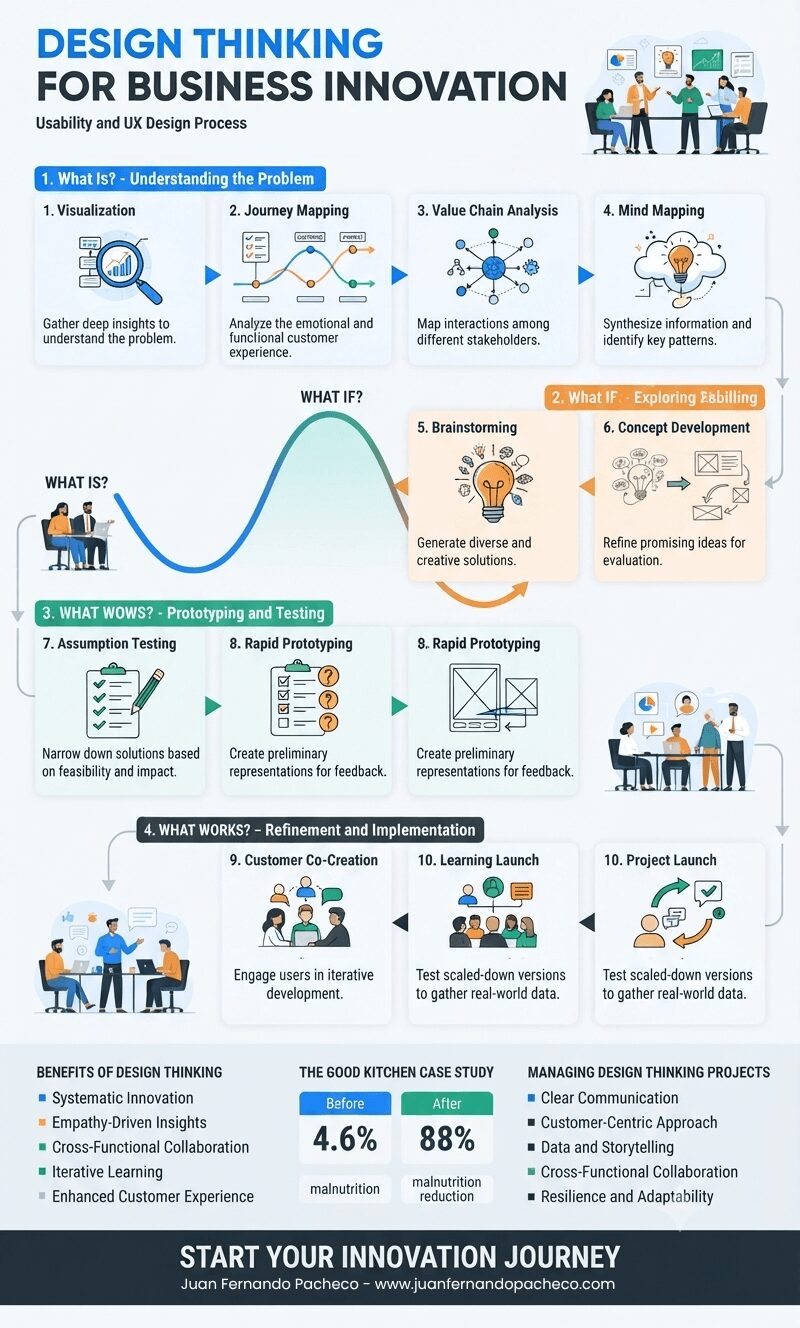
Design Thinking is not just a methodology—it is a philosophy that allows businesses to navigate uncertainty with creativity and confidence.
For businesses looking to integrate Design Thinking into their innovation strategy, the key is to start small, test often, and involve real users in the process.